© 2019 Author(s)
MERCHANDISE TRADE IN THE EAEU INTEGRATING
ENVIRONMENT
O
lenaH
recHysHkina1, M
aryias
aMakHavets21Economic Faculty, Historical and Cultural Heritage Department, Polessky State University, Pinsk 2Banking Faculty, Finance Department, Polessky State University, Pinsk
Manuscript received: July 24, 2019 Revised version: August 31, 2019
HrecHysHkina O., saMakHavets M., 2019. Merchandise trade in the EAEU integrating environment. Quaestiones
Geo-graphicae 38(4), Bogucki Wydawnictwo Naukowe, Poznań, pp. 163–174. 7 figs, 3 tables.
abstract: The paper aims to identify the main trends and recommendations for the development of merchandise trade
in the Eurasian Economic Union (EAEU) integrating environment through the analysis of its mutual and foreign
(in-ternal and ex(in-ternal) merchandise trade. The study is based on the official statistical data for 2014–2018 and economic comparisons and systematisation (including geographical systematisation). The results show that the intensification of mutual and foreign trade in the EAEU is possible by stimulating consumer and industrial demand, enhancing exports
of high tech products and diversifying exports, and strengthening the cooperation within the EAEU and with other countries and integration associations.
keywOrds: integrating environment, EAEU, merchandise trade, mutual trade, foreign trade.
Corresponding author: Olena Hrechyshkina, Historical and Cultural Heritage Department, Polessky State University, Dneprovskoy Flotilii Street, 23, Pinsk, 225710, Republic of Belarus; phone: +375444738943; e-mail: L_grechishkina@mail.ru
Introduction
The Eurasian Economic Union (EAEU) was established during the regional economic inte -grating processes in 2014 (Eurasian Economic Union 2014). The EAEU ensures a free movement of goods, services, capital and labour, as well as coordinated, coherent and unified economic poli -cies. A macroeconomic impact of establishing the EAEU is manifested in various aspects, includ-ing price reduction on merchandise, promotion of competition, an increase in production, the development of regional economic ties, encour-agement to technological development, and an increase in market capacity and GDP (National Bank of the Republic of Belarus n.d.).
The Republic of Armenia, the Republic of Belarus, the Republic of Kazakhstan, the Kyrgyz Republic and the Russian Federation are the EAEU member states. The economic integra -tion between these countries has been going on since the collapse of the Union of Soviet Socialist Republics (the USSR) (since 1991). However, it was the EAEU, which logically replaced the Eurasian Economic Community (EurAsEC, exist-ed from 2001 to 2014), that markexist-ed the new stage in economic integration in the post-Soviet space.
Nevertheless, traditionally, the first stage of international integration is the creation of a free trade zone. Thus, at present, the development of trade relations within the EAEU integrating en-vironment has already been the most intensive.
The importance of foreign trade in the econo-mies of the EAEU member states is confirmed by the world ratings. In particular, positions of the EAEU member states regarding “Trading across Borders” in “Doing Business 2019” are the fol -lowing: Armenia – 46, Belarus – 25, Kazakhstan – 102, Kyrgyzstan – 70, Russian Federation – 99 (World Bank Group 2019). Thus, in a dynamical-ly changing EAEU integrating environment, the position of Belarus regarding “Trading across Borders” is quite strong among the EAEU mem -ber states. It has improved by five positions since 2017 (World Bank Group 2019) as several reforms for further development of foreign trade have been implemented (Ministry of Economy of the Republic of Belarus 2018).
The theoretical background for the study is the scientific papers on the economic integration within the EAEU and the development of the foreign economic activity of the EAEU member states. During the last decade, a large number of academic writings were devoted to the general issues of integrating the relations of the EAEU member states (viartsinskaya 2013; Ziiaddulaev 2014; Daineko, Beresnev 2015; Ivanova 2015; Tsukarev 2015; vinokurov 2015; Presniakova et al. 2017; viartsinskaya 2018; Zhuravleva, Tutaeva 2018; Jumanova 2019; Nurmatov 2019; Zelenkov et al. 2019).
Some studies are devoted to the problems of trade relations of the EAEU member states with each other (Nurtasova et al. 2018; Kuskov, Paderina 2019; Spanov, Arbashiyeva 2019) and with third countries (Selisheva 2017; Bojcova, Fedorenko 2019).
The development experience of other integra-tion associaintegra-tions is worth noting. As far as the Asia-Pacific region is concerned, much research is devoted to the further trade liberalisation of the Asia-Pacific Economic cooperation (APEc) (Scollay, Gilbert 2000; Robinson, Thierfelder 2002; choi 2017), as well as the evolution of and trade trends in this association (Basu Das, Kawai 2016; Hur, lee 2017; Solis, Wilson 2017).
Concerning the European integration, there are also numerous relevant works in the field of the European Union (EU) foreign trade. These studies are mainly based on the gravity model and are divided logically into 2 types: those ded-icated to the intra-EU trade (Badinger, Breuss 2004; Kox et al. 2004; Shin, Serlenga 2007) and the
EU trade with other countries (Brenton, Manchin 2003; Antonucci, Manzocchi 2006; Mandelson 2006; Pastore et al. 2009; Bourdet et al. 2007; Gavin, Sindzingre 2008; Kehoe et al. 2019).
The relevance of the study is justified by the need to improve economic relations within the EAEU in achieving the official goal of its estab -lishment. This goal is to increase the competitive-ness of national economies and create conditions for stable development to enhance the living standards of the EAEU member states. At the same time, the trade relations within the EAEU and with third countries in a changing EAEU in-tegrating environment are the most rapidly de-veloping segments of integration and the basis for intensifying the integrating processes.
The authors pay attention to the fact that the creation of the EAEU in 2014 and its subsequent development has a definite effect on the mer -chandise trade and therefore consider the EAEU integrating environment as a factor influencing it. At the same time, the dynamics of the merchan-dise trade development among the EAEU mem-ber states can also affect the degree of integration between them. Therefore, given the importance of merchandise trade in the EAEU integrating en-vironment, the purpose of the paper is to identify the main trends in and recommendations for the development of merchandise trade in the EAEU integrating environment using a detailed analy-sis of economic indicators of mutual trade (inter-nal trade) and foreign trade of the EAEU member states with third countries (external trade).
The objectives of the paper are as follows: – assessment of the trade development in 2018
compared with 2014 (the EAEU foundation) and its dynamics for 2014–2018;
– identification of the predominance of exports or imports in mutual and foreign trade turn-over;
– identification of the individual role of the EAEU member states in merchandise trade; – definition of the possible ways to adapt the
EAEU trade policy to objectively emerging economic conditions in the integrating envi-ronment.
The paper is structured as follows. Section two reveals the methodological frameworks. Section three discusses indicators of mutual merchan-dise trade of the EAEU member states in the inte -grating environment. Section four represents the
trends in foreign merchandise trade of the EAEU with third countries. The last section contains the main conclusions and recommendations.
Methodology
The methodological basis of the study consists of the following general scientific methods that are used from the standpoint of dialectical princi-ples: analysis and synthesis, systematisation (in-cluding geographical systematisation), scientific abstraction, statistical methods, and economic and statistical comparisons.
The study draws on the fundamental official documents related to the creation and operation of the EAEU, including the Treaty on the EAEU (May 29, 2014), the Treaty on the EAEU Customs code (April 04, 2017), the common customs Tariff of the EAEU (the EAEU ccT) (October 18, 2016) and others. Сurrent information from the EAEU Portal is used to examine merchandise trade of the EAEU member states.
The well-known report of the World Bank “Doing Business” is also applied. It contains quantitative indicators that can be compared over time concerning business regulations that affect trade across borders of the EAEU member states.
It should be noted that the EAEU member states have independent policies in services trade (Evraziiskii ekonomicheskii soiuz n.d.). Therefore, the authors’ attention focuses on for-eign merchandise trade only and service trade is not a part of the study.
Next, the merchandise trade development of the EAEU is considered from the point of view of its division into mutual trade within the EAEU (internal trade) and foreign trade with third countries (external trade).
Development of mutual merchandise
trade in the EAEU integrating
environment
Development of mutual merchandise trade in the EAEU integrating environment is currently carried out by the EAEU customs code (Eurasian Economic Union 2017) and this implies trade among the EAEU member states. let us consider the development of mutual merchandise trade in terms of export development. This is important because increasing exports is one of the most ef -fective means of increasing a country’s income. Table 1 shows the dynamics of mutual merchan -dise exports.
Mutual merchandise exports declined sub -stantially (by 25.4%) and amounted to USD 45,615.6 million in 2015 compared to 2014. This decline was due to a decrease in average prices (by 19.2%) and sales (by 7.5%). These negative phenomena were mainly caused by the declines in global energy and commodity prices, unfa -vourable foreign conditions, and economic diffi -culties of the EAEU member states. In 2016, the negative trend persisted, but the pace of decline decreased. The mutual export decreased by 5.8% and amounted to USD 42,958.7 million. In do -ing so, average prices declined by 7.1%, while sales increased by 0.4% (Eurasian Economic commission 2017), reflecting a gradual adapta -tion to the prevailing condi-tions.
The positive trend was in 2017–2018. Mutual merchandise exports increased by 27.3% (to USD 54,697.9 million) in 2017, due to increasing av -erage prices (by 12.7%) and sales (by 13%). This growth was associated with a positive trend in trade development, which began in 2016 as well as with a rise in the world prices for oil and other commodities, and economic growth of the EAEU Table 1. Dynamics of the EAEU mutual merchandise export.
Countries million 2014 2015 2016 2017 2018
USD million USD rate [%]growth million USD rate [%]growth million USD rate [%]growth million USD rate [%]growth EAEU including: 61,183.3 45,615.6 74.6 42,958.7 94.2 54,697.9 127.3 59,721.1 109.2 Armenia 323.9 256.2 79.1 393.9 153.7 557.2 141.5 689.0 123.7 Republic of Belarus 16,179.1 11,007.8 68.0 11,384.8 103.4 13,651.1 119.9 13,891.8 101.8 Kazakhstan 7,155.1 5,120.3 71.6 3,930.2 76.8 5,262.6 133.9 5,892.0 112.0 Kyrgyzstan 637.6 410.1 64.3 445.5 108.6 541.5 121.5 568.4 105.0 Russian Federation 36,887.6 28,821.2 78.1 26,804.3 93.0 34,685.5 129.4 38,679.9 111.5 Source: own study based on the Eurasian Economic commission (n.d.).
member states. The positive trend continued in 2018, however, it was weaker than in 2017. The mutual export expanded by 9.2% and amounted to USD 59,721.1 million against the background of an increase in average prices by 2.5% and sales by 6.5%. Fig. 1 shows growth rates of mutual merchandise exports in the EAEU member states and the EAEU as a whole.
This graph illustrates faster growth rates of mutual exports from Armenia during 2014–2018, Belarus in 2016 and Kazakhstan in 2017–2018. The graph clearly shows that the growth rates of the EAEU mutual merchandise exports were almost equal to the growth rates of Russian exports. This is explained by the fact that the share of merchandise exports from the Russian Federation was the largest in the structure of the EAEU mutual exports. Fig. 2 shows the structure of the EAEU mutual merchandise exports by the
EAEU member states. The structure remained largely the same in 2014–2018. The share of ex -ports from the Russian Federation was almost 2/3 of the EAEU mutual exports. It increased by 4.4% and amounted to 64.8% in 2018. The share of Belarusian exports declined from 26.4% to 23.3%. The share of Kazakhstan decreased by 1.8% and equaled 9.9%. The share of Armenia, despite in -creasing sales, remained insignificant (1.1%), as was the share of Kyrgyzstan (0.9%).
Besides, it is appropriate to examine the struc-ture of the EAEU mutual merchandise trade in terms of export-import operations (Fig. 3). The data show that the EAEU member states were primarily merchandise importers (except for the Russian Federation). Thus, the share of imports of Kyrgyzstan amounted to 75.8%, Kazakhstan 69.2%, Armenia 67.6%, and Belarus 62.1% in 2018. Meanwhile, the share of Russian exports exceed-ed the share of imports by more than 2 times.
The Russian market was the main one for the EAEU member states in internal trade flows. In particular, the Russian market provided 96.8% of Armenia’s exports, 93.2% of Belarusian ex -ports, 87.6% of Kazakhstan’s ex-ports, 55.3% of Kyrgyzstan’s exports in 2018 (Eurasian Economic commission 2019). These data confirm the leading position of the Russian Federation in the EAEU. Therefore, there is a substantial dependence of macroeconomic indicators of the EAEU member states on the economy of the Russian Federation.
Thus, the main trends in merchandise trade within the EAEU are the following:
0% 20% 40% 60% 80% 100% 120% 140% 160% 180% 2015 2016 2017 2018 EAEU Armenia Republic of Belarus Kazakhstan Kyrgyzstan Russian Federation
Fig. 1. Growth rates of the EAEU mutual merchandise exports.
Source: own study based on the Eurasian Economic
Commission (n.d.).
Fig. 2. Share of the EAEU member states in mutual merchandise exports. Source: own study based on the Eurasian Economic commission (n.d.).
Armenia 0.5% Republic of Belarus 26.4% Kazakhstan 11.7% Kyrgyzstan 1.0% Russian Federation 60.4% 2014 Armenia 1.1% Republic of Belarus 23.3% Kazakhstan 9.9% Kyrgyzstan 0.9% Russian Federation 64.8% 2018
– mutual exports had a positive trend and in-creased by 9.2% in 2018 compared to 2017; – Russia has dominated mutual exports within
the EAEU member states (the share of Rus -sia’s trade was 64.8%);
– according to the structure of mutual trade, the EAEU member states (except for the Russian Federation) have been importers (Kyrgyzstan had the largest share, 75.8%);
– the Russian market is the main one for the ex-ports of the EAEU member states.
consequently, the analysis of the EAEU mu -tual merchandise trade revealed the export ori-entation of the EAEU member states towards the Russian Federation, as confirmed by other scientists (Skirko 2018). From this point of view, outward FDI may be interesting for every EAEU member state as a “factor of economic modern -isation on a debt-free basis, allowing to raise the technological level of business and to create new jobs” (Hrechyshkina, Samakhavets 2018: 342). The authors adhere to the opinion that the
intensification of foreign trade within the EAEU is possible not only due to the unified customs and tariff policy, but also by stimulating consum -er and industrial demand, including strengthen-ing cooperation relations in the EAEU (Skirko 2018).
Development of foreign merchandise
trade of the EAEU with third countries.
The dynamics of foreign merchandise trade of the EAEU with third countries are presented in Table 2. Foreign merchandise trade was charac -terised by the tendencies and factors which were identified for mutual trade. The negative trend of all indicators was observed in 2015–2016. At the same time, almost equal reduction in both merchandise exports and imports was in 2015. Then the reduction in imports was smaller than in exports in 2016. The growth in foreign trade was in 2017–2018. The foreign trade turnover
Fig. 3. Structure of mutual merchandise trade by the EAEU Member states in 2018. Source: own study based on the Eurasian Economic commission (n.d.).
24.2% 30.8% 32.4% 37.9% 67.0% 75.8% 69.2% 67.6% 62.1% 33.0% 0% 10% 20% 30% 40% 50% 60% 70% 80% 90% 100% Kyrgyzstan Kazakhstan Armenia Belarus Russian Federation Exports Imports
Table 2. Dynamics of foreign merchandise trade of the EAEU with third countries.
Period million USDTurnovergrowth rate Exports Imports Balance
[%] millionUSD growth rate [%] millionUSD growth rate [%] millionUSD
2014 873,099.7 n/a 555,618.0 n/a 317,481.7 n/a 238,136.3
2015 579,382.5 66.4 373,845.1 67.3 205,537.4 64.7 168,307.7
2016 509,372.7 87.9 308,264.8 82.5 201,107.9 97.8 107,156.9
2017 634,221.3 124.5 386,950.2 125.5 247,271.1 123.0 139,679.1
2018 753,417.4 118.8 490,637.5 126.8 262,779.9 106.3 227,857.6
of the EAEU increased by USD 119,196 million (by 18.8%) and reached USD 753,417.4 million in 2018. At the same time, exports increased by 26.8% and amounted to USD 490,637.5 million, and imports rose by 6.3% and amounted to USD 262,779.9 million.
However, despite the positive changes, it was not possible to reach the trade indicators of 2014. The foreign trade surplus, despite the negative trend, amounted to USD 227,857.6 million, which was 63% more than in 2017.
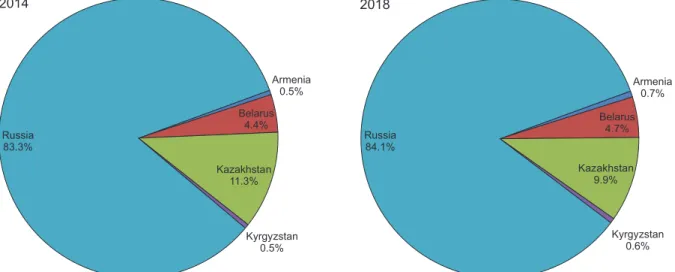
The share of each EAEU member state in the foreign trade turnover is presented in Fig. 4. Comparative analysis shows that there were no significant changes in the structure. The share of
foreign trade increased in some EAEU member states in 2018 compared to 2014: Russia – by 0.8%, Belarus – by 0.3%, Armenia – by 0.2%, Kyrgyzstan – by 0.1%. However, the share of Kazakhstan de -creased by 9.9%.
Fig. 5 shows the structure of foreign merchan -dise trade by the EAEU member states in 2018. Exports prevail in the structure, its share was 65.1% in 2018 (Fig. 5). Imports accounted for 34.9% of the EAEU foreign trade turnover in 2018 (Eurasian Economic Commission 2019). Thus, the main exporters were Kazakhstan (74.0%), Russia (65.1%) and Belarus (55.9%). The share of mer -chandise exports from Armenia and Kyrgyzstan was 32.8% and 27.6%, respectively.
Armenia 0.5% Belarus 4.4% Kazakhstan 11.3% Kyrgyzstan 0.5% Russia 83.3% 2014 Armenia 0.7% Belarus 4.7% Kazakhstan 9.9% Kyrgyzstan 0.6% Russia 84.1% 2018
Fig. 4. Share of the EAEU member states in foreign merchandise trade (in turnover). Source: own study based on the Eurasian Economic commission (n.d.).
Fig. 5. Structure of foreign merchandise trade by the EAEU member states in 2018. Source: own study based on the Eurasian Economic commission (n.d.).
27,6% 32,8% 55,9% 65,1% 74,0% 65,1% 72,4% 67,2% 44,1% 34,9% 26,0% 34,9% 0% 10% 20% 30% 40% 50% 60% 70% 80% 90% 100% Kyrgyzstan Armenia Belarus Russia Kazakhstan EAEU Exports Imports
In the commodity structure of the EAEU ex-ports to third countries (Table 3), such products predominated: mineral products (67.2% of the total exports), metals and products from them (9.6%) and chemical products (5.6 %). About 80% of export goods were sold by the Russian Federation. The largest share of the EAEU im-ports was that of machinery, equipment and
vehicles (44.5% of total imports), chemical prod -ucts (18.3%), and food prod-ucts and agricultur -al commodities (11.6%). More than 80% of im -ported goods were purchased by the Russian Federation.
The EAEU exports went to different regions and countries, mainly to Europe. Fig. 6 shows the distribution of the EAEU merchandise exports to
Fig. 6. Geographical structure of the EAEU merchandise exports to Europe in 2018. Source: own study based on the Eurasian Economic commission (n.d.).
Table 3. commodity structure of foreign merchandise trade by the EAEU member states in 2018.
Products Exports Imports
million USD share [%] million USD share [%]
Food products and agricultural commodities 25,022.5 5.1 30,482.5 11.6
Mineral products 329,708.4 67.2 3,941.7 1.5
Chemical products 27,475.7 5.6 48,088.7 18.3
Wood, pulp and paper products 14,228.5 2.9 4,204.4 1.6
Textile products and shoes 981.3 0.2 17,606.3 6.7
Metals and products from them 47,101.2 9.6 18,131.8 6.9
Machinery, equipment and vehicles 14,719.1 3.0 116,937.1 44.5
Others 31,400.8 6.4 23,387.4 8.9
Total 490,637.5 100.0 262,779.9 100.0
Europe in 2018. The largest share of exports was to Norway (27.56%). Among the EU countries (50.5% of total exports), the most significant were deliveries to the Netherlands (10.4%), Germany (7.4%), Italy (5.8%) and Poland (3.8%). 26.7% of goods were exported to the APEC countries, including 12.8% to china, 4.3% to South Korea, and 2.8% to Japan and the United States. The countries of the Commonwealth of Independent States (CIS) (excluding the EAEU countries) sold 5.2% of exported goods, including 3% to Ukraine.
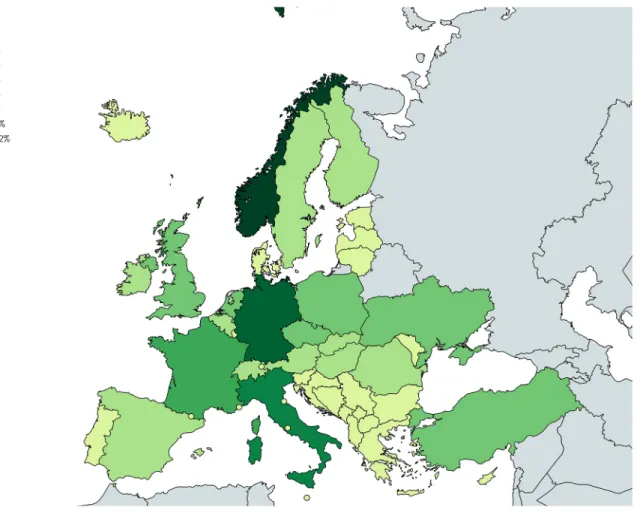
Imports were mainly from the APEC countries and Europe. Among the APEc countries (43.2% of total merchandise imports), the largest vol-umes were from china (24.1%), the United States (5.5%), Japan (3.6%) and South Korea (3.1%). Fig. 7 shows the distribution of the EAEU merchan -dise imports from Europe in 2018. The largest share of imports was from Norway (33.22%). Among the EU countries (39.8%), the most sig -nificant deliveries were from Germany (11.2%), Italy (5%), and France (4.1%). 4.4% of imported
goods were purchased from the CIS countries, including 2.8% from Ukraine.
It is possible to identify the main trends in the development of foreign merchandise trade in the EAEU integrating environment, which are the following:
– the EAEU foreign trade turnover increased by 18.8% in 2018;
– the share of the Russian Federation dominat-ed in the EAEU foreign trade turnover (Rus-sia’s share was 84.1% in 2018);
– exports prevailed in the structure of the EAEU foreign trade turnover (65.1% in 2018);
– in foreign trade with third countries Kazakh -stan and Russia were exporting countries and Armenia and Kyrgyzstan were importing ones.
Therefore, the position of the EAEU mem-ber states in foreign trade with third countries should be strengthened, primarily in exports at present. The Russian scientists Ruchkina and Shaidullina (2019) hold the same opinion and
Fig. 7. Geographical structure of the EAEU merchandise imports from Europe in 2018. Source: own study based on the Eurasian Economic commission (n.d.).
identified the EAEU exports constraints to third countries. They also consider it expedient to in-crease the volume of foreign trade of the EAEU member states with third countries for the eco -nomic growth of national economies. At the same time, strengthening the EAEU trade and economic cooperation with other countries and integration associations is becoming a prospect for the development of the EAEU merchandise trade. Many countries express a desire to co-operate with the EAEU. Agreements have been signed with vietnam (2015), Iran (2018), china (2018) and cuba (2018).
It is worth mentioning that the results of the intensification of foreign trade within the EAEU integrating environment could be improved. For example, the following measures are being implemented in Belarus, which allowed it to be -come a leader among the EAEU member states regarding “Trading across Borders”, and could be recommended for others (Postanovlenie Soveta Ministrov 2016):
– creation of a nationwide automated informa-tion system called a uniform foreign trade portal. Registration on the portal allows busi -ness entities to implement foreign trade pro-cedures on the principle of “one window” in an electronic format;
– performance of certain customs operations by customs authorities through an information system without the participation of customs; – elimination of procedural and regulatory
barriers to foreign trade following the WTO Agreement on Trade Facilitation;
– simplification of the conducting and control of foreign trade operations.
It should be noted that improving foreign trade, applying tax and financial instruments, and creating a single market for government or-ders could be instruments to solve the problem of the lack of mechanisms to stimulate mutual in-vestment in the EAEU (Presniakova et al. 2017). The authors believe that the EAEU member states ought to expand cooperation among themselves in the manufacture of products on a cooperative basis (especially products with a high share of value-added in the price – high-tech products) as well as exports of such products to third countries, and to diversify exports. This direction is seen as a “driver” for the development of foreign merchan -dise tradein the EAEU integrating environment.
Conclusion
The EAEU integrating environment is distin-guished by its sensitivity to changes in the global economy and geopolitics. Therefore, an urgent task is to find opportunities to adapt to these challenges. The paper provides an in-depth anal-ysis of economic indicators of the EAEU mutual and foreign trade. As a result of the analysis, the main trends in merchandise trade of the EAEU member states among themselves and with third countries for further development were identi-fied. These trends reveal that the advantages of integration have not been fully realised yet.
The EAEU member states do not apply cus -toms duties, non-tariff regulation systems, and other prohibitions and restrictions in order to create an effectively operating internal market of the EAEU in the implementation of internal trade within the EAEU. Nevertheless, the dynamics of the EAEU mutual merchandise exports decreased by USD 1,462.2 million (by 2.4%) in 2018 in com -parison with 2014. Exports from Armenia (more than twice) and the Russian Federation grew, while exports from Belarus, Kazakhstan and Kyrgyzstan declined. The share of the Russian Federation in exports remains significant – 64.8% in 2018, and this means an increase of 4.4% com -pared to 2014.
The development of the EAEU foreign mer-chandise trade with third countries is based on the EAEU CCT (as for imports), and the EAEU member states have greater autonomy regard -ing exports. Imports decreased by USD 54,701.8 million or 17.2%, and exports decreased by USD 64,980.5 million or 11.7% in 2018 compared to 2014.
The dynamics of mutual trade within the EAEU and foreign trade with third countries shows that the absolute indicators of trade turn -over have not reached the 2014 figures, which were the EAEU foundation and the best in the analysed period. A sharp drop in the indicators of internal and external merchandise trade is no-ticeable. The EAEU mutual merchandise exports decreased by 25.4% and exports to third coun -tries also decreased by 32.7% in 2015 compared to 2014. Then the indicators began to increase again, but the level of 2014 has not been reached yet.
The negative dynamics in the EAEU trade in-dicators is explained fairly by the fall in world
oil prices and commodities, and devaluation processes in the EAEU member states during the analysed period. Moreover, the drop in foreign trade with third countries was even greater than in mutual trade. Therefore, one of the current trends is a gradual increase in the EAEU trade volumes after a significant fall in the first year of the EAEU foundation. The identification of com -modity groups which may increase exports both within the EAEU and in trade with third coun-tries can be recommended.
Additionally, the Russian Federation occupies a leading position both in the EAEU mutual and foreign trade, and the Russian market is the main market for the products from other EAEU mem-ber states. The exports of products manufactured on a cooperative basis in the EAEU and diversi -fied exports to third countries can be proposed as a recommendation for the development of inter-nal and exterinter-nal trade in the EAEU integrating environment.
The authors emphasise the idea that the de-velopment of merchandise trade is a complex phenomenon nowadays, especially in the face of a constantly changing EAEU integrating envi-ronment, which depends on the actions of each member state and external factors. Only the pur -poseful simultaneous development of the trade regulatory framework within the EAEU, the improvement in trade conditions for all partici-pants of export-import operations, the introduc-tion of a paperless trade mechanism in the EAEU and advanced training of customs officials will increase the volume of mutual trade between the EAEU member states as well as intensify and diversify exports from the EAEU member states to third countries. These are the main directions for the successful development of the EAEU merchandise trade as a whole in a globalised and highly digitalised international business environment.
References
Antonucci D., Manzocchi S., 2006. Does Turkey have a spe -cial trade relation with the EU? Economic Systems 30(2):
157–169. DOI 10.1016/j.ecosys.2005.10.003.
Badinger H., Breuss F., 2004. What has determined the rapid post-war growth of intra-EU trade? Review of World
Eco-nomics 140(1): 31–51. DOI 10.1007/BF02659709.
Basu Das S., Kawai M., 2016. Trade regionalism in the
Asia-Pa-cific: Developments and future challenges. ISEAS – yusof
Ishak Institute, Singapore.
Boitsova M.I., Fedorenko K.P., 2019. Izmeneniia v dinamike i strukture rossiiskogo eksporta vo vetnam posle pod
-pisaniia Soglasheniia o zone svobodnoi torgovli mezhdu EAES i SRv (changes and structure of Russia’s imports from vietnam after signing Free Trade Agreement be
-tween the EAEU and the SRv). Russian Foreign Economic
Journal 1: 24–35.
Bourdet y., Gullstrand J., Olofsdotter K., 2007. The European Union and developing countries: Trade, aid and growth in an
integrating world. Edward Elgar Publishing, cheltenham.
Brenton P., Manchin M., 2003. Making EU trade agreements work: The role of rules of origin. The World Economy
26(5): 755–769. DOI 10.1111/1467-9701.00545.
choi J., 2017. Future of the East Asian economy in changing global value chains and trade. Journal of APEC Studies
9(1): 1–14.
Daineko А.E., Beresnev D.v., 2015. Sovershenstvovanie in -tegratsionnykh protsessov v ramkakh Evraziiskogo eko-nomicheskogo soiuza (Improving the integration pro-cesses within the framework of the Eurasian Economic Union). Eurasian Integration: Economy, Law, Policy 17: 19–27.
Eurasian Economic Commission, n.d. Analiticheskie materialy
(Analytical materials). Online: eurasiancommission.org/ ru/act/integr_i_makroec/dep_stat/tradestat/analyt
-ics/Pages/default.aspx (accessed: 17 March 2019). Eurasian Economic commission, 2017. Doklad “O sostoianii
vzaimnoi torgovli mezhdu gosudarstvami – chlenami
Evra-ziiskogo ekonomicheskogo soiuza v 2015–2016 godakh”
(Re-port “On the state of mutual trade between the Eurasian Economic Union member states in 2015–2016”). Online: eurasiancommission.org/ru/act/integr_i_makroec/ dep_stat/tradestat/analytics/Documents/report/Re
-port_2015-2016.pdf#pagemode=bookmarks (accessed: 15 March 2019).
Eurasian Economic Commission, 2018. Vzaimnaia torgovliai.
Ianvar–dekabr 2018 (Mutual trade. January–December
2018). Online: eurasiancommission.org/ru/act/inte
-gr_i_makroec/dep_stat/tradestat/tables/intra/Pag
-es/2018/12.aspx (accessed: 15 March 2019).
Eurasian Economic Commission, 2019. Ob itogakh vneshnei i vzaimnoi torgovli tovarami Evraziiskogo ekonomicheskogo
soiuza (On the outcome of mutual merchandise trade of
the Eurasian Economic Union. January–December 2018). Online: eurasiancommission.org/ru/act/integr_i_mak
-roec/dep_stat/tradestat/analytics/Documents/ex
-press/December2018.pdf (accessed: 16 March 2019).
Eurasian Economic Union,2014. Dogovor o Evraziiskom
eko-nomicheskom soiuze (Treaty on the Eurasian Economic
Un-ion). Online: eaeunion.org/files/history/2014/2014_2. pdf (accessed: 15 March 2019).
Eurasian Economic Union, 2017. Dogovor o Tamozhennom kodekse Evraziiskogo ekonomicheskogo soiuza ot 11.04. 2017
(Treaty on the Customs Code of the Eurasian
Econom-ic Union dated 04.04.2017). Online: docs.eaeunion.org/ docs/ru-ru/01413569/itia_12042017 (accessed: 15 March
2019).
Evraziiskii ekonomicheskii soiuz: v interesakh biznesa i grazhdan
(Eurasian Economic Union: in the interests of business and citizens), n.d.. Online: eurasiancommission.org/ru/ act/integr_i_makroec/dep_razv_integr/Documents/
Издания/Бизнес%20и%20граждане (accessed: 15
March 2019).
Gavin B., Sindzingre A., 2008. EU trade relations with emerg-ing Asia: Identifyemerg-ing the issues. Asia Europe Journal 7(1): 9–22. DOI 10.1007/s10308-008-0220-0.
Kehoe l., Reis T., virah-Sawmy M., Balmford A., Kuemmer
-le T., 2019. Make EU trade with Brazil sustainab-le. Science
364(6438): 341.1–341. DOI 10.1126/science.aaw8276. Kox H., lejour A., Montizaan R., 2004. Intra-EU trade and
investment in service sectors, and regulation patterns. CPB
Memorandum 102, CPB Netherlands Bureau for Eco-nomic Policy Analysis.
Hrechyshkina O., Samakhavets M., 2018. Importance of
foreign direct investment in financing for innovative development of the Republic of Belarus. Marketing and
Management of Innovations 4: 339–348. DOI 10.21272/
mmi.2018.4-29.
Hur J., lee H., 2017. APEc has indeed created intra-region -al trade: A systematic empiric-al an-alysis. The
Singa-pore Economic Review 62(05): 1077–1095. DOI 10.1142/
S0217590815501039.
Ivanova E.M., 2015. Evraziiskaia integratsiia: put ot SNG k
EAES (Eurasian integration: From CIS to EAEU). Russian
Foreign Economic Journal 6: 112–119.
Jumanova R.А., 2019. vneshneekonomicheskaia deiatelnost Respubliki Kazakhstan: uchastie v mezhdunarodnoi tor -govle i v protsessakh investirovaniia (Foreign economic
activity of the Republic of Kazakhstan: Participation in
international trade and in investment processes). Vestnik
Instituta ekonomiki Rossiiskoi akademii nauk 1: 175–190. DOI
10.24411/2073-6487-2019-10012.
Kuskov А.N., Paderina E.v., 2019. Analiz i otsenka vli
-ianiia vzaimnoi torgovli na vvp gosudarstv-chlenov EAES (Analysis and estimation of the influence of mutual trade on GDP EAEU member state). In: Ekono-mika i predprinimatelstvo: aktualnye voprosy, tendentsii
i perspektivy razvitiia (Economics and
entrepreneur-ship: Current issues, trends and development
pros-pects): 35–40. Online: domglobus.ru/wp-content/up
-loads/2019/01/%D0%A1%D0%91-12.pdf (accessed: 25
March 2019).
Mandelson P., 2006. Bilateral agreements in EU trade pol
-icy. Online: kita.net/biz/html/kotis/main_report_ atta/865_1_MandelsonSpeechlSE(Oct9,2006).pdf (ac -cessed: 23 August 2019).
Ministry of Economy of the Republic of Belarus, 2018. Re-formy, realizovannye v period s 01.06.2017 do 01.06.2018
(Reforms implemented in the period from 01.06.2017 to 01.06.2018). Online: economy.gov.by/ru/plan_c-ru/ (ac -cessed: 14 March 2019).
National Bank of the Republic of Belarus, n.d.. Evraziiskii
eko-nomicheskii soiuz: etapy formirovaniia (Eurasian Economic
Union: stages of formation). Online: nbrb.by/today/In
-ternationalcooperation/EEU/Formation.pdf (accessed: 15 March 2019).
Nurmatov T., 2019. Perspectives of the Kyrgyz Repub -lic on Eurasia. India Quarterly 75(1): 108–113. DOI: 10.1177/0974928418821472.
Nurtasova B.E., Sadykhanova G.A., Turginbayeva A.N., ce -letti D., 2018. The trade and investment cooperation of the EAEU Countries. The Journal of Economic Research &
Business Administration 126(4): 117–126. Online: be.ka
-znu.kz/index.php/math/article/view/2965 (accessed 06 April 2019).
Pastore F., Ferragina A., Giovannetti G., 2009. A tale of par-allel integration processes: A gravity analysis of EU trade with Mediterranean and central and eastern European countries. Review of Middle East Economics and Finance
5(2). DOI 10.2202/1475-3693.1228.
Postanovlenie Soveta Ministrov Respubliki Belarus “O Gosu-darstvennoi programme “Maloe i srednee predprinimatelstvo
v Respublike Belarus” na 2016–2020 gody” № 149 ot 23 fe
-vralia 2016 g. (Resolution of the Council of Ministers of
the Republic of Belarus “On the State Program “Small and medium-sized business in the Republic of Belarus” for 2016–2020” No. 149 of February 23, 2016), 2016. On
-line: pravo.by/document/?guid=3871&p0=c21600149 (accessed: 16 March 2019).
Presniakova E.v., Mateichuk T.S., Zaitseva E.v., 2017. Me-khanizm stimulirovaniia vzaimnykh investitsii Respubliki Belarus i gosudarstv-chlenov Evraziiskogo ekonomicheskogo
soiuza (Mechanism for encouraging mutual investments
of the Republic of Belarus and the Eurasian Economic Union member states). Belorusskaia nauka, Minsk. Robinson S., Thierfelde K., 2002. Trade liberalisation and
regional integration: The search for large numbers. The Australian Journal of Agricultural and Resource Economics
46(4): 585–604. DOI 10.1111/1467-8489.t01-1-00057. Ruchkina G.F., Shaidullina v.K., 2019. Faktory, zatrudniai
-ushchie eksport tovarov EAES v treti strany i
ponizhai-ushchie eksportnuiu konkurentosposobnost Rossii (Fac -tors hindering the EAEU exports to third countries and reducing Russia’s export competitiveness). Economics,
Taxes & Law 12(1): 136–143. DOI
10.26794/1999-849X-2019-12-1-136-143.
Scollay R., Gilbert J., 2000. Measuring the gains from APEc trade liberalisation: An overview of cGE assessments.
The World Economy 23(2): 175–197. DOI
10.1111/1467-9701.00267.
Selisheva T.А., 2017. Sopriazhenie EAES i proekta “Ekonom -icheskii poias Shelkovogo puti” kak novaia model
evra-ziiskoi integratsii (conjunction of EEc and the “Econom
-ic zone of the Great Silk Road” project as a new model of
Eurasian integration). Problems of Modern Economics 4(64): 25–29.
Shin y., Serlenga l., 2007. Gravity models of intra-EU trade:
Application of the CCEP-HT estimation in
heterogene-ous panels with unobserved common time-specific fac -tors. Journal of Applied Econometrics 22(2): 361–381.
Skirko N.I., 2018. Razvitie vneshnei torgovli Respubliki Belarus v
usloviiakh stanovleniia edinogo rynka EAES (Development
of foreign trade of the Republic of Belarus in the context of the formation of a single EAEU market). Online: elib. bsu.by/bitstream/123456789/216033/1/122-126.pdf
(accessed: 20 March 2019).
Spanov M., Arbashiyeva A., 2019. The role of border coop
-eration of Kazakhstan with the EAEU countries in the economic development of cross-border regions. The
Jour-nal of Economic Research & Business Administration 126(4):
127–138.
Solis M., Wilson J., 2017. From APEc to mega-region
-als: The evolution of the Asia-Pacific trade ar -chitecture. The Pacific Review 30(6): 923–937. DOI 10.1080/09512748.2017.1305438.
viartsinskaya T.S., 2013. Metodicheskie osnovy razrabotki
kompleksa indikatorov dlia otsenki ekonomicheskoi
in-tegratsii regionov stran-chlenov EEP (Methodical basis
for the development of the set of assessment indicators of the economic integration of the regions of the CES
member countries). Journal of Eurasian Economic Integra-tion 2(19): 21–44.
viartsinskaya T.S., 2018. Teoreticheskie i prakticheskie osnovy ekonomicheskoi integratsii regionov stran – chlenov EAES:
na primere uchastiia Respubliki Belarus (Theoretical and
practical bases of economic integration of regions of the EAEU member states: On the example of the Republic of
Belarus participation). Belaruskaia navuka, Minsk.
vinokurov E., 2015. Opyt regionalnykh integratsionnykh obieedinenii: uroki dlia EAES (Experience of regional
integrational associations: Lessons for EAEU). Journal of
Eurasian Economic Integration 2(27): 94–97.
vinokurov E., Tsukarev T., 2015. Agenda for the EEU
Economy. Valdai Papers 25. Online: eabr.org/upload/ iblock/1e0/agenda_for_the_eeu_economy.pdf (ac
-cessed: 15 March 2019).
World Bank Group, 2019. Doing Business 2019. Training for
reform (16th ed.). D.c. Washington. Online: worldbank.
org/content/dam/doingBusiness/media/Annual-Re
-ports/English/DB2019-report_web-version.pdf (ac
-cessed: 15 March 2019).
Zelenkov y., Spitsina D., Ogloblina E., 2019. The Eurasian Eco -nomic Union: At a crossroads? In: 37th International
Scien-tific Conference on Economic and Social Development – “Socio
Economic Problems of Sustainable Development”. Online:
researchgate.net/profile/lukasz_Sulkowski/publica -tion/331321002_Organizational_Identity_of_Universi -ty_in_Merger_Process_w_37th_International_Scientific_ conference_on_Economic_and_Social_Development_-_ Socio_Economic_Problems_of_Sustainable_Develop -ment_-_Baku_14-15_/links/5c7512bf458515831f702381/ Organizational-Identity-of-University-in-Merger-Pro-cess-w-37th-International-Scientific-conference-on-Eco -nomic-and-Social-Development-Socio-Economic-Prob -lems-of-Sustainable-Development-Baku-14-1.pdf (accessed: 21 March 2019).
Zhuravleva G.P., Tutaeva D.R., 2018. EAES kak novyi etap
mezhdunarodnoi integratsii (The Eurasian Economic Union as a new stage in international integration).
Vest-nik of the Plekhanov Russian University of Economics 4: 190–
196. DOI 10.21686/2413-2829-2018-4-190-196.
Ziiaddulaev N., 2014. EAES: mezhdu politikoi i ekonomikoi
(EAEU: Between politics and economy). Theoretical and