J.A. Jacko (Ed.): Human-Computer Interaction, Part I, HCII 2009, LNCS 5610, pp. 242–251, 2009. © Springer-Verlag Berlin Heidelberg 2009
Mobile Application User Interfaces
José Eustáquio Rangel de Queiroz and Danilo de Sousa FerreiraFederal University of Campina Grande,
Electrical Engineering and Computer Science Center – Computer Science Department, Av. Aprígio Veloso, s/n – Bodocongó, Campina Grande, CEP 58109-970, Paraíba, Brazil
{rangel,danilo}@dsc.ufcg.edu.br, {rangeldequeiroz,danilo.sousa}@gmail.com
Abstract. This paper focuses on a hybrid approach for the evaluation of mobile application UI, based upon a set of well known techniques for usability evalua-tion. Two perspectives of the problem are focused: (i) the user’s perspective, which is expressed by user’s perception of the application; and (ii) the special-ist’s perspective, which is expressed by his/her considerations from the point of view of the user-application interaction, and from the point of view of the HCI community as well. Further comparisons between a lab and field evaluation ap-proaches are given for a case study involving an Internet tablet. Conclusions are given concerning on how to apply the experience acquired by evaluating con-ventional UI in the mobile technology domain.
Keywords: Usability evaluation, mobile devices, multidimensional approach.
1 Introduction
In recent years, a variety of mobile computing devices has emerged, including portables, palmtops, and PDAs. In consequence, the evolution of mobile computing devices has imposed a clear need for evaluation methods that are specifically suited to mobile de-vices. Nonetheless, the more evolved is the computing market toward mobile computing systems, the more difficult becomes for HCI evaluators to choose among the approaches for mobile application UI usability evaluation recently proposed in the literature. It is a fact that a user is likely to be mobile is the single greatest difference in context between users of mobile and desktop devices, and of course that mobility leads to dynamic changes in users’ context. But it has to be also taken into account that it is difficult, if not impossible, to compare between different studies, based on a plethora of claims made without solid statistical results. Given the inherent features of these devices (e.g., mobility, restrictive I/O and storage capabilities, and dynamic use contexts), they has imposed a clear need for specifically suited evaluation methods. One of the major ques-tions in the literature is related to the possibility of adapting concepts, methodologies, and approaches commonly used in traditional lab and field testing of desktop applica-tions to mobile ones. Another question has been related to whether to adopt a field or a lab approach. However, little discussion is given of which technique or combination of them is best suited for a specific application and its context of use. Beyond these
levels of choice and for a successful choice, it seems equally essential to know about the effectiveness of the chosen approach. Practitioners need to know which methods are more effective and in what ways and for what purposes. Otherwise the evaluation process may result in a big effort with a small payoff.
2 Usability Evaluation for Mobile Devices
Usability data typically consists of any kind of information which can be used as meas-ures or identification keys for factors affecting the usability of a system. Such kinds of data are collected by usability evaluation methods and techniques that can assign values to usability dimensions for evaluating different kinds of UI [1] and/or indicate usability problems or other design deficiencies in UI [2]. Usability data are usually gathered via either analytic or empirical methods [2][3]. Analytic or expert-based methods are often conducted by HCI experts and do not involve human participants performing the tasks, i.e. they rely frequently on the specialists' judgment. On the other hand, in spite of being also conducted by HCI experts, empirical or used-based methods involve data collection of human usage. Usability diagnosis basically begins with raw observational data often categorized into models/ frameworks emphasizing either (i) the nature/fidelity of the ar-tifact being evaluated; (ii) the context of use (involving user and social relations, tasks and psychological factors, and environmental aspects); (iii) the approach adopted for capturing the data (including the expended resources, the involved degree of formality, rigor, and amount of designers/evaluators and users); or (iv) the goal of the collection effort [4][5][6]. Some of those models and frameworks are aligned to ISO usability dimensions [7], which are commonly taken to include the aspects efficiency, effective-ness, and subjective satisfaction in a HCI process. It is undeniable that usability evalua-tion effort for desktop systems has grown especially in the last decade. In spite of debates still taking place within the HCI area, they are often based on a tacit understand-ing of basic concepts. Extensive guidelines have been written for describunderstand-ing how usabil-ity evaluation in controlled environments should be conducted (e.g., [3][8]). Further, experimental results highlighting pros and cons of different techniques are available to be applied (e.g., [9]).
Especially in the past decade, technological advances and methodological approaches in HCI have been challenged by the growing focus on applications for mobile comput-ing devices. Several authors (e.g., [10][11]) argue that mobile computcomput-ing demands not only real users but also a real or simulated context with device interaction tasks as well as real tasks or realistic task simulations. The question about carrying on mobile device evaluation in a lab or field context has also been discussed (e.g. [9][12]), the effective-ness of the approach depending on the relevance of the results presented, and on the quality of the data analysis process as well. However, despite presenting data analysis results, the reports usually omit some important details of the data gathering and the analysis process. For sure, they could guide choices, and give a comprehensive view of the approach. While a strong effort of HCI research has been devoted on alternatives for data collection issues, data analysis/validation are presented in rare cases (e.g., [3][12]). In consequence, the evaluator is unable to replicate appropriately and successfully the reported findings in other contexts. As for empirical data analysis, many methods and techniques have been employed for field testing data, video data, expert data, or
head-mounted video and cued recall [3][13] [14]. In essence, the usual method triangu-lation seems to be a field testing without or with video analysis, and transcriptions of usability test sessions. The absence of an in depth usage data analysis seems be due to it is often not applicable to industrial purposes due to several constraints. Nonetheless for research purposes it is strongly recommended to provide sufficient detail to allow for replication.
3 The Multidimensional Evaluation Approach
The present approach was originally proposed for evaluating desktop application UI [15], and further adapted to evaluate the usability of mobile application UI [16]. It is based upon a hybrid strategy which encompasses the best features of: (i) standards in-spection; (ii) user performance measurement; and (iii) user inquiry. It is based on the premises that (i) each evaluation technique provides a different level of information, which will help the evaluator to identify usability problems from a specific point of view; and (ii) triangulation is used to compare the data collected from the various tech-niques with the aim to produce complementary and more robust results.
3.1 Product Standard Conformity Assessment, User Performance Measurement and User Subjective Satisfaction Measurement
According to [7] conformity assessment means checking whether products, services, materials, processes, systems, and personnel measure up to the requirements of stan-dards. For conformity assessment, the desktop version, of the multidimensional ap-proach adopts the standard ISO 9241 (Ergonomic Requirements for Office Work with Visual Display Terminals). In its mobile application UI evaluation version, and more specifically for the Internet tablet case study presented in this paper, it was found that only some parts of ISO 9241 could be applied: 14 [17], 16 [18], and 17 [18]. Some other standards were applied to this kind of device such as ISO/IEC 14754 [20], ISO/IEC 24755 [21].
In general, user performance measurement aims to enable real time monitoring of user activities, providing data on the effectiveness and efficiency of his/her interaction with a product. It also enables comparisons with similar products, or with previous ver-sions of the same product along its development lifecycle, highlighting areas where the product usability can be improved. When combined with the other methods, it can pro-vide a more comprehensive view of the usability of a system. The major change intro-duced in the original evaluation approach concerns the introduction of field tests as a complement to the original lab tests.
The measurement of user subjective satisfaction has beenwidely adopted as a meas-ure of IS success, and the subject of a number of researches since the 1980s (e.g., [22][23]). User satisfaction diagnosis provides an insight into the level of user satisfac-tion with the product, highlighting the relevance of the problems found and their impact on the product acceptance. In this approach, user subjective satisfaction data are gath-ered from three methods: (i) automated questionnaires administered before and after test sessions; (ii) informal think-aloud trials performed during test sessions; and (iii) un-structured interviews conducted at the end of test sessions.
In essence, ISO defines usability as an extent to which a product can be used by specified users, in a specified context of use, to achieve specified goals with effective-ness, efficiency and satisfaction [7]. It also defines that at least one indicator in each of these aspects should be measured to determine the level of usability achieved. As briefly exposed in this section, the multidimensional approach presented here meets the requirements set by ISO 9241-11 because it is used: (i) the task execution time as an ef-ficiency indicator; (ii) the number of incorrect actions, the number of incorrect choices, the number of repeated errors, and the number of accesses to the online/ printed help as effectiveness indicators; and (iii) the think-aloud comments, the unstructured interview responses, and the questionnaire scores as subjective satisfaction indicators.
4 Comparative Study of Lab versus Field Use of an Internet
Tablet
The main objective of this study was to investigate the need for adapting the original evaluation approach to the context of mobile UI applications, based on the analysis of the influence of the context - lab versus field, mobility versus stationary interaction. 4.1 Experiment Design
The experiment was designed to investigate the influence of the context (field and lab and related aspects, e.g., mobility, settings) and the user experience on the evaluation results. Consequently, independent and dependent variables were chosen, as well as objective and subjective usability indicators were defined.
The independent variables chosen were: (i) Task context, which comprised external factors (e.g., noise level and light intensity) and internal factors (e.g., stress or other health conditions) that could affect the user behavior and performance during the us-ability test; (ii)User mobility, which referred to conditions under which the task was being performed (e.g., moving between places or stand still wandering is working while being mobile); and (iii) User experience level, which referred to the user knowl-edge regarding mobile devices and desktop computers, in general. On the other hand, the dependent variables chosen were: (i) Task execution time (time taken by a device user to perform a task); (ii) Number of incorrect choices (number of times the user has made incorrect choices while selecting menu options in the interface); (iii)Number of incorrect actions (number of times the user has performed incorrect actions while se-lecting menu options in the interface, excluding menu incorrect choices); (iv) Number of repeated errors (number of times the same error was made by the user while per-forming a task, excluding the number of incorrect choices);(v)Number of accesses to the online/printed help (number of times the user accessed the online and/or printed help while performing a task); (vi) Perceived usefulness (user opinion about the use-fulness of the mobile application for the prescribed task); and (vii) Perceived ease of use (user subjective satisfaction when using the mobile device).
The chosen usability objective indicators were: (i) Task execution time; (ii) Number of incorrect actions; (iii) Number of incorrect choices; (iv) Number of repeated er-rors; and (v) Number of accesses to the online help and/or printed manuals. Addi-tionally, the chosen usability subjective indicators were: (i) Product easy of use; (ii)
Task completion easiness; (iii) Input mechanism easy of use; (iv) Text input modes easy of use; (v) Ease-of-understanding terms and labels; (vi) Ease-of-understanding messages; and (vii) Ease-of-use of help instructions.
4.2 Test Environment, Materials and Participants
In both realistic test environments, all the elements (e.g., tasks, informal think aloud, unstructured interviews) were identical, only the test environment was different. The lab test was conducted in a typical usability lab, while the field test was conducted in an environment in which users could walk, stand still, sit or do whatever they would normally do while performing their tasks. To minimize moderator bias, the tests were conducted with three experienced usability practitioners with 3 to 12 years of experi-ence in usability testing. The instructions given to participants were predefined. All moderators participated in data gathering and data analysis. Statistical analysis was performed by one moderator, and revised by another one.
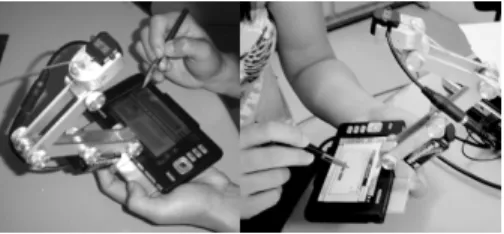
The chosen mobile device for this experiment was the Nokia 770 Internet Tablet and some of its native applications. Tests were performed in a controlled environment (a us-ability lab) and in the field as well. In the first one, the interaction was recorded by using three cameras installed in the room, one focused on the user facial expressions, a second one wider focused on the table where the user performed test tasks with the device fixed to the table or free in his/her hand. In the field experiment, a micro-camera connected to a transmitter was coupled to the device to remotely record and transmit user-device in-teraction data to the lab through a wireless connection (see Fig. 1).
Fig. 1. Apparatus to support the video micro-camera
Additionally, a remote screen capture software (VNC) was used to take test session screenshots, and a web tool named WebQuest [24] was used as well for supporting the user subjective satisfaction measurement. WebQuest supports the specialist during data collection, automatic score computation, performs statistical analysis, and gener-ates graphical results. Currently WebQuest supports two questionnaires: (i) a pre test questionnaire, the USer (User Sketcher), conceived to raise the profile of the system users; and (ii) a post test questionnaire, the USE (User Satisfaction Enquirer), con-ceived to raise the user degree of satisfaction with the system.
The participants were divided into two groups of 20 for the field and lab tests. Ac-cording to their experience levels, both groups were then subdivided into three sub-groups. A ratio of 8 beginners to 8 intermediates to 4 experts was adopted. For the lab
tests only, the 20 participants were subdivided again into two subgroups of 10 to per-form the task script with the device fixed on the table and free in their hands. A ratio of 4 beginners to 4 intermediates to 2 experts for each subgroup was adopted. 4.3 Experimental Procedure
Observation and retrospective audio/video analysis for quantitative and qualitative data were employed. Participants were required to provide written consent to be filmed prior to, during and immediately after the test sessions, and to permit the use of their images/sound for research purposes without limitation or additional compensa-tion. On the other hand, the evaluation team was committed to do not disclose the user performance or other personal information. According to the approach basis, the first step consisted in defining the evaluation scope for the product as well as in designing a test task scenario, in which the target problems addressed were related to the: (i) shape/dimensions of the device; (ii) mechanisms for information input/output; (iii) processing power; (iv) navigation between functions; and (v) information legibility.
Since the test objectives focused on (i) investigating the target problems; and (ii) de-tecting other problems which affect usability, a basic but representative set of test tasks was selected and implemented. The test tasks consisted of (i) initializing the device; (ii) searching for books in an online store; (iii) visualizing a PDF file; (iv) entering textual information; (v) using the e-mail; e (vi) using the audio player. After planning, 2 pilot tests (lab and field) were conducted to verify the adequacy of the experimental proce-dure, materials, and environment. Aiming to prevent user tiredness, the session time was limited to 60 minutes, and the test scenario was re-dimensioned to 6 tasks. Thus, each test session consisted of (i) introducing the user to the test environment by explaining the test purpose and procedure; (ii) applying the pre-test questionnaire (USer); (iii) per-forming the six-task script; (iv) applying the post-test questionnaire (USE); and (v) per-forming a non-structured interview. For the participants who declared not having had any previous contact with the Internet tablet, an introductory explanation about the de-vice I/O modes and its main resources was given, considering that, at the time of the ex-periment, it was not yet widely spread in Brazil.
5 Results
Conformity assessment results can be summarized by computing an Adherence Rat-ing (AR), which is the percentage of the Applicable recommendations (Ar) that were Successfully adhered to (Sar) [17]. The results of the conformity assessment are sum-marized in Table 1. As it can be observed, all the ARs, excluding that one related to ISO 14745, are higher than 75%, which means successful results. As for ISO 14745, the result indicates the need to improve the input text via write recognition. Those results corroborate with the idea that the efficacy of standards inspection can be con-siderably improved if it is based upon standards conceived specifically for mobile de-vices, which could evidence more usability problems.
Table 1. Nokia 770 conformity assessment with standards
STANDARD #Sar #Ar AR (%)
ISO 9241 Part 14 45,0 53,0 84,9
ISO 9241 Part 16 26,0 33,0 78,8
ISO 9241 Part 17 47,0 52,0 90,4
ISO 14754 4,0 11,0 36,4
ISO 24755 6,0 7,0 85,7
As for the user subjective satisfaction measurement, both questions and answers of the post test questionnaire (USE) were previously configured. The questionnaire was applied soon after the usability test and answered using the mobile device itself, with the purpose to collect information on the user degree of satisfaction with the device by means of 38 questions about menu items, navigation cues, understandability of the messages, ease of use functions, I/O mechanisms, online help and printed manuals, users’ impression, and product acceptance level.. With the support of the pre test questionnaire (USer), the user sample profile was drawn. It was composed of 16 male and 24 female users, of which 16 were undergraduate students, 17 post-graduate stu-dents, 5 had graduate level and 2 had post-graduate level. The age varied between 18 and 29 years. They were mainly right handed and used some sort of reading aid (glasses or lenses). All of them had at least 1 year of previous experience with com-puter systems, were currently using computers on a daily basis, and had previous ex-perience with mobile devices.
The ranges for USE normalized user satisfaction are 0.67 to 1.00 (Extremely Satisfied), 0.33 to 0.66 (Very satisfied), 0.01 to 0.32 (Fairly satisfied), 0.00 (Neither satisfied nor unsatisfied), 0.01 to -0.32 (Fairly dissatisfied), -0.33 to -0.66 (Very dis-satisfied), and -0.67 to -1.00 (Extremely dissatisfied). The normalized user satisfaction achieved was 0.330 (Very satisfied) for the lab experiment, and 0.237 (Fairly satis-fied) for the field experiment .
During the test sessions were identified 23 usability problems. 21 problems (91.3%) were detected in the lab experiment, while 14 ones (60.8%) were found in the field experiment . On the other hand, 12 problems (60.0%) were found with the de-vice fixed on the table, while 15 (75.0%) were identified with the dede-vice free, in the user’s hands.
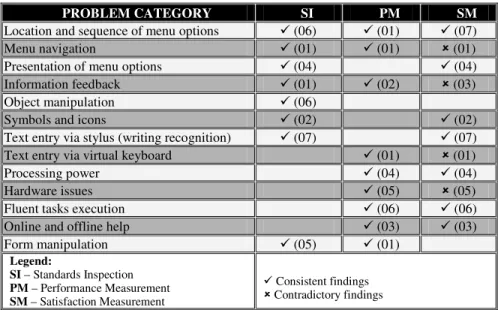
Since the multidimensional approach is based upon the triangulation of results, Table 2 summarizes the usability problem categories which were identified during the evaluation process. For each category, the number of problems identified by each technique is given. As can be seen, some of the usability problem categories were more associated to the performance measurement (e.g. hardware aspects, help mecha-nisms) whereas others (e.g. menu navigation, presentation of menu options) were identified by the conformity assessment. The combination of the results from the post-test questionnaire to the comments made during the test sessions and the non-structured interviews at the end of each experiment session showed that the user opin-ion was in agreement (e.g., locatopin-ion and sequence of menu optopin-ions) or disagreement (e.g., menu navigation) with the results obtained from the other two evaluation tech-niques. This discrepancy can originate from the users’ perception of product quality, and from the perception of their own skills to perform the task.
Table 2. Overlay of results obtained from different techniques described above
PROBLEM CATEGORY SI PM SM Location and sequence of menu options 9 (06) 9 (01) 9 (07)
Menu navigation 9 (01) 9 (01) 8 (01)
Presentation of menu options 9 (04) 9 (04)
Information feedback 9 (01) 9 (02) 8 (03)
Object manipulation 9 (06)
Symbols and icons 9 (02) 9 (02)
Text entry via stylus (writing recognition) 9 (07) 9 (07)
Text entry via virtual keyboard 9 (01) 8 (01)
Processing power 9 (04) 9 (04)
Hardware issues 9 (05) 8 (05)
Fluent tasks execution 9 (06) 9 (06)
Online and offline help 9 (03) 9 (03)
Form manipulation 9 (05) 9 (01) Legend: SI – Standards Inspection PM – Performance Measurement SM – Satisfaction Measurement 9 Consistent findings 8 Contradictory findings
The statistic analysis consisted of: (1) building a report with univariate statistics; (2) generating the covariance matrices for the predefined objective and subjective indicators; (3) applying the one-way F ANOVA test to the data obtained from the pre-vious step in order to investigate possible differences; and (4) applying the Tukey-Kramer process to the one-way F ANOVA results aiming to investigate if the found differences were statistically significant to support inferences from the selected sam-ple.According to the results (see Table 3), the series of two-factor ANOVA involving Time, Errors (Incorrect actions, Incorrect choices, and Repeated errors), and Help accesses showed that the user experience level had a more significant effect on the number incorrect choices in the field experiment than in lab one. Pre and post-test questionnaire analysis and informal interviews results reinforced that domain knowl-edge and computer literacy have significant influence on user performance concern-ing the incidence of errors, both in lab and in the field.
Table 3.Lab x Field and Fixed x Free experiment results p-Value (α=0.05) Variable Pair
Lab Field Fixed Free
Experience x Task Time 0.019 0.056 0.025 0.026
Experience x Incorrect Actions 0.003 0.003 0.001 0.043
Experience x Incorrect Choices 0.049 0.0006 0.164 0.270
Experience x Repeated Errors 0.017 0.127 0.194 0.133
6 Final Considerations
Studies in the literature fit basically in two categories: (i) user mobility while using the device, inside of a lab or outdoors; and (ii) user distraction in pervasive comput-ing. This study considered both aspects as part of the task context. In field test sub-jects were free to choose between moving or remaining still as they performed the task with the mobile device. The movement registered was limited to situations while the user waited for some device processing (e.g. web page downloads). During the field tests, while the user was moving, there was a clear interference of the environ-ment on the user attention. Outdoors, in the ambient light, the device’s legibility was reduced/ aggravated by glare and reflections on the screen. Although the user’s opin-ion was that the camera apparatus did not interfere with the task executopin-ion the vast majority decided to lay the device down during task execution.
Confirming previous findings, the experiments demonstrated that applications that require a lot of interaction and user attention are inappropriate for performing while walking due to attention distraction. This reinforces that, in spite of the mobility of the device targeted in this study, the evaluation settings did not need to differ substan-tially from the one employed in the evaluation of stationary devices, since the users tend not to wander while performing tasks that demand their attention.
Until recently, studies have been published which deal with new paradigms and evaluation techniques for mobile devices. Few of the proposed new techniques are really innovative if compared to the ones traditionally employed. The data gathered and analyzed support the initial assumption that minor adaptations in the traditional evaluation techniques and respective settings are adequate to accommodate the evaluation of the category of mobile devices targeted by this study.
The above comments corroborate with the views of the authors and [15] that of the laboratory and field evaluations do not diverge but are complimentary. As shown in this study they both add to the evaluation process, producing data that is significant to the process reinforcing the relevance of a multidimensional approach for the mobile device usability evaluation.
References
1. Rosson, M.B., Carroll, J.M.: Usability Engineering: Scenario-Based Development of Hu-man-Computer Interaction. Academic Press, San Diego, CA (2002)
2. Hartson, H.R., Andre, T.S., Williges, R.C.: Criteria for evaluating usability evaluation methods. IJHCI 15(1), 145–181 (2003)
3. Nielsen, J.: Usability engineering. Academic Press, Boston (1993)
4. Wixon, D., Wilson, C.: The usability engineering framework for product design and evaluation. In: Helander, M., Landauer, T.K., Prabhu, P. (eds.) Handbook of human-computer interaction, 2nd edn., pp. 653–688. John Wiley and Sons, Chichester (1997) 5. Jones, M., Marsden, G.: Mobile Interaction Design. John Wiley and Sons, Inc., Chichester,
West Sussex (2006)
6. Danielson, D.R.: Usability data quality. In: Ghaoui, C. (ed.) Encyclopedia of human-computer interaction, pp. 661–667. Idea Group Reference (2006)
7. ISO 9241-11: Ergonomic requirements for office work with visual display terminals (VDTs) - Part 11: Guidance on usability. International Organization for Standardization, Geneva, Switzerland (1998)
8. Dumas, J.S., Loring, B.A.: Moderating Usability Tests: Principles and Practices for Inter-acting, illustrated edn. Morgan Kaufmann, San Francisco (2008)
9. Kjeldskov, J., Stage, J.: New techniques for usability evaluation of mobile systems. IJHCI 60(5-6), 599–620 (2004)
10. Ballard, B.: Designing the Mobile User Experience. John Wiley and Sons, Chichester (2007)
11. Goren-Bar, D., Graziola, I., Pianesi, F., Zancanaro, M., Rocchi, C.: Innovative Approaches for Evaluating Adaptive Mobile Museum Guides. In: Stock, O., Zancanaro, M. (eds.) PEACH - Intelligent Interfaces for Museum Visits, pp. 245–265. Springer, Heidelberg (2007)
12. Po, S., Howard, S., Vetere, F., Skov, M.B.: Heuristic evaluation and mobile usability: Bridging the realism gap. In: Proceedings of Mobile HCI, pp. 49–60 (2003)
13. Sanderson, P., Fisher, C.: Usability testing of mobile applications: A comparison between lab and field testing. Human-Computer Interaction 9, 251–317 (1994)
14. Omodei, M.A., Wearing, J., McLennan, J.P.: Head-mounted video and cued recall: A minimally reactive methodology for understanding, detecting and preventing error in the control of complex systems. In: Proceedings of 21th European Annual Conference of Hu-man Decision Making and Control (2002)
15. de Queiroz, J.E.R.: Abordagem Híbrida para avaliação da usabilidade de interfaces com o usuário. Tese de Doutorado, UFPB, Brazil, p. 410 (2001) (in Portuguese)
16. Turnell, M.F.Q.V., de Queiroz, J.E.R., Ferreira, D.S.: Multilayered Approach to Evaluate Mobile User Interfaces. In: Lumsden, J. (ed.) Handbook of Research on User Interface De-sign and Evaluation for Mobile Technology, vol. 1, pp. 847–862. IGI Global (2008) 17. ISO 9241-14: Ergonomic requirements for office work with visual display terminals
(VDTs) - Part 14: Menu dialogues. ISO, Geneva, Switzerland (1997)
18. IS09241-16: Ergonomic requirements for office work with visual display terminals (VDTs) - Part 16: Direct manipulation dialogues. ISO, Geneva, Switzerland (1999) 19. IS09241-17: Ergonomic requirements for office work with visual display terminals
(VDTs) - Part 17: Form filling dialogues. ISO, Geneva, Switzerland (1998)
20. ISO/IEC 14754: Information technology - Pen-based interfaces - Common gestures for text editing with pen-based systems. ISO, Geneva, Switzerland (1999)
21. ISO/IEC 24755: Information technology - Screen icons and symbols for personal mobile communication devices. ISO, Geneva, Switzerland (2007)
22. Bailey, J.E., Pearson, S.W.: Development of a Tool for Measuring and Analyzing Com-puter User Satisfaction. Management Science 29(5), 530–545 (1983)
23. Aladwani, A.M., Palvia, P.C.: Developing and validating an instrument for measuring user-perceived Web quality. Information & Management 39, 467–476 (2002)
24. De Oliveira, R.C.L., de Queiroz, J.E.R., Vieira Turnell, M.F.Q.: WebQuest: A Configur-able Web Tool to Prospect the User Profile and User Subjective Satisfaction. In: Salven-dry, G. (ed.) Proceedings of the 2005 Human-Computer Interaction Conference, vol. 2, Lawrence Erlbaum Associates, Nevada (2005) (U.S. CD-ROM Multi Platform)