Centre for
Aboriginal Economic
Policy Research
ANU College of
Arts & Social
I S L A N D E R A U S T R A L I A N S : A N A L Y S I S
U S I N G T H E 2 0 1 4 – 1 5 N A T I O N A L
A B O R I G I N A L A N D T O R R E S S T R A I T
I S L A N D E R S O C I A L S U R V E Y
The Centre for Aboriginal Economic Policy Research (CAEPR) undertakes high-quality, independent research to further the social and economic development and empowerment of Indigenous people throughout Australia. For more than 25 years, CAEPR has aimed to combine academic and teaching excellence on Indigenous economic and social development and public policy with realism, objectivity and relevance.
CAEPR maintains a substantial publications program, including Research Monographs, Discussion Papers, Working Papers and Topical Issues. All CAEPR Working Papers are refereed and are produced for rapid distribution to enable widespread discussion and comment.
All CAEPR publications are available in electronic format for free download from CAEPR’s website:
caepr.anu.edu.au
CAEPR is located within the Research School of Social Sciences in the College of Arts & Social Sciences at the Australian National University (ANU). The Centre is funded from a range of sources, including ANU, the Australian Research Council, industry and philanthropic partners, and Australian state and territory governments.
As with all CAEPR publications, the views expressed in this Working Paper are those of the author(s) and do not reflect any official CAEPR position.
Dr RG (Jerry) Schwab Director, CAEPR Research School of Social Sciences College of Arts & Social Sciences The Australian National University July 2017
Community functioning for
Aboriginal and Torres Strait
Islander Australians: analysis
using the 2014–15 National
Aboriginal and Torres Strait
Islander Social Survey
N Biddle
Nicholas Biddle is an Associate Professor at the Centre for Aboriginal Economic Policy Research, Research School of Social Sciences, College of Arts & Social Sciences, Australian National University.
Working Paper No. 115/2017 ISSN 1442-3871
ISBN 978-1-925286-14-4
An electronic publication downloaded from <caepr.anu.edu.au>.
For a complete list of CAEPR Working Papers, see
<caepr.anu.edu.au/publications/ working.php>.
Centre for Aboriginal Economic Policy Research
Research School of Social Sciences College of Arts & Social Sciences The Australian National University Front cover image:
Terry Ngamandarra Wilson, Gulach (detail), painting on bark, private collection © Terry Ngamandarra, licensed by Viscopy, 2016
Abstract
One of the major changes in Indigenous policy over the past decade and a half is the systematic reporting by government of socioeconomic and other outcomes of the Aboriginal and Torres Strait Islander population. Much, although not all, of this reporting makes comparisons with the non-Indigenous population. An increasing body of literature, however, cautions against using a ‘deficits approach’ to Indigenous statistics and data. One concept that focuses explicitly on strengths and resilience that has been adapted to the Aboriginal and Torres Strait Islander context is that of ‘community functioning’. In the most recent Aboriginal and Torres Strait Islander Health Performance Framework, this was defined as the ability and freedom of community members and communities to determine the context of their lives (e.g. social, cultural, spiritual, organisational) and to translate their capability (knowledge, skills, understanding) into action (to make things happen and achieve a life they value). Building on this definition and previous analysis, this paper has four main aims: to identify a subset of community functioning measures and develop an index or set of indices; to analyse the distribution of community functioning by remoteness, sex and age; to analyse the factors associated with community functioning; and to analyse the relationship between community functioning and individual-level outcomes, recognising that community functioning is likely to be a predictor of important outcomes, as well as a key set of outcomes itself. One of the main findings from the analysis is that those with high levels of all three measures of community functioning (connectedness, resilience and safety) were more likely to be satisfied with their life, more likely to report that they were a happy person all or most of the time, and less likely to report that they felt so sad that nothing could cheer them up. Keywords: community functioning, capabilities, wellbeing, survey data
Acronyms
AHMAC Australian Health Ministers’ Health Advisory Council ANU The Australian National University
CAEPR Centre for Aboriginal Economic Policy Research
HPF Aboriginal and Torres Strait Islander Health Performance Framework
NATSISS National Aboriginal and Torres Strait Islander Social Survey
Acknowledgments
Funding for this paper was provided by the Australian Government Department of the Prime Minister and Cabinet as part of the Indigenous Populations Project. An analysis plan was provided to the department, and comments were received from Debra Reid and Kirrily Harrison, which were greatly appreciated. The paper was then circulated for comment by the Department of the Prime Minister and Cabinet, with feedback included in the final version of the paper. Comments were also received from
researchers in the Centre for Aboriginal Economic Policy Research (CAEPR), with special thanks to Dr Deirdre Howard-Wagner, Dr Kirrily Jordan and Heather Crawford. While the comments and input are greatly appreciated, all conclusions and/or errors should be attributed to the author rather than individuals within CAEPR or the Department of the Prime Minister and Cabinet, or the department as a whole.
Contents
Series Note
ii
Abstract iii
Acknowledgments iv
Acronyms iv
Background, definitions and scope of paper
1
Methods, aims and data
3
Results 4
Descriptive findings
4
Factors associated with indices
6
Relationship between community functioning and measures of wellbeing
8
Concluding comments and limitations
11
Appendix 13
Notes 15
References 16
Tables and figures
Table 1.
Themes and functionings for Yawuru men and women
3
Table 2.
Average values for community functioning variables
5
Fig. 1.
Number of community functioning variables by age and sex
5
Fig. 2.
Variation in community functioning indices by sex and remoteness
6
Table 3.
Factors associated with a single community functioning measure
7
Table 4.
Factors associated with individual community functioning themes
9
Fig. 3.
Relationship between community functioning and measures of wellbeing 10
Table 5.
Relationship between individual community functioning themes and
measures of wellbeing
10
Table A1.
Coefficient estimates and
P
-values for relationship between
Background, definitions
and scope of paper
O
ne of the major changes in Indigenous policy over the past decade and a half is the systematic reporting by government of socioeconomic and other outcomes of the Aboriginal and Torres Strait Islander population. This began in earnest in 2003 with the publication of the first edition of the Overcoming Indigenous Disadvantage report by the Steering Committee for the Review of Government Service Provision and the Productivity Commission, but intensified with the now annual Closing the Gap reports presented by the prime minister of the day to the Australian Parliament, beginning in 2010.These reports, and many others, usually take the outcomes of the non-Indigenous population as a benchmark, and compare the gap between the two populations and whether it is changing through time. This is arguably a necessary component to government accountability, despite the gaps that are measured being stubbornly resistant to change.
However, an increasing body of literature argues against such a ‘deficits approach’ to Indigenous statistics and data (Pholi et al. 2009, Kukutai & Walter 2015) as opposed to building on and learning from the strengths and resilience within Indigenous communities (Brough et al. 2004, Tsey et al. 2007, Armstrong et al. 2012). One concept that focuses explicitly on strengths and resilience that has been adapted to the Aboriginal and Torres Strait Islander context is the ‘community functioning’ measure developed for the Aboriginal and Torres Strait Islander Health Performance Framework (HPF), as reported by the Australian Health Ministers’ Advisory Council (AHMAC).
The community functioning performance measure builds on the work of international frameworks of functioning (Sen 2001) and capabilities (Nussbaum 2000), and was tailored to fit the Aboriginal and Torres Strait Islander context in Australia. Capability is generally defined as the ability to perform actions. As it applies to human capital, capability is the sum of expertise and capacity. Functioning is about the things people actually achieve or do or experience, consistent with their account of wellbeing.
Workshops with Aboriginal and Torres Strait Islanders from across Australia were held in 2008 and 2010, where participants ‘described the various elements of family and community life essential for high levels of
functioning’.1 Participants were drawn from a number of jurisdictions and settings, so the themes they identified, while not guaranteed to be completely representative, appear to reflect widely held views among Aboriginal and Torres Strait Islander peoples. Six themes were identified: • connectedness to country, land and history; culture
and identity • resilience • leadership
• having a role, structure and routine • feeling safe
• vitality.
More broadly, community functioning in the HPF is defined as the ability and freedom of community members and communities to determine the context of their lives (e.g. social, cultural, spiritual, organisational) and to translate their capability (knowledge, skills, understanding) into action (to make things happen and achieve a life they value).2 According to AHMAC (2014), the conversion of capabilities into functioning is influenced by the values and personal features of individuals, families and communities, and by the environment in which they live. Hence, it is likely that different cultures will give greater or lesser priority to different functioning. This performance measure was developed through listening to, and reflecting on, Aboriginal and Torres Strait Islander perspectives on the capabilities and functionings that they value.
Within these themes, a number of indicators from the 2008 National Aboriginal and Torres Strait Islander Social Survey (NATSISS) were identified. The percentage of Aboriginal and Torres Strait Islanders who were identified as having those indicators was then reported in the 2010 HPF report, and then again in the 2012 and 2014 reports (AHMAC 2014). Where possible, comparisons were made with data from the 2002 survey.
The community functioning analysis and concepts draw very heavily on aspects of the work of economist and philosopher Amartya Sen. Sen (2001) argues that policy should focus on capabilities or what ‘people are able to do or able to be – the opportunity they have to achieve various lifestyles and as a result, the ability to live a good life’. This, however, is in direct comparison (in his terminology) with functionings or the things that a person actually does or experiences. Sen (2004) argues that there are two kinds of human functioning: elementary ones such as being in good health, nourished and sheltered; and the more complex social ones, such as having self-respect and taking part in the life of the
community. He argues that the conversion of capabilities into functioning is influenced by individual, family and community factors and values; and the environment in which they live.
A number of authors have argued that capabilities rather than functionings (or other outcome measures) should be the focus of government policy. Recognising a person’s own agency, an individual should be able to make their own choice about the specific functionings or life that they would like to live, with some decisions made jointly at a family or community level. The government’s role should be either to maximise the range of choices or capabilities available to each individual, or at the very least to ensure that individuals have at least a minimum level of capabilities.
One of the limitations of the capabilities approach is that it is difficult to separately identify a person’s capabilities from their functionings. It is possible to observe the choices that individuals have made, but not the choice set that they chose from. This is especially the case when evaluating policy based on a capabilities approach. However, Nussbaum (2000) argues for 10 capabilities that are somewhat amenable to empirical analysis. Although Nussbaum’s list is designed to be universal, some are likely to be of higher priority than others, depending on the context.
Leading proponents of the capabilities approach in Indigenous affairs are Noel Pearson and the Cape York Institute (CYI). In articulating their approach, they state that their main goal can ‘be expressed as ensuring that Cape York people have the capabilities to choose a life they value. It is not about making choices for people, but is rather about expanding the range of choices people have available to them’ (Pearson 2005).
The capability measures in Nussbaum (2000) and Pearson (2005) have substantial overlap. Where the former lists ‘having the right to seek employment on an equal basis with others’ as an aspect of the control over one’s environment, the latter lists ‘the number and type of employment opportunities for members of the community’ as the first – and one might assume most important – capability. Furthermore, whereas the CYI lists ‘the ability to access a quality education’ as a key capability, Nussbaum (2000) outlines the goal of being ‘informed and cultivated by an adequate education, including, but by no means limited to, literacy and basic mathematical and scientific training’.
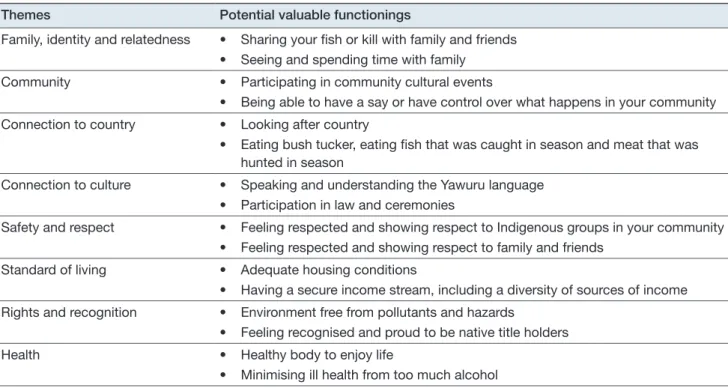
Some of the capabilities listed by the CYI could perhaps be better thought of as functionings. For example, although a person’s income does affect their consumption possibilities, income is in many contexts an outcome of the choices made rather than a measure of the economic resources that are potentially available to an individual. For example, a person who opts out of the labour market to have or raise children (or to engage in other nonmarket activities) has the same capabilities as one who continues to work, despite having a lower level of income. The same could be said of net worth of a household or individual, which will be influenced by the choices that individuals have made over their lifecourse. Finally, the use of income passivity as a measure of negative capabilities is potentially problematic. There are many individuals – for example, those with a disability or those who are unable to obtain employment despite their best efforts – for whom unearned income is the only way that they can meet their other capabilities of adequate housing, quality health services and consumption. In more recent analysis, Yap and Yu (2016) attempted to ‘operationalise the capability approach’ by incorporating Indigenous worldviews. The authors used a participatory approach and argued that ‘utilisation of the capability approach here provides an opportunity not only to understand conceptualisations of wellbeing but also to sketch the pathways towards achieving wellbeing’. Based on a small sample of respondents from Broome, Western Australia, the authors identified 8 themes and 16 functionings, reproduced in Table 1.
Building on the existing literature at the time, Biddle (2011) used the 2008 NATSISS to analyse the relationship between demographic characteristics, subjective wellbeing and nine measures of individual-level capability restrictions. These were whether the individual:
• has difficulty communicating with English speakers • is unable to attend cultural events as often as they
want to
• has problems accessing services
• felt discriminated against in the past 12 months • has profound or severe core-activity limitation • is unemployed
• is employed but would like to work more hours • is unable to raise $2000 in an emergency • does not have access to motor vehicles.
These variables were used to create an index value of capability restrictions, with the analysis showing that ‘while there are no consistent differences between males and females, for both sexes those in remote areas have substantially higher index values than those in nonremote areas’. Furthermore, the analysis showed that ‘Capability restrictions are also higher amongst the young and, in particular, those aged 15–19 years’, whereas there was an increase (especially for males in remote Australia) ‘between the 50–54 year age group and those aged 55 years and over’. Most importantly, it was shown that ‘Those Indigenous Australians with a relatively high index value for the capability restrictions were less likely to report frequent periods of happiness and more likely to report intense feelings of sadness’.
With the release of data from the 2014–15 NATSISS (as described below), the analysis of community functioning reported in the HPF will be combined with the type of analysis of capability restrictions described above. At the moment, there is very little information available about how aspects of community functioning vary at the individual level, or whether measures of community functioning predict key outcomes. The aim of this paper is to fill that gap.
The remainder of the paper is structured into a section that outlines the methods, aims and data used in the
analysis, followed by a results section in three parts – a descriptive analysis of the community functioning measures, an analysis of the factors associated with community functioning, and a final section that looks at the relationship between community functioning and a set of individual measures of wellbeing. The last section of the paper provides some concluding comments and a discussion of limitations of the analyses.
Methods, aims and data
According to the Australian Bureau of Statistics website:3
The National Aboriginal and Torres Strait Islander Social Survey (NATSISS) was conducted from September 2014 to June 2015 with a sample of 11,178 Aboriginal and Torres Strait Islander people living in private dwellings across Australia. The NATSISS is a six-yearly multidimensional social survey which provides broad, self-reported information across key areas of social interest for Aboriginal and Torres Strait Islander people, primarily at the national level and by remoteness.
The survey includes information on both children (aged 0–14 years) and adults, with the latter being the focus of the analysis.
TABLE 1.
Themes and functionings for Yawuru men and women
Themes Potential valuable functionings
Family, identity and relatedness • Sharing your fish or kill with family and friends • Seeing and spending time with family
Community • Participating in community cultural events
• Being able to have a say or have control over what happens in your community Connection to country • Looking after country
• Eating bush tucker, eating fish that was caught in season and meat that was hunted in season
Connection to culture • Speaking and understanding the Yawuru language • Participation in law and ceremonies
Safety and respect • Feeling respected and showing respect to Indigenous groups in your community • Feeling respected and showing respect to family and friends
Standard of living • Adequate housing conditions
• Having a secure income stream, including a diversity of sources of income Rights and recognition • Environment free from pollutants and hazards
• Feeling recognised and proud to be native title holders
Health • Healthy body to enjoy life
• Minimising ill health from too much alcohol
The analysis involves a four-step process:
1. Identify a subset of community functioning measures and develop an index or set of indices. It is not possible to include all measures of community functioning used in the 2014 HPF because (a) there have been changes to the NATSISS from the 2008 version, (b) many of the measures used are for children, which, while perfectly suitable for aggregate analysis, are not suitable for individual level analysis, and (c) many of the measures, particularly in the vitality dimension, are better treated in this analysis as outcomes from, or determinants of, community functioning. However, there are also new measures in the 2014 NATSISS that are considered for inclusion as measures. These individual measures are combined into a single index, as well as an index for each of the themes outlined above. 2. Analyse the distribution of community functioning
by remoteness, sex and age. Using descriptive and graphical analysis, the indices created in step 1 are presented by the main demographic variables in the NATSISS.
3. Use multivariate statistics to analyse the association between community functioning and a range of demographic/socioeconomic characteristics. In addition to sex, remoteness and age, factors include marital status, family status, mobility, education levels, education participation and employment.
4. Analyse the relationship between community functioning and individual-level outcomes, while holding the demographic/socioeconomic characteristics outlined above constant. Although community functioning might be considered an outcome itself, it is also important to consider whether it predicts other key health outcomes. Outcomes considered are
• self-assessed health
• emotional wellbeing (happiness and sadness) • life satisfaction
• long-term health conditions
• health behaviour (smoking, alcohol, obesity) • barriers to accessing health services.
Results
Descriptive findings
The first step in the analysis is to identify the individual community functioning measures that will make up the index. Through discussion with the Department of the Prime Minister and Cabinet and analysis of the distribution of potential individual-level variables, 20 variables were identified as constituting community functioning, which could usefully be grouped into three themes – connectedness, resilience and safety. The names and average values (within the sample) for these variables are summarised in Table 2.
After identifying the individual-level variables, the next step in the analysis was to identify a summary index of community functioning. The initial approach was to undertake a principal component analysis (PCA) of the individual-level variables, with the aim of using the correlation across the variables to create an index. Unfortunately, the PCA did not result in a single-component solution. Rather, there was very little difference between the eigenvalue for the first component and the second component (2.65 compared with 1.89), and seven components had an eigenvalue of greater than 1 (meaning they summarised more variance than a single variable).
For this reason, the index was created as an aggregate index with equal weighting for each variable. This index, in theory, ranges from a value of 0 (none of the community functioning variables) to 20 (all of them). In practice, the 7009 valid observations from the NATSISS had an average value of 12.6 community functioning variables, with a maximum value of 19, a minimum value of 3 and a standard deviation of 2.6.
Ultimately, the selection of the individual variables is a subjective one, and conclusions drawn from the analysis are conditional on the variables chosen. Furthermore, the choice of variables is constrained by availability in the NATSISS. There are many variables that could have been placed in alternative themes, but, ultimately, the framework developed for the HPF was used as the guiding principle. The average values for this aggregate variable across the age distribution and by sex are shown in Fig. 1.
TABLE 2 .
Average values for community functioning variables
Theme Variable
Average value
Connectedness • Recognises homelands 0.770
• Speaks, understands or is learning an Indigenous language 0.319 • Attended Aboriginal and Torres Strait Islander cultural event in past 12 months 0.651
• Identifies with clan group or language group 0.656
• Feels able to have a say with family and friends most or all of the time 0.726 • Feels able to have a say within community on important issues most or all of the time 0.282 • Contact with family or friends outside household at least once per week 0.949
• Has friends can confide in 0.795
• Provides support to relatives outside household 0.600
Resilience • Did not feel treated unfairly because Aboriginal/Torres Strait Islander in past
12 months 0.678
• Can visit homelands 0.488
• Involvement with Aboriginal/Torres Strait Islander organisation 0.211
• No community problems reported 0.259
• Agrees that most people can be trusted 0.342
• Felt able to find general support from outside household 0.909
Safety • Felt safe at home alone after dark 0.838
• Felt safe walking alone in local area after dark 0.511
• Not a victim of physical or threatened violence in past 12 months 0.769
• Not incarcerated in past 5 years 0.966
• Not arrested in past 5 years 0.852
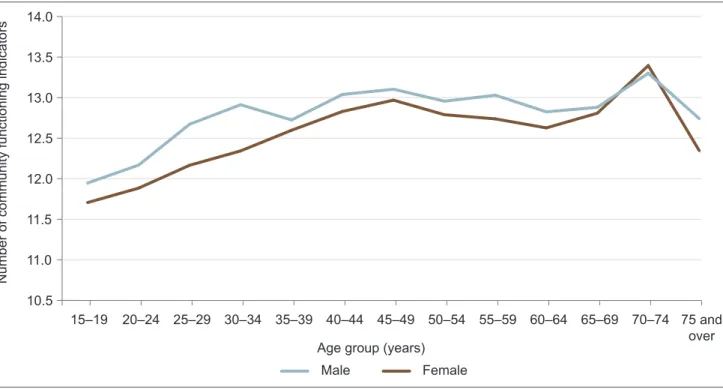
FIG . 1.
Number of community functioning variables by age and sex
10.5 11.0 11.5 12.0 12.5 13.0 13.5 14.0 75 and over 70–74 65–69 60–64 55–59 50–54 45–49 40–44 35–39 30–34 25–29 20–24 15–19 Female Male
Number of community functioning indicators
Age group (years)
The results show a general increase in the community functioning measures across the age distribution (Fig. 1). Values for Indigenous males and females aged 15–19 years were low at 11.9 and 11.7, respectively, increasing to values of 13.3 and 13.4 for Indigenous males and females, respectively, aged 70–74 years. Apart from this last age group, males tend to have an average number of measures that is higher than for females. As mentioned, the community functioning variables as originally conceived were structured into six themes. For the analysis presented in this paper, it was possible to reconstruct three separate themes – connectedness, resilience and safety – with nine, six and five component variables, respectively (Table 2). To make the indices comparable, the individual themes as well as the overall index were standardised to have a mean of 0 and a standard deviation of 1. Fig. 2 summarises the values for these themes by sex and remoteness.
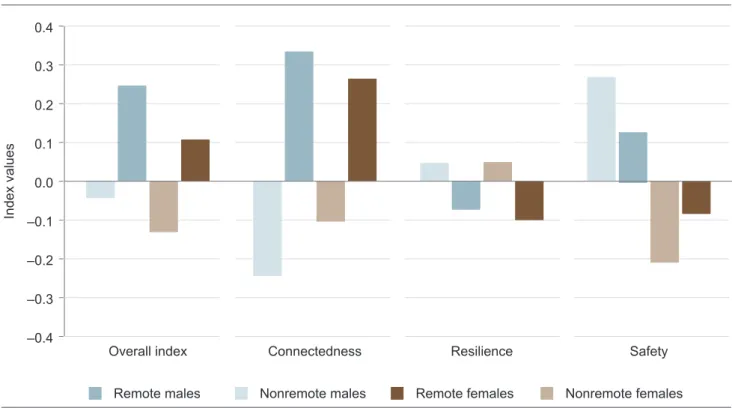
The results presented in Fig. 2 show that, for the overall index, community functioning was higher for people in remote Australia, with the difference slightly larger for males than for females. Given that the connectedness variables are numerically more important in the overall index, it is not surprising that the patterns for that theme are more closely aligned with the overall index. However, it is important to note that the differences by remoteness are even larger.
Differences by remoteness with the resilience theme were much smaller, with the differences going in the opposite direction. Specifically, males and females in nonremote Australia had the highest values, with those in remote Australia, and particularly females, having lower values. Males in nonremote Australia had the highest values for the safety variables. Females in nonremote Australia had the lowest values. For this variable, the interaction between remoteness and sex seems to be quite complex.
Factors associated with indices
Age and sex are not the only factors that are likely to be associated with community functioning – there are a number of determinants at both the individual and household level. These factors are given in Table 3, associated with a scaled index of community functioning (with a mean of 0 and standard deviation of 1). Results are presented as the difference in the index value from a change in that explanatory variable relative to the base case, while holding all other variables constant. The characteristics of the base case (or omitted categories) are given beneath the table.
Results presented in Table 3 confirm those from Fig. 1 (that females and the relatively young have lower levels of community functioning based on these measures). However, a number of other important measures were
FIG . 2 .
Variation in community functioning indices by sex and remoteness
–0.4 –0.3 –0.2 –0.1 0.0 0.1 0.2 0.3 0.4
Remote females Nonremote females Remote males Nonremote males
Safety Resilience
Connectedness Overall index
TABLE 3 .
Factors associated with a single community functioning measure
Factor Coefficient Female –0.077*** Aged 15–24 years –0.179*** Aged 25–34 years –0.105*** Aged 45–54 years 0.130*** Aged 55–64 years 0.175***Aged 65 years and over 0.433***
Lives in remote area 0.261***
Not married –0.037
Changed usual residence in previous 5 years –0.058**
Lives in a couple family with no children and no dependants –0.106**
Lives in a couple family with dependants but no children –0.039
Lives in a single-parent family with children –0.101
Lives in a single-parent family with dependants but no children –0.320***
Lives in an ‘other’ family –0.220***
Has non-Indigenous people living in the household –0.202***
Not employed –0.295***
Completed Year 10 or 11 –0.186***
Completed Year 9 or less –0.293***
Has a degree 0.375***
Has an ‘other’ qualification 0.148***
Equivalised household income in bottom decile –0.130***
Equivalised household income in 2nd or 3rd decile –0.147***
Equivalised household income in 7th, 8th, 9th or 10th decile 0.117***
Lives in a private rental dwelling –0.077**
Lives in a dwelling rented from state housing –0.028
Lives in a dwelling rented from community organisation 0.176***
Lives in an ‘other’ tenure type –0.006
Household identified as needing additional bedrooms 0.061
Predicted index value for base case 0.480
Adjusted R-squared 0.1435
** = coefficient statistically significant at the 5% level of significance; *** = coefficient statistically significant at the 1% level of significance
Notes:
1. The base case individual for all estimates is an employed male aged 35–54 living in nonremote Australia who is married, lives in a couple family without children with Indigenous Australians only in the household, speaks English at home, did not change usual residence in the previous 5 years, has completed Year 12, does not have a qualification and lives in an owner-occupied house that meets the occupancy standard used by the Australian Bureau of Statistics.
found to be associated with the community functioning measure. Those who lived in remote areas had
significantly and substantially higher index values. Those who had changed usual residence, on the other hand, had significantly lower values. Having a non-Indigenous person living in the household was associated with a lower index value, as was living in certain family types. Socioeconomic status was also important. In general, the results show that mainstream measures of community functioning were positively associated with community functioning for Indigenous Australians. Those who were not employed had lower values, as did those with relatively low levels of education or who lived in low-income households. Those who lived in high-low-income households and who had a post-school qualification, on the other hand, had a higher index value.
There was a smaller association with housing variables, with overcrowding having no association. However, those who lived in a house that was rented from a community organisation had a higher index value.
Results from an analysis of the factors associated with community functioning, but looking at the individual themes separately, are provided in Table 4.
A number of different associations between the main explanatory variables and the different community functioning themes reinforce the results from the descriptive findings section – that there is no single construct underlying community functioning. Some of these differences by remoteness and sex were discussed with regard to Fig. 2.
Some variables were associated with one of the
community functioning themes but not the others. People who changed usual residence had lower values for the safety index, but not the connectedness or resilience indices. This is an important finding, because policy often intentionally or unintentionally affects location choice and whether to move. Having a non-Indigenous person living in the household was strongly (negatively) associated with community connectedness, but not with resilience or safety. That is not to say, of course, that mixed partnering or living with non-Indigenous Australians should be discouraged. Rather, it shows that some forms of community connectedness may be influenced by household interaction, and some Indigenous Australians may need additional support beyond this.
Low income was associated with lower index values for the connectedness theme, but not the resilience or safety
rental and renting from a state housing organisation were strongly negatively associated with feelings of safety. Interestingly, living in a crowded dwelling was positively associated with community connectedness.
Relationship between community
functioning and measures of wellbeing
Using the same outcome variables as analysed in Table 3, seven models were used to analyse the relationship between community functioning and measures of wellbeing. The first model that was estimated uses ordinary least squares (OLS) estimation of the linear model, with the outcome measure being the individual’s self-reported life satisfaction. The remaining six models are based on maximum likelihood estimation of the probit model, for the relevant binary dependent variable.
The main explanatory variable is the community functioning index. In addition to this main explanatory variable, we also control for the variables presented in Table 3. The results in Fig. 3 highlight the difference in subjective wellbeing, health behaviour and service barriers from a 1 standard deviation increase in the community functioning index. Results are presented either as an index valuable (ranging from 0 to 1) for life satisfaction, or predicted probabilities for the remaining four variables. Before discussing the results, it is important to keep in mind that the data are cross-sectional (as opposed to longitudinal). This means that it is not possible to capture the temporal causality between the dependent variable and the main outcome measure (cultural activities). Despite this caveat, the results show that an increase in the community functioning index is associated with a higher value of the outcome variables, with that difference greatest (in percentage terms) for the two measures of emotional wellbeing (happy person all or most of the time in the previous four weeks, and felt so sad that nothing could cheer them up at least some of the time in the previous four weeks).
The final analysis presented in this paper looks at the relationship between the individual community functioning themes and the same measures of wellbeing presented above. Seven models are estimated, one for each measure of wellbeing. In addition to controlling for the explanatory variables used in Tables 3 and 4, each index is included as a separate explanatory variable in a single model. To simplify the presentation of results, the sign and statistical significance of the results are given (Table 5). Coefficient estimates are available as an appendix to the paper.
TABLE 4 .
Factors associated with individual community functioning themes
Factor
Coefficient
Connectednessa Resiliencea Safetyb
Female 0.06** –0.018 –0.301***
Aged 15–24 years –0.175*** –0.034 –0.119***
Aged 25–34 years –0.083** –0.032 –0.090**
Aged 45–54 years 0.052 0.140*** 0.090**
Aged 55–64 years 0.007 0.198*** 0.230***
Aged 65 years and over 0.108* 0.540*** 0.352***
Lives in remote area 0.355*** –0.057* 0.107***
Not married –0.086 0.018 0.038
Changed usual residence in previous 5 years –0.021 0.042 –0.163***
Lives in a couple family with no children and no dependants –0.074* 0.025 –0.171*** Lives in a couple family with dependants but no children –0.044 –0.005 –0.020
Lives in a single-parent family with children –0.026 –0.037 –0.181***
Lives in a single-parent family with dependants but no children –0.268*** –0.178** –0.162**
Lives in an ‘other’ family –0.084 –0.127* –0.284***
Has non-Indigenous people living in the household –0.277*** –0.050 0.023
Not employed –0.234*** –0.086** –0.258***
Completed Year 10 or 11 –0.112*** –0.128*** –0.146***
Completed Year 9 or less –0.177*** –0.176*** –0.252***
Has a degree 0.447*** 0.189*** –0.025
Has an ‘other’ qualification 0.229*** 0.028 –0.046
Equivalised household income in bottom decile –0.138*** –0.030 –0.060 Equivalised household income in 2nd or 3rd decile –0.131*** –0.086** –0.054 Equivalised household income in 7th, 8th, 9th or 10th decile 0.088** 0.104** 0.039
Lives in a private rental dwelling –0.011 –0.009 –0.170***
Lives in a dwelling rented from state housing 0.126*** –0.028 –0.263*** Lives in a dwelling rented from community organisations 0.333*** –0.043 –0.091*
Lives in an ‘other’ tenure type 0.083 –0.072 –0.084
Household identified as needing additional bedrooms 0.090** –0.020 0.026
Predicted index value for base case 0.161 0.161 0.781
Adjusted R-squared 0.1483 0.0389 0.1194
* = coefficient statistically significant at the 10% level of significance; ** = coefficient statistically significant at the 5% level of significance; *** = coefficient statistically significant at the 1% level of significance
a Sample size is 5435.
b Sample size is 5427.
Note: The base case individual for all estimations is an employed male aged 35–54 living in nonremote Australia who is married, lives in a couple family without children with Indigenous Australians only in the household, speaks English at home, did not change usual residence in the previous 5 years, has completed Year 12, does not have a qualification and lives in an owner-occupied house that meets the occupancy standard used by the Australian Bureau of Statistics.
FIG . 3 .
Relationship between community functioning and measures of wellbeing
0.0 0.1 0.2 0.3 0.4 0.5 0.6 0.7 0.8 0.9One standard deviation increase in community functioning Base case (average value for community functioning)
No barriers to accessing services Nonrisky alcohol consumption** Nonsmoker** Self-assessed health*** Felt so sad that
nothing could cheer them up at least some of the time in previous 4 weeks*** Happy person all or most of the time in previous 4 weeks*** Life satisfaction (converted to 0–1 scale)***
Probability of outcome or index value
** = coefficient statistically significant at the 5% level of significance; *** = coefficient statistically significant at the 1% level of significance
Note: The base case individual for all estimations is an employed male aged 35–54 living in nonremote Australia whio is married, lives in a couple family without children with Indigenous Australians only in the household, speaks English at home, did not change usual residence in the previous 5 years, has completed Year 12, does not have a qualification and lives in an owner-occupied house that meets the occupancy standard used by the Australian Bureau of Statistics.
TABLE 5 .
Relationship between individual community functioning themes and measures of wellbeing
Measure of wellbeing Connectedness Resilience Safety
Life satisfaction (converted to 0–1 scale) +++ +++ +++
Happy person all or most of the time in the previous 4 weeks +++ +++ +++ Felt so sad that nothing could cheer them up at least some of the time
in the previous 4 weeks -- ---
---Self-assessed health ++ ++
Nonsmoker +
Nonrisky alcohol consumption +
No barriers to accessing services --- +++ +++
Note: The direction of the association is described using + (positive association) or – (negative association). Estimations for which the coefficient is statistically significant at the 1% level of significance are labelled +++ or ---; those statistically significant at the 5% level of significance only are labelled ++ or --; those statistically significant at the 10% level of significance only are labelled + or -.
There is a strong and statistically significant association between the first three measures of subjective wellbeing and each of the community functioning themes. Keeping in mind the limitation discussed above of measure association rather than causation, it is clear that those with high levels of all three measures of community functioning were more likely to be satisfied with their life, more likely to report that they were a happy person all or most of the time, and less likely to report that they felt so sad that nothing could cheer them up. The association with self-assessed health was slightly weaker, and there was no statistically significant association with connectedness. Furthermore, there was no real association with health behaviour.
The final variable in the model – no barriers to accessing services – had a more complicated relationship with community functioning. Those with higher values of the resilience and safety measures were more likely to report that they did not have any barriers. However, when controlling for those two variables and for a range of additional demographic, socioeconomic and geographic variables, there was a negative and statistically significant association between connectedness and service access. This is an area of potential policy concern, and shows that community connectedness does not necessarily correlate with connectedness to government services.
Concluding comments and limitations
As stated at the start of this paper, there is a growing and increasingly evidence-based call from Indigenous communities and related researchers to focus on the strengths and resilience of the Aboriginal and Torres Strait Islander population when reporting data and statistics, as opposed to focusing solely on gaps and deficits with the non-Indigenous population. The availability of unit record data from the 2014–15 NATSISS allows such an analysis to be done for a key concept identified as being important for the Aboriginal and Torres Strait Islander population – community functioning. In this paper, I followed a four-step process for such an analysis, building on work on the 2008 NATSISS that looked at capabilities and social capital (Biddle 2011), and the considerable input from a range of Aboriginal and Torres Strait Islander community members in the design of a community functioning construct for the HPF. Step 1 in the analysis was to identify a subset of community functioning measures and develop an index or set of indices; step 2 was to analyse the distribution of community functioning by remoteness, sex and age; step 3 involved analysis of the factors associatedwith community functioning; and step 4 completed the analysis by looking at the relationship between community functioning and individual-level outcomes. One of the main findings was that no single index could summarise the variation in the community functioning measures. Rather, the empirical evidence suggests that community functioning is better thought of as a set of themes and related constructs. These are correlated in similar ways with some of the demographic, socioeconomic and geographic variables (e.g. the young tended to have lower values for all indices, as did those with relatively low levels of education). However, there were other variables such as sex, remoteness, migration, housing and income that had quite different associations. A second finding from the analysis, however, was that community functioning was strongly associated with individual measures of wellbeing. There is very strong evidence that those with high levels of all three measures of community functioning (connectedness, resilience and safety) were more likely to be satisfied with their life, more likely to report that they were a happy person all or most of the time, and less likely to report that they felt so sad that nothing could cheer them up. There was, however, a negative and statistically significant association between connectedness and service access. This is an area of potential policy concern.
There were two major limitations of the study that are important to raise. First, despite the strong associations mentioned above, it is not possible with the data available to make any conclusions related to causality. It might be that education influences community functioning and that community functioning influences wellbeing. That is how the analysis has been framed. However, it is equally likely that those who live in communities that are doing well are better able to undertake school and post-school education, or that those with higher levels of wellbeing report better outcomes for their community. That is, the causality could go in the opposite direction. It is difficult with any social science constructs to measure causality definitively, but longitudinal data would go a long way to making the results more policy relevant (Biddle 2014). The second limitation is that the NATSISS is an individual-level survey that is being used to measure outcomes related to interaction and strength within a community. In the NATSISS, individuals are asked about their relationships with family and friends, and their perceptions about the functioning of the community in which they live (such as safety, neighbourhood problems, trust, feeling able to have a say). These results reflect the perceptions of a representative sample of the Indigenous
population aged 15 years and over. This is a perfectly valid approach to measure an aspect of community functioning. However, there are no direct measures in the NATSISS that measure community infrastructure or directly capture the interaction that is occurring within the community.
Despite these limitations, the results presented in this paper demonstrate the complexity of community functioning as a construct (or set of constructs), but also the power of such strength-based measures to improve our understanding of the circumstances of the Aboriginal and Torres Strait Islander population.
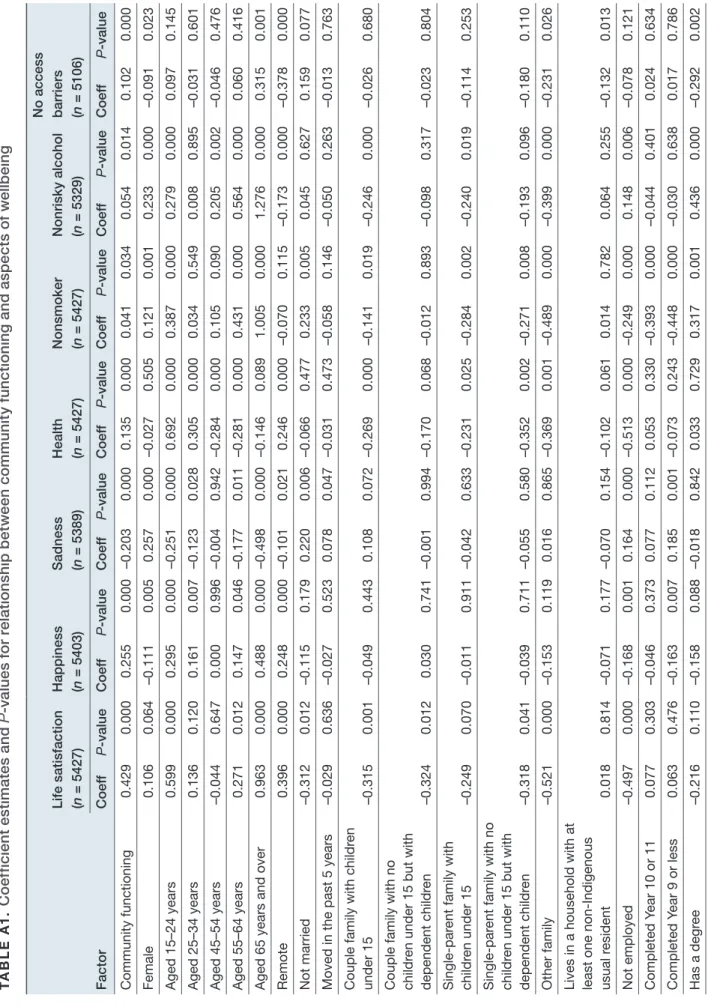
T A B L E A 1 .
C
o
ef
fici
en
t e
sti
m
at
es
a
nd
P
-v
al
ue
s f
or
r
ela
tions
hi
p
b
et
w
ee
n com
m
un
it
y f
un
ct
ion
in
g
a
nd
a
sp
ec
ts
o
f w
el
lb
ei
ng
Factor Life satisfaction (n = 5427) Happiness (n = 5403) Sadness (n = 5389) Health (n = 5427) Nonsmoker (n = 5427) Nonrisky alcohol (n = 5329) No access barriers (n = 5106) Coef f P -value Coef f P -value Coef f P -value Coef f P -value Coef f P -value Coef f P -value Coef f P -value Community functioning 0.429 0.000 0.255 0.000 –0.203 0.000 0.135 0.000 0.041 0.034 0.054 0.014 0.102 0.000 Female 0.106 0.064 –0.111 0.005 0.257 0.000 –0.027 0.505 0.121 0.001 0.233 0.000 –0.091 0.023 Aged 15–24 years 0.599 0.000 0.295 0.000 –0.251 0.000 0.692 0.000 0.387 0.000 0.279 0.000 0.097 0.145 Aged 25–34 years 0.136 0.120 0.161 0.007 –0.123 0.028 0.305 0.000 0.034 0.549 0.008 0.895 –0.031 0.601 Aged 45–54 years –0.044 0.647 0.000 0.996 –0.004 0.942 –0.284 0.000 0.105 0.090 0.205 0.002 –0.046 0.476 Aged 55–64 years 0.271 0.012 0.147 0.046 –0.177 0.011 –0.281 0.000 0.431 0.000 0.564 0.000 0.060 0.416Aged 65 years and over
0.963 0.000 0.488 0.000 –0.498 0.000 –0.146 0.089 1.005 0.000 1.276 0.000 0.315 0.001 Remote 0.396 0.000 0.248 0.000 –0.101 0.021 0.246 0.000 –0.070 0.115 –0.173 0.000 –0.378 0.000 Not married –0.312 0.012 –0.115 0.179 0.220 0.006 –0.066 0.477 0.233 0.005 0.045 0.627 0.159 0.077
Moved in the past 5 years
–0.029 0.636 –0.027 0.523 0.078 0.047 –0.031 0.473 –0.058 0.146 –0.050 0.263 –0.013 0.763
Couple family with childr
en under 15 –0.315 0.001 –0.049 0.443 0.108 0.072 –0.269 0.000 –0.141 0.019 –0.246 0.000 –0.026 0.680
Couple family with no childr
en under 15 but with
dependent childr en –0.324 0.012 0.030 0.741 –0.001 0.994 –0.170 0.068 –0.012 0.893 –0.098 0.317 –0.023 0.804 Single-par
ent family with
childr en under 15 –0.249 0.070 –0.011 0.911 –0.042 0.633 –0.231 0.025 –0.284 0.002 –0.240 0.019 –0.114 0.253 Single-par
ent family with no
childr
en under 15 but with
dependent childr en –0.318 0.041 –0.039 0.711 –0.055 0.580 –0.352 0.002 –0.271 0.008 –0.193 0.096 –0.180 0.110 Other family –0.521 0.000 –0.153 0.119 0.016 0.865 –0.369 0.001 –0.489 0.000 –0.399 0.000 –0.231 0.026
Lives in a household with at least one non-Indigenous usual r
esident 0.018 0.814 –0.071 0.177 –0.070 0.154 –0.102 0.061 0.014 0.782 0.064 0.255 –0.132 0.013 Not employed –0.497 0.000 –0.168 0.001 0.164 0.000 –0.513 0.000 –0.249 0.000 0.148 0.006 –0.078 0.121 Completed Y ear 10 or 11 0.077 0.303 –0.046 0.373 0.077 0.112 0.053 0.330 –0.393 0.000 –0.044 0.401 0.024 0.634 Completed Y ear 9 or less 0.063 0.476 –0.163 0.007 0.185 0.001 –0.073 0.243 –0.448 0.000 –0.030 0.638 0.017 0.786 Has a degr ee –0.216 0.110 –0.158 0.088 –0.018 0.842 0.033 0.729 0.317 0.001 0.436 0.000 –0.292 0.002
Appendix
Life satisfaction (n = 5427) Happiness (n = 5403) Sadness (n = 5389) Health (n = 5427) Nonsmoker (n = 5427) Nonrisky alcohol (n = 5329) No access barriers (n = 5106) Coef f P -value Coef f P -value Coef f P -value Coef f P -value Coef f P -value Coef f P -value Coef f P -value –0.198 0.002 –0.086 0.046 0.073 0.072 –0.031 0.479 –0.053 0.188 0.079 0.077 –0.159 0.000 –0.101 0.262 –0.102 0.093 0.067 0.244 0.187 0.003 –0.049 0.392 –0.020 0.761 –0.026 0.673 0.051 0.523 –0.090 0.099 0.049 0.340 0.001 0.990 –0.047 0.366 –0.011 0.855 –0.084 0.125 0.187 0.036 0.037 0.548 –0.099 0.092 0.160 0.013 0.040 0.499 –0.100 0.115 0.265 0.000 ented
ough the private r
ental –0.258 0.002 0.003 0.959 0.082 0.120 –0.112 0.049 –0.247 0.000 –0.028 0.635 –0.011 0.846 ented fr om ganisation –0.189 0.032 0.065 0.273 0.192 0.001 –0.018 0.763 –0.386 0.000 0.121 0.065 0.032 0.598 ented fr om ganisation –0.014 0.894 0.183 0.012 0.234 0.001 0.009 0.906 –0.442 0.000 –0.172 0.021 –0.096 0.177 e –0.106 0.346 0.025 0.743 0.172 0.018 –0.015 0.851 –0.108 0.135 0.062 0.435 –0.103 0.170 cr owded 0.054 0.533 –0.124 0.037 0.022 0.694 0.112 0.082 0.025 0.649 0.074 0.240 0.031 0.599 7.691 0.000 0.821 0.000 –0.696 0.000 1.016 0.000 0.760 0.000 0.586 0.000 0.908 0.000 ed 0.1188 0.0656 0.0650 0.1281 0.0917 0.0638 0.0329 A B L E A 1 .
(con
tin
ue
d
)
Notes
1. https://www.dpmc.gov.au/sites/default/files/publications/ indigenous/Health-Performance-Framework-2014/tier-1-health-status-and-outcomes/113-community-functioning. html 2. www.aihw.gov.au/WorkArea/DownloadAsset. aspx?id=6442458651 3. www.abs.gov.au/ausstats/abs@.nsf/PrimaryMainFeatures/4 720.0?OpenDocumentReferences
AHMAC (Australian Health Ministers’ Health Advisory Council) (2014). Aboriginal and Torres Strait Islander health performance framework report 2014, AHMAC, Canberra.
Armstrong S, Buckley S, Lonsdale M, Milgate G, Bennetts Kneebone L, Cook L & Skelton F (2012). Starting school: a strengths‐based approach towards Aboriginal and Torres Strait Islander children, report prepared by the Australian Council for Educational Research, for the Australian Government Department of Families, Housing, Community Services and Indigenous Affairs, Canberra.
Biddle N (2011). Social capital and capabilities, lecture 11, 2011 CAEPR Online Lecture Series, Measures of Indigenous wellbeing and their determinants across the lifecourse, http://caepr.anu.edu.au/ population/lectures2011.php.
— (2014). Data about and for Aboriginal and Torres Strait Islander Australians, Closing the Gap Clearinghouse issues paper 10, Australian Institute of Health and Welfare, Canberra. Brough MK, Bond C & Hunt J (2004). Strong in the
city: towards a strength-based approach in Indigenous health promotion. Health Promotion Journal of Australia.15(3):215–220.
Kukutai T & Walter M (2015). Recognition and indigenizing official statistics: reflections from Aotearoa New Zealand and Australia. Statistical Journal of the IAOS 31(2):317–326.
Nussbaum M (2000). Women and human development: a study in human capabilities, Cambridge University Press, New York.
Pearson N (2005). Freedom, capabilities and the Cape York reform agenda, viewpoint, October, Cape York Institute, Cairns.
Pholi K, Black D & Richards C (2009). Is ‘close the gap’ a useful approach to improving the health and wellbeing of Indigenous Australians? Australian Review of Public Affairs 9(2):1–13.
Sen A (2001). Development as freedom, Oxford University Press, New York.
—(2004). Rationality and freedom, Harvard University Press, Massachusetts.
Tsey K, Wilson A, Haswell-Elkins M, Whiteside M, McCalman J, Cadet-James Y & Wenitong M (2007). Empowerment-based research methods: a 10-year approach to enhancing Indigenous social and emotional wellbeing. Australasian Psychiatry 15(Suppl 1):S34–S38.
Yap M & Yu E (2016). Operationalising the capability approach: developing culturally relevant indicators of Indigenous wellbeing – an
Australian example. Oxford Development Studies 44(3):315–331.