Full Length Article
Direct healthcare costs of acute myocardial infarction in Canada’s elderly
across the continuum of care
Deborah Cohen
a,⇑, Douglas G. Manuel
b, Peter Tugwell
c, Claudia Sanmartin
d, Tim Ramsay
e aDepartment of Population Health, University of Ottawa, Institute for Clinical Evaluative Sciences, Ontario, Canadab
Ottawa Hospital Research Institute, University of Ottawa, Institute for Clinical Evaluative Sciences, Ontario, Canada c
Centre for Global Health, Institute of Population Health, Ottawa Health Research Institute, University of Ottawa, Ontario, Canada d
Health Analysis Division, Statistics Canada, Ontario, Canada e
Ottawa Hospital Research Institute, Department of Epidemiology and Community Medicine, University of Ottawa, Ontario, Canada
a r t i c l e
i n f o
Keywords: Myocardial infarction Continuum of care Acute care Primary care Cost drivers Health spendinga b s t r a c t
A growing number of healthcare policy initiatives around the world have focused on the continuum of care amongst the elderly, calling for renewed investments in integrated care to promote healthy aging and to reduce health system costs. The study objective was to examine healthcare costs and cost drivers for myocardial infarction (AMI) among Canadian Seniors across the care continuum from 2004 to 2012 in Ontario, Canada. Cost estimates represented direct community and hospital-based costs including physician services, diagnostic-testing, pharmaceuticals and hospitalizations obtained from Canadian healthcare data sources. Separate costs were calculated for pre-state care, the hospital event, and post-state care over a 6 year care continuum. Socio-demographic and co-morbid cost drivers were studied using negative binomial regression in a cohort of 16,450 first-time AMI seniors.
The average cost per patient across a six-year care continuum was $28,169 in 2008 constant Canadian dollars. Almost three-quarters of these costs were derived from the event phase ($20,794), while pre-state and post-state costs made up 12% and 14%, respectively ($3400 and $3974). Pre-state costs per patient day were half of post-state costs ($3.11 versus $6.32 per day) when adjusted for survival. Socio-demographic characteristics including age, gender and patient’s urban/rural residence, and co-morbid illnesses were key cost drivers across the phases of care. This study provides a person-centered health system perspective in the economic burden of AMI in Canada’s elderly and will inform health policy related to integrated care strategies for heart disease in seniors.
Ó2014 The Authors. Published by Elsevier B.V. This is an open access article under the CC BY-NC-ND license (http://creativecommons.org/licenses/by-nc-nd/3.0/).
Introduction
Acute Myocardial Infarction (AMI) exacts a significant burden of illness world-wide. AMI is responsible for between 40% and 50% of the 17 million annual cardiovascular disease deaths globally (Yusuf et al., 2001; WHO, 2011), and represents the leading cause of mor-bidity and mortality in North America (Tu et al., 1997). The impact of AMI on the elderly is particularly profound, with a ten-fold greater AMI incidence among those 65–74 as compared to those 35–44, and a persistently high case fatality rate for patients over the age of 65 (Roger, 2007; Yazdanyar and Newman, 2009). Given global trends in population aging and the anticipated increase in corresponding AMI health care costs (Heidreneich et al., 2011; Kim et al., 2013), governments around the world are growing
increasingly focused on integrated seniors strategies to address heart disease across the continuum of care in order to promote healthy aging and mitigate healthcare spending (Smith, 2009; Health Council of Canada, 2012; Leatt et al., 2000; Nolte and McKee, 2008).
The last decade has seen a growing interest in models of care for AMI that promote coordination of services across the care contin-uum, however there remains limited available evidence about actual costs of AMI across the care trajectory (Nolte and McKee, 2008). Despite the substantive disease burden of AMI among the elderly, AMI costing research across the care continuum is particu-larly lacking for those over 65 (Tarride et al., 2009). In the Canadian context, in which a single-payer universal healthcare provides physician, hospital and drug coverage to all seniors, no study has yet examined direct AMI costs in the elderly across the complete continuum of care; exploring costs in community and hospital-based care, both before and after the index AMI event. This is surprising given that seniors have been shown to be among
http://dx.doi.org/10.1016/j.jeoa.2014.05.002
2212-828X/Ó2014 The Authors. Published by Elsevier B.V.
This is an open access article under the CC BY-NC-ND license (http://creativecommons.org/licenses/by-nc-nd/3.0/).
⇑Corresponding author. Address: 35 Soho Crescent, Ottawa, Ontario, Canada. Tel.: +1 613 823 3654.
E-mail address:deborah.cohen@rogers.com(D. Cohen).
Contents lists available atScienceDirect
The Journal of the Economics of Ageing
the highest users of AMI healthcare services (CIHI, 2011a; Krumholz et al., 1998) and that integrated care models for seniors in general have been shown to improve health outcomes and cost-savings overall (MacAdam, 2008; Carstairs and Keon, 2009).
The purpose of this study was to examine healthcare costs and cost drivers for AMI among Canadian seniors across the care continuum from 2004 to 2012 in Ontario, Canada. Patient cost data are presented in aggregate but are also delineated in time across the care trajectory to detail the costs of healthcare services prior to AMI, the costs of acute in-patient AMI care, and the costs of disease management following the AMI event. Finally, socio-demographic and clinical factors that are major drivers of cost along the patient’s care continuum are explored.
Methods
The Canadian Institute for Health Information’s Discharge Abstract Database (DAD), housed at the Institute of Clinical Evalu-ative Sciences (ICES) of Ontario, Canada was used to identify the population-based study cohort. All patients between the ages of 65 and 105 who were admitted to Ontario hospitals with a most responsible diagnosis of AMI (ICD-10 code (I21)) between April 1, 2007 and March 31, 2009 were included in the study. We established incident AMI cases by selecting only those patients for whom the absence of a hospitalization for AMI could be estab-lished for up fifteen years prior to the index AMI. Patients were required to be residents of Ontario for the duration of the study period to ensure that all services could be accurately tracked. Patients living in the Kingston/Quinte/Rideau region were excluded due to alternative billing arrangements in which services could not be captured with available data sources.
For each patient, a trajectory was established to measure the cost of key AMI-related services across a typical patient care continuum. The methodology for developing and presenting cost estimates was adapted fromO’Brien et al. (2003)in which services across the care trajectory were reported separately for the event (hospitalizations associated with the patient’s AMI and one-year follow-up heart-related readmissions) and for the post-state (com-munity-based services following the AMI event). For the purposes of this study, a third pre-state phase was introduced to account for services associated with the patient’s care prior to the AMI event. Cost estimates represented direct healthcare costs within the community and hospital settings.
Longitudinal patient record
Longitudinal patient records were created using deterministic linkage via unique encrypted patient health insurance numbers. Ontario’s DAD was used to estimate the cost of in-patient services associated with the AMI event, and all subsequent heart-related readmissions (ICD-10 I codes) for up to one year following the AMI index date. Patient records were linked with Ontario’s Hospital Insurance Plan (OHIP) billing data to examine the costs of relevant pre-state and post-state services for three years prior to and three years following the AMI. This approach resulted in a follow-up period of six years for each patient over a total study period ranging between the fiscal years of 2004 and 2012.
Costing data sources and costing techniques
CIHI’s discharge abstract database
In-hospital patient costs were generated using a bottom-up activity-based costing model to allocate costs for individual service recipients based on service dates (Chapko et al., 2009; CIHI, 2011b).
To estimate event costs, Resource Intensity Weights (RIW™) within the DAD were used to determine the intensity of hospital resource use for each patient based on the standard Canadian patient case-mix classification (Case Mix Groups, CMG™). CMGs represent a standardized grouping of hospital services for a set of major clinical categories, similar to the diagnosis-related grouping (DRG) system used in the United States and in Europe (Hakkinen et al., 2012; Feter et al., 1980). RIWs reflect the relative value of hospital resources utilized for each inpatient case, including fixed and variable, direct and indirect costs attributable to inpatient care (CIHI, 2011b). Indirect costs associated with transient cost centres were allocated to cost centres using a reciprocal costing method – simultaneous equality allocation method (SEAM) (CIHI, 2011b; Young, 2003). Direct and indirect costs in each functional centre were then assigned to the patient based on an algorithm that accounted for unit costs and patient-specific workload (CIHI, 2011b). Canada’s activity-based costing methods, and RIW and CMG standards have been documented elsewhere (CIHI, 2004, 2011b).
It should be noted that physician costs were not included in the standard RIW costing methodology as physician payments are handled outside of the hospital funding matrix in Canada. As such, physician billing costs which are handled largely on a fee-for-service basis in Ontario, Canada were directly allocated to relevant hospitalization event costs using the admission and discharge dates to develop complete event costs for each patient (Young, 2003). Individual RIWs for each discharge were multiplied against the 2008 average cost per weighted case for Ontario hospitals, to establish an in-hospital cost for each patient in the cohort (CIHI, 2013).
Ontario’s health insurance plan database (OHIP)
OHIP billing data was used to measure of the cost of laboratory and diagnostic services and physician consultations associated with the pre-state, event, and post-state phases of care based on billing dates. Physician costs for targeted heart-related services provided in the community were measured using a defined set of OHIP fee and diagnostic codes, adapted from Tu et al.’s (2001)
hospital-based methodology. Ontario’s 2008 Schedule of Benefits was used to assign costs to each billed physician service and Ontario’s laboratory unit index was used to directly allocate costs for laboratory services (OHIP, 1999).
Ontario’s drug benefits database (ODB)
The Ontario Drug Program provides prescription drug coverage for all Ontario residents aged 65 and over. ODB data were used to measure the cost of medications within the pre-state and post-state phases of care. Drug costs in the event phase were built into the RIW hospital costing methodology and could not be isolated for the purposes of comparison in this study. Cost estimates were generated for all prescriptions filled in the community for the fol-lowing therapeutic drug classes; Statins, Beta Blockers, Calcium Channel Blockers and Ace-Inhibitors as per clinical practice guide-lines (Tobe et al., 2011; Daskalopoulou et al., 2012; Anderson et al., 2013). Costs for prescription drugs were generated by multiplying the average cost per tablet by the quantity dispensed for each claim and directly allocated to each patient in the pre-state and post-state phases.
Demographic and clinical data sources
Clinical co-morbidity data were derived from CIHI’s DAD at the time of AMI admission based on the Ontario Acute Myocardial Mortality Prediction rules (Tu et al., 2001). Patient demographic
data were derived from the ICES Registered Persons Database. Patients’ urban/rural and socioeconomic status (SES) were deter-mined using an area-based methodology in which the full patient postal code was linked with the 2006 Census neighborhood data (Statistics Canada). Patients were assigned a low, medium and high SES based on median neighborhood income that mapped to the Ontario income distribution.
Statistical analysis
Patient costs in the pre-state, event and post-state phases were calculated according to major spending categories. Cost per patient day survived was calculated by dividing the total spending in each phase of care by the total number of days contributed by each patient based on individual survival. As with most econometric data, cost distributions were heavily right-skewed, therefore both average and median patient costs are presented. To address non-normality, we used negative binomial regression to model the independent effects of socio-demographic and clinical co-morbidities on pre-state, event and post-state costs (Bond and Farewell, 2009; Charkha et al., 2013). The over-dispersion parame-ter alpha in each model was significantly different from zero indi-cating that the negative binomial was a better fit to the data than the Poisson (Agresti, 2001). To address the high volume of zeros in pre and post-state costs, zero-inflated negative binomial regres-sions were applied (Lewsey and Thompson, 2004). Socio-demographic independent variables included age, sex, patient’s urban/rural status and SES. Co-morbid independent variables included congestive heart failure (CHF), cardiac dysrhythmias, pulmonary edema, shock, chronic renal failure, acute renal failure, diabetes with complications, malignancy, and cerebrovascular disease (Tu et al., 2001). The regression models included an offset to address differences in log survival following discharge from hospital. Collinearity among predictor variables was determined to be acceptable based on a variance inflation factor cut-off of ten (Stevens, 1996). The Chi-Square Wald statistic was used to determine the contribution of the main effects, and incident rate ratios were used as the measure of association between groups. The study was approved by the Ottawa Hospital Research Ethics Board, Ottawa, Ontario, Canada.
Results
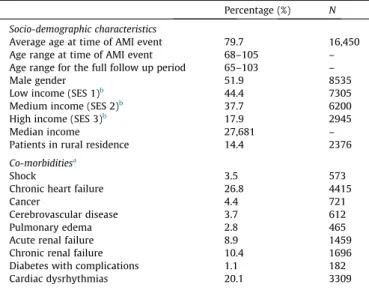
Patient socio-demographic and co-morbid illness characteristics A total of 16,450 Senior patients were included in the study cohort, with an average age of 79.7 at the time of the index AMI event. Patients’ ages ranged from 65 to 105 across the six-year con-tinuum of care period. Fifty-two percent of the sample was male and 14% lived in a rural area. The median personal income was $27,681 dollars per annum. Among the co-morbid illnesses diag-nosed at the time of AMI, CHF (27%) and cardiac dysrhythmia (20%) were the two most common diagnoses (Table 1).
Crude and survival adjusted pre-state, event and post state costs The crude average cost per patient for the six-year continuum of care was $28,169 (Standard deviation (SD) 25,235) (Table 2). Of the total cost across the care continuum, 74% ($20,794 (SD 24,221)) was associated with the in-patient event phase, 12% ($3400 (SD 2910)) with the pre-state phase and 14% ($3974 (SD 3397) with the post-state phase in the community.
Table 3 delineates pre-state, event, and post-state cost per patient day adjusted by survival over the six-year follow up period. Once survival adjustments were applied, the cost per patient day of
pre-state care was less than half (49%) of post-state care in the community ($3.11 (SD 2.65)) per day versus $6.32 (SD 14.39) per day). The average event cost per patient day in hospital (based on number of days in hospital) was $1759 (SD 1047).
Socio-demographic and clinical predictors of pre-state, event and post-state costs
Table 4presents results of the models examining socio-demo-graphic and co-morbid illness predictors of pre-state, event, and post-state costs adjusted by the offset survival variable.
Socio-demographic cost drivers
Across each of the three models, patient’s sex and location of residence were significant drivers of cost, when other factors were controlled for. Being male increased expected pre-state cost by 6.1% (95% Confidence Interval (CI) 1.03–1.09), event costs by 11.1%, (CI 1.08–1.14) and post-state costs by 4.6% (CI 1.02–1.08) in comparison to female patients. Living in an urban area increased patient’s expected pre-state cost by 12.9% (CI 1.08–1.18), event costs by 5.9% (CI 1.02–1.09), and post-state costs by 11.8% (CI 1.08–1.16) compared to patient’s living in a rural area. Patient’s age was a negative predictor of event cost and post-state cost, decreasing expected costs by 0.7% (CI 0.991–0.995) and 3.6% (CI 0.966–0.970), respectively for each additional year. Patient’s SES was not a significant predictor of pre-state or post-state cost, when all other factors were controlled for. However patient’s low SES was a significant predictor of in-hospital costs, increasing expected event costs by 3.5% (CI 1.00–1.07) in comparison to patients with high SES.
Co-morbid Illness cost drivers
All co-morbid illnesses included in our models were significant predictors of cost in at least one of the pre-state, event or post-state Table 1
Patient Characteristics.
Percentage (%) N Socio-demographic characteristics
Average age at time of AMI event 79.7 16,450 Age range at time of AMI event 68–105 – Age range for the full follow up period 65–103 –
Male gender 51.9 8535
Low income (SES 1)b
44.4 7305 Medium income (SES 2)b
37.7 6200 High income (SES 3)b
17.9 2945 Median income 27,681 – Patients in rural residence 14.4 2376
Co-morbiditiesa
Shock 3.5 573
Chronic heart failure 26.8 4415
Cancer 4.4 721
Cerebrovascular disease 3.7 612 Pulmonary edema 2.8 465 Acute renal failure 8.9 1459 Chronic renal failure 10.4 1696 Diabetes with complications 1.1 182 Cardiac dysrhythmias 20.1 3309
Abbreviations:AMI (acute myocardial infarction), SES (socioeconomic status).
a
Co-morbid conditions based on Ontario AMI Mortality Prediction Rules, (Tu et al., 2001).
b
Area based income methodology based on income distribution in the 2006 Ontario Census data from Statistics Canada. Neighborhood income quintiles were arranged such that the lowest two income groups formed the ‘low-income’ group, the third and fourth quintiles formed the ‘middle-income’ group, and the fifth quintile formed the ‘high-income’ group.
phases, when other factors were controlled for. Co-morbid condi-tions grouped into two main types of cost drivers. One set of co-morbid illnesses were significant predictors of cost across the entire care continuum. These co-morbid illnesses, including CHF, diabetes with complications, shock, acute renal failure and cancers, were positive predictors of cost in the pre-state and event phases and then became negative predictors of cost in the post-state phase. For example, presence of CHF was a significant driver of pre-state cost (increasing costs by 30.9% (CI 1.26–1.36)) and of event costs (increasing costs by 60% (CI 1.56–1.64). Correspond-ingly, presence of CHF decreased post-state costs by 5.5% (CI 0.91–0.98).
A second cost driver pattern was determined for cardiac dysrhythmias, cerebrovascular disease and chronic renal failure. These co-morbid illnesses were significant predictors of cost in the pre-state and event phases of care, but were not significant predictors of cost in the post-state event. For example, presence of cardiac dysrhythmias increased expected pre-state costs by 12.6% (CI 1.08–1.17), and increased expected event costs by 30.6% (CI 1.27–1.35), but did not significantly predict post-state costs.
Discussion
This study provided a first-time population-based investigation of community and hospital costs related to AMI across a six-year care continuum for elderly patients in Ontario, Canada. The aver-age healthcare cost per patient across the care continuum was found to be $28,169 (SD 24,221) (2008 constant Canadian dollars). Average in-patient AMI cost for the first episode of care at $14,684 (SD 19,174) was within range of other acute care costing studies conducted in the Unites States and Europe (Azoulay et al., 2003;
Kauf et al., 2006; Tiemann, 2008; Hakkinen et al., 2012; Krumholz et al., 1998). However this study’s novel approach to AMI costing across the care continuum demonstrated the substan-tial costs incurred beyond the acute care sector, by quantifying the community-based healthcare costs at 26% of the total patient cost across the six-year care continuum. This work further demon-strated a twofold increase in community-based costs from pre-state to post-pre-state phases of care ($3.11 (pre-pre-state) versus $6.32 (post-state) per patient day) when days survived were accounted for. Taken together these results highlight the substantial eco-nomic impact of AMI beyond the acute care sector and reinforce the value of taking a health system perspective to view health expenditures along a patient’s continuum of care.
Accurate and comprehensive cost data are critical in economic evaluations in healthcare to assist decision makers in ensuring that limited resources are allocated as efficiently as possible (Evans and Crawford, 2000; Rice, 2000). Person-centric AMI cost estimates which span the different phases of the care trajectory through time are critical for the development of prevalence-based healthcare spending estimates and comprehensive cost of illness studies that may assist in future evaluation of care integration strategies for Canada’s elderly (CDC, 2013; Rice and Miller, 1998). Person-centric cost estimates can be useful for developing cost-effectiveness studies in which net or incremental costs of care are considered in relation to patient outcomes (Noyes and Holloway, 2004). The cost estimates developed in this particular study which were based on net (not incremental) costs may be used to develop average cost-effectiveness ratios for non-competing choice cost analysis to determine an intuitive cost per unit of health gained (Bang and Zhao, 2012).
The novel care continuum costing approach used in this study also identified key cost drivers at different phases of the care trajectory and raised a number of important questions for future Table 2
Crude average AMI patient pre and post- event, and state costs across the continuum of care (2008 constant Canadian Dollars).
Pre-state Hospitalization event Post-state Total Pre-state costs (per patient
cost for the 3 years prior to index AMI event)
Index AMI event costs index hospitalization (in-hospital drugs included in hospital cost)
One year follow-up hospitalization event costs (in-hospital drugs included in hospital cost)
Post state costs (per patient cost for the 3 years following index AMI event)
Physician fees Mean cost $ 1234.05 $1777.74 $365.81 $1707.31 (SD) (1554) (1785) (903) (2105) Median cost $656.57 $1377.13 $0 $1008.36 (Inter-quartile range) (274–1606) (6427–14,628) (0–0) (129–2500) Drugs Mean cost $ 2166.45 NA NA $2266.83 (SD) (2020) (1913) Median cost $ 1789.04 $2283.23 (Inter-quartile range) (282–3440) (249–3669) Hospital Mean cost NA $14,684.77 $3966.02 NA (SD) (19,174) (12,868) Median cost $9779.97 $0 (Inter-quartile range) (609–2157) (0–390) Sub-total Mean cost $3400.50 $16,462.21 $4331.83 $3974.14 (SD) (2910) (20,457) (13,382) (3397) Median cost $2806.69 $10,656.24 $0 $3858.33 (Inter-quartile range) (1019–5041) (7365–16,520) (0–1325) (612–6091) Total % Total cost 12.07% 73.82% 14.11% $28,168.67 Mean cost $3400.50 $20,794.04 $3974.14 (25,235) (SD) (2910) (24,221) (3397) $21,549.90 Median cost $2806.69 $13,454.72 $3858.33 (14,949–33,178) (Inter-quartile range) (1019–5041) (8719–24,466) (612–6091) Abbreviations:AMI (acute myocardial infarction), SD (standard deviation), NA (not available).
research. In the hospital phase of care, our findings aligned with existing research in which the significant role of clinical co-mor-bidities in predicting AMI hospital costs has been demonstrated (Krumholz et al., 1998; Evans et al., 2007; Smolderen et al., 2010). By examining patient costs prior to the AMI event however, this study also pointed to clinical co-morbidities as significant cost drivers in the pre-state phase. In particular, presence of CHF, acute and chronic renal failure, and diabetes with complications had the largest impact on expected pre-state costs and expected event costs. These results may be indicative of continuity of care between community and acute care, in which high treatment intensity for patients with these conditions is occurring in both pre-state and event phases of care. Given that these co-morbid conditions have identifiable and modifiable risk factors that overlap with risk fac-tors for AMI including obesity, hypertension, tobacco use, poor diet and sedentary lifestyles (Yusuf et al., 2001; WHO, 2003), it is likely that pre-state care is focused on addressing this common set of precursive risk factors (Tobe et al., 2011). Further work exploring the relationship between pre-state and event spending is warranted to more fully elucidate the role of integrated care in the prevention, treatment and management of AMI.
In pursuit of the continuum of care perspective for AMI, we also examined cost-drivers in the post-event phase of care. In this phase we found that a number of co-morbid illnesses were significant negative predictors of post-state costs. Specifically, the presence of cancer, shock, acute renal failure, and CHF decreased
expected post-state costs. While these results may appear unintu-itive, they likely point to an important relationship between comorbid illness, survival and associated follow-up AMI costs that requires further investigation. We propose that that these co-mor-bid illnesses were negative cost-drivers of post-state cost because of the high mortality rates associated with each condition (Tu et al., 2001). Despite the fact that survival differences were accounted for in the negative binomial model using a well-established offset method (Bond and Farewell, 2009; Charkha et al., 2013), which assumes a linear cost accumulation trajectory, costs have been shown to accumulate over time as a non-linear step function (Evans et al., 2007). If an AMI patient with acute renal failure died one day following hospital discharge for example, the patient would not have sufficient time exposure to reach the next step function in treatment and corresponding costs within the commu-nity. In this scenario, acute renal failure would appear as a negative cost-driver for follow up post-state AMI care. This work highlights an important limitation within the existing literature and associ-ated methods relassoci-ated to the time-varying non-linear nature of cost and its association with mortality outcomes at the patient level (Stargardt et al., 2013; McClellan et al., 1994; Schreyogg and Stargardt, 2010). Future research that applies novel methods that account for the time-varying nature of healthcare spending is required to more fully elucidate the relationship between co-morbid illness, mortality and the time-dependent nature of AMI healthcare costs at the patient level across the care continuum.
Limitations
A number of limitations warrant consideration. First, the costs presented here necessarily underestimate complete healthcare costs in Canada for elderly AMI patients, as costs for home and long term care were not included in the analysis. Instead this study esti-mated costs based on available data for the three largest categories of spending – hospitals, drugs and physicians (CIHI, 2004). Second, the use of administrative healthcare data allowed only for an examination of direct healthcare costs, rather than a summation of direct and indirect costs associated with total burden of disease. While indirect costs are useful for illustrating the impact of illness on society, direct costs can be equally informative for healthcare decision makers to illustrate opportunity costs for public health-care resources utilized (Boccuzzi, 2003).
Table 3
AMI community and hospital healthcare cost per patient day survived (2008 constant Canadian Dollars).
Pre-state Hospitalization event
Post-state Primary care
cost for AMI care per patient day in community
Hospitalization events for AMI care per patient day in hospital
Primary care cost for AMI care per patient day in community Mean cost per day $3.11 $1,758.58 $6.32 (SD) (2.65) (1047) (14.39) Median cost per day $2.56 $1497.77 $4.67
Abbreviations: AMI (acute myocardial infarction), SD (standard deviation), NA (not available).
Table 4
Cost drivers of care for pre-state, event and post-state costs.
Pre-state Hospitalization event Post-state
RR 95%CI p-val RR 95%CI p-val RR 95%CI p-val
Socio-demographic characteristics
Age 1.000 ns ns 0.993 0.991–0.995 <.0001 0.968 0.966–0.970 <.0001 Sex (male) 1.061 1.027–1.095 0.0003 1.111 1.085–1.138 <.0001 1.046 1.017–1.076 0.0017 Urban patient residence 1.129 1.079–1.180 <.0001 1.059 1.025–1.095 0.0007 1.118 1.075–1.162 <.0001 SES low vs higha
1.026 ns ns 1.035 1.002–1.070 0.0379 0.986 ns ns SES mid vs higha
1.029 ns ns 1.019 ns ns 0.983 ns ns
Co-morbid illnesses at time of AMI hospitalizationb
Shock 1.317 1.207–1.437 <.0001 1.356 1.271–1.446 <.0001 0.839 0.751–0.936 0.0017 Chronic heart failure 1.309 1.262–1.358 <.0001 1.600 1.557–1.645 <.0001 0.945 0.914–0.977 0.0008 Cancer 1.199 1.111–1.295 <.0001 1.119 1.057–1.185 0.0001 0.698 0.650–0.751 <.0001 Cerebrovascular disease 1.214 1.117–1.320 <.0001 1.387 1.304–1.475 <.0001 0.928 ns ns Pulmonary edema 1.046 ns ns 1.181 1.099–1.269 <.0001 1.057 ns ns Acute renal failure 1.198 1.132–1.269 <.0001 1.409 1.350–1.470 <.0001 0.901 0.851–0.954 0.0004 Chronic renal failure 1.446 1.372–1.525 <.0001 1.204 1.157–1.252 <.0001 1.023 ns ns Diabetes with complications 1.528 1.317–1.774 <.0001 1.426 1.275–1.596 <.0001 0.943 ns ns Cardiac dysrhythmias 1.126 1.082–1.171 <.0001 1.306 1.268–1.345 <.0001 1.034 ns ns
Abbreviations:AMI (acute myocardial infarction), SES (socioeconomic status), ns (not significant), RR (incident rate ratio), 95%CI (95 percent confidence interval).
aArea based income methodology based on income distribution in the 2006 Ontario Census data from Statistics Canada. Neighborhood income quintiles were arranged
such that the lowest two income groups formed the ‘low-income’ group, the third and fourth quintiles formed the ‘middle-income’ group, and the fifth quintile formed the ‘high-income’ group.
b
Conclusions
As government healthcare agendas prioritize shifting trends in population aging and the corresponding impact on healthcare spending, there is an ever increasing need to fill the knowledge gap around AMI healthcare costs for the elderly along the contin-uum of care. This study provided a baseline analysis of the direct healthcare costs and cost drivers for AMI across a six-year care continuum in Ontario, Canada that will be critical for informing economic analysis and future decision making about integrated care for AMI among the elderly. The novel costing approach was also useful in identifying a number of new areas of inquiry related to cost drivers along the continuum of care and their role in gener-ating health spending.
Acknowledgements
The data for this study was made available by the Institute for Clinical Evaluative Sciences in Ontario, Canada. DC was funded via the Queen Elizabeth II – Ontario Graduate Scholarship for Science and Technology (QEII-QSST). The project was funded by the Canadian Institute for Health Research.
The views expressed in this paper are solely those of the authors and do not reflect those of Statistics Canada. We thank Claudia Sanmartin of Statistics Canada for her contributions.
References
Agresti, A., 2001. Categorical Data Analysis, second ed. Wiley, New York.
Anderson, T.J., Grégoire, J., Hegele, R.A., Couture, P., Mancini, G.B., McPherson, R., Francis, G.A., et al., 2013. 2012 Update of the Canadian Cardiovascular Society guidelines for the diagnosis and treatment of dyslipidemia for the prevention of cardiovascular disease in the adult. Can. J. Cardiol. 29 (2), 151–167.
Azoulay, A., Pilote, L., Filion, K., Eisenberg, M., 2003. Costs of treatment of acute myocardial infarction in Canadian and US hospitals. Cardiovasc. Rev. Rep. 24 (11).
Bang, H., Zhao, H., 2012. Average cost effectiveness ratio with censored data. J. BioPharm. Stat. 22 (2), 401–415.
Boccuzzi, S., 2003. Indirect health care costs. In: Weintraub, W. (Ed.),Cardiovascular Health Care Economics. Humana Press, USA.
Bond, S., Farewell, V., 2009. Likelihood estimation for a longitudinal negative binomial regression model with missing outcomes. J. R. Soc. Stat. 58, 369–382. Carstairs, S., Keon, W., 2009. Canada’s Aging Population: Seizing the Opportunity. Special Senate Committee on Aging Final Report. Senate Canada, Ontario, Canada. Available from: <http://www.parl.gc.ca/Content/SEN/Committee/402/ agei/rep/AgingFinalReport-e.pdf>. (retrieved online November 1, 2013) Centre for Disease Control (CDC), 2013. Part II – Economic Impact Analysis. Cost of
Illness: The Second of a Five-part Series. Available from: <http://www.cdc.gov/ dhdsp/programs/nhdsp_program/economic_evaluation/Module_II/Podcast_II. pdf> (retrieved online May 2013).
Chapko, M., Liu, C., Perkins, M., Li, Y., Fortney, J., Maciejewski, M., 2009. Equivalence of two healthcare costing methods: bottom-up and top-down. Health Econ. 18 (10), 1188–1201.
Charkha, N., Ghatge, A., Sharma, P., Attar, V., Patil, A., 2013. Estimating risk of mortality from cardiovascular disease using negative binomial regression. Epidemiology 3, 2.
Canadian Institute for Health Information, 2004. DAD Resource Intensity Weights and Expected Length of Stay. Ottawa, Canada.
Canadian Institute for Health Information, 2011a. Health Care in Canada: A Focus on Seniors and Aging. CIHI, Ottawa, Canada.
Canadian Institute for Health Information, 2011b. Canadian Patient Cost Database Technical Document: MIS Patient Costing Methodology. CIHI, Ottawa, Canada. Canadian Institute for Health Information, 2013. Canadian Hospital Reporting Project Tool CRHP. Available from: <http://www.cihi.ca/CIHI-ext-portal/internet/ en/document/health+system+performance/indicators/performance/chrp_ireport_ findings_c> (retrieved online July, 2013).
Daskalopoulou, S.S., Khan, N.A., Quinn, R.R., Ruzicka, M., McKay, D.W., Hackam, D.G., Rabkin, S.W., et al., 2012. The 2012 Canadian Hypertension education program. recommendations for the management of hypertension: blood pressure measurement, diagnosis, assessment of risk, and therapy. Can. J. Cardiol. 28 (3), 270–287.
Evans, C., Crawford, B., 2000. Data collection in prospective economic evaluations: how accurate are the results? Value Health 3 (4), 277–286.
Evans, E., Imanaka, Y., Sekimoto, M., et al., 2007. Risk adjusted resource utilization for AMI patients treated in Japanese hospitals. Health Econ. 16, 347–359.
Feter, R., Shin, Y., Freeman, J., Averil, R., Thompson, J., 1980. Case mix definition by diagnosis related groups. Med. Care 18 (2), 1–53.
Hakkinen, U., Chiarello, P., Cots, F., et al., 2012. Patient classification and hospital costs or care for acute myocardial infarction in nine European countries. Health Econ. 21, 19–29.
Health Council of Canada, 2012. Advancing Integrated Health Care in Canada: Practices that Work. Available from: <http://www.healthcouncilcanada.ca/ content.php?mnu=4&mnu1=34> (retrieved online October 1, 2013).
Heidreneich, P., Trogdon, J., Khavjou, O., Butler, J., Dracup, K., Ezekowitz, M., et al., 2011. Forecasting the future of cardiovascular disease in the United States: a policy statement from the American Heart Association. Circulation 123, 933–944.
Kauf, T., Velzquez, E., Crosslin, D., Weaver, W., Diaz, R., Granger, C., et al., 2006. The cost of acute myocardial infarction in the new millennium: evidence from a multinational registry. Am. Heart J. 15 (1), 206–212.
Kim, J., Lee, E., Lee, T., Sohn, A., 2013. Economic burden of acute coronary syndrome in South Korea: a national study. BMC Cardiovasc. Disord. 13, 55.
Krumholz, H., Chen, J., Murillo, J., et al., 1998. Clinical correlates of in-hospital costs for acute myocardial infarction in patients 65 years of age and older. Am. Heart J. 135, 524–530.
Leatt, P., Pink, G., Guerriere, M., 2000. Towards a Canadian model of integrated care. Healthcare Papers 1, 13–35.
Lewsey, J., Thompson, W., 2004. The utility of the inflated Poisson and zero-inflated negative binomial models. A case study of cross sectional and longitudinal DMF data examining the effect of socio-economic status. Community Dent. Oral Epidemiol. 32, 183–189.
MacAdam, M., 2008. Frameworks of Integrated Care for the Elderly. A Systematic Review. Canadian Policy Research Network. Available from: <https://www. cssnetwork.ca/Resources%20and%20Publications/MacAdam-Frameworks%20for% 20Integrated%20Care%20for%20the%20Frail%20Elderly.pdf> (retreived online Sept 15, 2013).
McClellan, M., McNeil, B., Newhouse, J., 1994. Does more intensive treatment intensity of acute myocardial infarction in the elderly reduce mortality? Analysis using instrumental variables. J. Am. Med. Assoc. 272 (11), 859–866.
Nolte, E., McKee, M., 2008. Caring for People with Chronic Conditions: A Health System Perspective. World Health Organization. Open University Press, Berkshire, England.
Noyes, K., Holloway, R., 2004. Evidence from cost-effectiveness research. NeuroRx 1 (3), 348–355.
O’Brien, J., Patrick, A., Caro, J., 2003. Cost of managing complications resulting from type 2 diabetes mellitus in Canada. BMC Health Serv. Res. 3 (7), 1–11. Ontario Hospital Insurance Plan Schedule of Benefits for Laboratory Services, 1999.
Available from: <http://www.health.gov.on.ca/english/providers/program/ ohip/sob/lab/lab_services_sched_01_19990401.pdf> (retrieved online July,1, 2013).
Rice, D., 2000. Cost of illness studies: what is good about them? Inj. Prev. 6, 177– 179.
Rice, D., Miller, L., 1998. Health economics and cost implications of anxiety and other mental disorders in the United States. Br. J. Psychiatry 173, 4–9.
Roger, V., 2007. Epidemiology of myocardial infarction. Med. Clin. North Am. 9, 537.
Schreyogg, J., Stargardt, T., 2010. The trade-off between costs and outcomes: the case of acute myocardial infarction. Health Serv. Res. 45 (6), 1585–1601.
Smith, E., 2009. The Canadian heart health strategy and action plan. Can. J. Cardiol. 25, 451–452.
Smolderen, K., Bell, A., Lei, Y., et al., 2010. One-year costs associated with cardiovascular disease in Canada: insights from the reduction of atherothrombosis for continued health (REACH) registry. Can. J. Cardiol. 26, e297–e305.
Stargardt, T., Schreyogg, J., Kondofersky, I., 2013. Measuring the relationship between costs and outcomes: the example of acute myocardial infarction in German hospitals. Health Econ.
Stevens, J., 1996. Applied Multivariate Statistics for the Social Sciences, third ed. Lawrence Earlbaum Associates, New Jersey.
Tarride, J., Lim, M., DesMueles, M., et al., 2009. A review of the cost of cardiovascular disease. Can. J. Cardiol. 25, e195–e202.
Tiemann, O., 2008. Variations in hospitalisation costs for acute myocardial infarction – a comparison across Europe. Health Econ. 17, s33–s45.
Tobe, S., Stone, J., Brouwers, M., Bhattacharyya, O., Walker, K., Dawes, M., Genest, J., Grover, S., 2011. Harmonization of guidelines for the prevention and treatment of cardiovascular disease: the C-CHANGE initiative. Can. Med. Assoc. J. 183 (15), e1135–e1150.
Tu, J., Pashos, C., Naylor, D., Chen, E., Normand, S., Newhouse, J., et al., 1997. Use of cardiac procedures and outcomes in elderly patients with myocardial infarction in the United States and Canada. N. Engl. J. Med. 336, 1500–1505.
Tu, J., Austin, P., Walld, R., et al., 2001. Development and validation of Ontario acute myocardial infarction mortality prediction rules. J. Am. Coll. Cardiol. 37, 992– 999.
World Health Organization, 2003. Diet, Nutrition and the Prevention of Chronic Illness. WHO Technical Report Series, Geneva, Switzerland.
World Health Organization, 2011. Global Atlas on Cardiovascular Disease Prevention and Control. WHO, Geneva, Switzerland.
Yazdanyar, A., Newman, A., 2009. The burden of cardiovascular disease in the elderly: morbidity, mortality and costs. Clin. Geriatr. Med. 25, 563.
Young, D., 2003. Management Accounting in Health Care Organizations. Jossey-Bass Publishing, San Francisco, California.
Yusuf, S., Reddy, S., Ounpuu, S., et al., 2001. Global burden of cardiovascular diseases: part I: general considerations, the epidemiological transition, risk factors, and impact of urbanization. Circulation 104, 2746–2755.