1 2 3
Performance Bond Benefit
–
Cost Analysis
4 5 by 6 7 8 9 Lorena Myers 10 (Corresponding Author) 11Department of Civil and Coastal Engineering 12 University of Florida 13 345 Weil Hall 14 P.O. Box 116580 15 Gainesville, FL 32611-6580 16 Telephone #: (352) 392-1033 17 Fax #: (352) 392-9531 18 E-mail: [email protected] 19 20 and 21 22 Fazil T. Najafi, Ph.D. 23 Professor 24
Department of Civil and Coastal Engineering 25 University of Florida 26 345 Weil Hall 27 P.O. Box 116580 28 Gainesville, FL 32611-6580 29 Telephone #: (352) 392-1033 30 Fax #: (352) 392-9531 31 E-mail: [email protected] 32 33 34 35
Submission Date: November 14, 2010 36
37 38 39
Word Count: Abstract 181 40
Text (excluding Abstract) 5, 192 41
Tables (8 x 250) 2, 000 42
Figures (8 x 250) 0 43
TOTAL WORD COUNT: 7, 373 44
45 46
ABSTRACT
1 2
A performance bond provides the assurance that an awarded construction project will be
3
satisfactorily completed in the event that the contractor is unable to complete the project as agreed
4
and the contract is terminated. Passed into law in the late 1800s, performance bonds protect against
5
financial losses.
6
The ability of contractors to provide performance bond has mistakenly been assumed as a
7
guarantee that contractors will perform well on the projects they are awarded. Indications are that
8
there is a need to evaluate the benefits and the costs of using performance bonds. This paper takes a
9
look at the benefit-cost of performance bonds on a national basis.
10
In order to perform the analysis, state construction project data was collected for contract
11
awards from September 2007 to September 2009. The results of the analysis suggest that states that
12
had a small number of defaults, or none at all, did not benefit from having performance bonds, while
13
those states that had numerous defaults did benefit. In conclusion, the results suggest that
14
performance bonds are beneficial to states that experience a large number of defaults.
15 16 INTRODUCTION 17 18 Background 19 20
Using bonds alone does not guarantee that a contractor can perform the work. Bonds protect against
21
financial losses but cannot predict delays and public inconveniences. Whether performance bonds
22
can be replaced by a performance based prequalification system is a research topic worth
23
investigating (1). So far, research has suggests that prequalification had not predicted delays, 24
eliminated public inconvenience, or guaranteed that contractors could perform work. From the
25
prediction standpoint, the value added by a performance based prequalification system is that State
26
Departments of Transportation (DOTs) would be putting to further use the contractor performance
27
information collected by the agencies (2). 28
While the current practice of states is to use performance bonds, an appropriate goal would
29
be to transition to a performance based qualification practice to help ensure completion of projects.
30
To consider transitioning from performance bonds to performance based qualification, the benefits
31
and costs of performance bonds need to be evaluated.
32 33
Research Objectives and Approach 34
35
The objectives are as follows:
36
1. Search literature on current topic of performance bond.
37
2. Collect contract awards data (name of contractor, type of project, cost of awarded project
38
and whether the contractor defaulted on the project) from September 2007 to September
39
2009 from all states.
40
3. For states with defaulted projects, obtain information about the percent complete of each
41
project at the time of default.
42
4. Obtain an estimate of surety performance bond premium cost for projects.
43
5. Categorize projects based on performance bond premium thresholds.
44
6. Apply bond premium to defaulted and all projects.
45
7. Analyze the type and range of projects experiencing the most defaults to see if there is
46
any correlation.
8. Quantify and analyze the possible DOTs benefit-to-cost using the default information by
1
assuming 50 percent of total defaulted project cost is the amount the surety spent for
2
defaulted projects completion for selected states (presented later in Table 7).
3
9. Quantify and analyze the total cost of defaulted projects compared to cost of all projects
4
(presented later in Table 8).
5
10.Conclude whether the benefit/cost ratio supports the use of performance bonds.
6
11.Make suggestions for future research work.
7 8
The research approach is based on the relationship between performance bond and default. The
9
literature review section provides more insight into this relationship.
10 11
LITERATURE REVIEW 12
13
From a historical perspective, the use of performance bonding arose in the American construction
14
industry in the late nineteenth century in an attempt to protect public treasuries against the risk of
15
default on public projects. In response to the financial panic of 1893, the Heard Act was enacted (3), 16
by the United States (U.S.) Congress, and passed in 1894. The Heard Act granted a right of action in
17
the name of the U.S. against a prime contractor and its surety for unpaid labor and materials used in
18
the prosecution of contract work. In 1905, Congress amended the Heard Act by adding the phrase
19
“labor or materials used in construction of any public building or public work.” Noting deficiencies, 20
Congress repealed the Heard Act (4). 21
The Miller Act, enacted in 1935, effectively restated and recodified what had been known as
22
the 1894 Heard Act (5). The Miller Act provides the following: before any contract for construction, 23
alteration or repair of any public building or public work of the U.S. is awarded to any person, such
24
person shall furnish to the U.S. the following bonds (6), both performance and payment bonds for 25
certain contracts in excess of $2, 000, since revised to $100, 000 (5), which shall become binding 26
upon the award of the contract. A contractor shall furnish both performance and payment bonds, with
27
a surety or sureties, satisfactory to the officer awarding such contract and in such amount as he shall
28
deem adequate, for the protection of the U.S. (6). 29
The original act did not permit waiver of the bonding requirements, but certain decisions of
30
the Attorney General and the Comptroller General in the 1930s, coupled with the advent of World
31
War II, highlighted problems with the statute as written and led to a 1941 amendment allowing
32
waivers in certain circumstances. The problems leading to the amendment related to: the definition of
33
“public work”; defense contracts whose number and dollar value were increasing exponentially upon
34
the start of the war; and the surety industry struggling to keep up (5). Congress authorized the 35
waiving of the requirement of performance and payment bonds in connection with certain contracts
36
entered into by the Secretary of Commerce (7). 37
The waiver authority under the Miller Act was originally added to the statute, in 1941, in
38
order to avoid delays on defense contracts due to problems in the surety industry during World War
39
II. These waiver provisions were expanded, in 1955, to authorize waiver of bonding requirements on
40
cost-type contracts awarded by the Department of Defense agencies (5). 41
In 1966, Congress amended the Miller Act to further protect the government and required
42
that a bond issued pursuant to this legislation “specifically provide coverage for taxes imposed by the 43
U.S. which are collected, deducted, or withheld from wages paid by the contractor in carrying out the
44
contract with respect to which such bond is furnished (6). The Miller Act was amended again in 1970 45
to add waiver authority for the Secretary of Transportation in connection with ship construction and
46
repair (5). 47
To understand how performance bonds work, it is important to look at how a bond is
1
formulated. Performance bonds are contracts that create tripartite relationships. There is the
2
“principal” (typically the general contractor) who has assumed a contractual undertaking. There is 3
the “obligee” (typically the project owner, in this case DOTs) that is due the benefits of the
4
principal’s performance. And there is the “surety” who provides the performance bond that 5
secondarily guarantees to the obligee performance of the principal’s contractual undertaking. 6
Performance bonds ensure that, although unfavorable circumstances may arise, the project will be
7
completed (3). 8
Performance bond coverage comes into effect when it is proven that the contractor has indeed
9
legally defaulted. Therefore, to analyze the benefit-cost of performance bonds, it is necessary to take
10
a look at the number of defaults that have occurred during the analysis period of this study. In order
11
to do so, it is necessary to clarify what is meant by the word default. In construction surety law, to
12
constitute a legal default, there must be a material breach or series of material breaches of such
13
magnitude that the obligee is justified in terminating the contract. Usually the principal is unable to
14
complete the project leaving termination of the contract as the obligee’s only option (3). 15
Looking at the current challenges facing DOTs with respect to contract awards to defaulting
16
contractors, there is a need to consider putting checks and balances in place. The United States
17
General Accountability Office (GAO) released a report in April 2009 that mentions contractors, who
18
have defaulted on previous projects, receiving bid awards for which they “qualify”. For example, a 19
$280 million Army munitions contract was awarded to a contractor that had previously been
20
terminated for default on several different contracts. Subsequently this same contractor defaulted
21
under that contract. The contracting officer stated that this information, if available, would have
22
factored into the award decision. This recent awarding of contracts to defaulted contractors highlights
23
the need for information on contract terminations when making contracting decisions. With the
24
government relying on many of the same contractors to provide goods and services across agencies,
25
the need to share information, on a contractor’s past performance, is critical (8). 26
The use of contractor project performance evaluations encompasses the three major aspects
27
of project success: cost, time and quality. Ensuring quality of the final product is ultimately a major
28
reason for implementing performance-based contractor prequalification; its impact on the DOTs
29
quality management program cannot be ignored. Linking a contractor’s past performance to the need 30
for viable and trustworthy contractor quality control programs is possible; even in an environment in
31
which the DOTs must give up much of the traditional control it have in project delivery (1). For 32
additional details not included here see Gransberg and Reimer (1). 33
The Ontario Ministry of Transportation’s (MTO’s) performance-based contractor
34
prequalification program is perhaps the most interesting example. Started in the late 1950’s, it not 35
only provides an incentive for contractors to perform well but also allows the agency to accrue a
36
tangible monetary benefit. With an annual construction program of roughly USD$1.3 billion and 37
average Ontario performance/payment bond costs of 5% of contract cost, the estimated savings 38
to the province is roughly USD$65 million per year in bond costs (1). The current trend is to 39
transition from performance bonds to a performance contractor prequalification based system, such
40
as the one MTO has been using for over 50 years. Seven states (Connecticut, Maryland, Minnesota,
41
Missouri, Utah, Virginia and Wisconsin) are already using an indexing system to rate or rank
42
contractors (9). 43
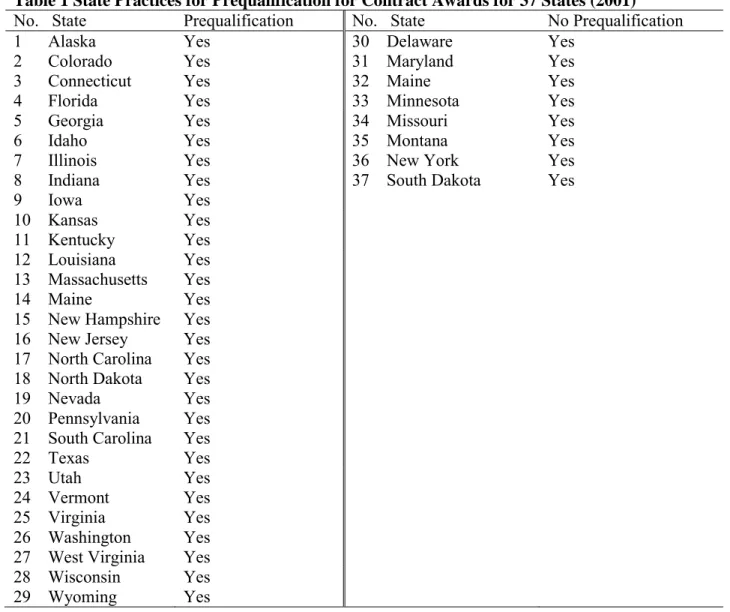
Table 1 below summarizes a 2001 survey that showed most states (29 out of 37 that
44
responded) used contractor prequalification (9). For this research being reported herein, 30 states are 45
evaluated (See the Methodology: Data Collection section for more details on how states are selected).
46
Out of the 37 states listed in Table 1, 23 are included in this research: Alaska, Colorado, Connecticut,
47
Delaware, Georgia, Idaho, Illinois, Indiana, Iowa, Kansas, Maine, Michigan, Minnesota, Montana,
New Jersey, New York, South Carolina, South Dakota, Texas, Washington, West Virginia,
1
Wisconsin and Wyoming. Delaware, Maine, Minnesota, Montana, New York and South Dakota do
2
not have a prequalification system (2). For additional details not included here see Minchin and 3
Smith (2). 4
The 1996 NCHRP Synthesis 190 reports that all states require a bond or the equivalent of a 5
bond at some stage of the qualification process (10). The Surety and Fidelity Association of America 6
(SFAA), a trade association of 450 companies that are licensed to provide surety and fidelity bonds,
7
also reports that all 50 states and the District of Columbia require surety bonds on state and local
8
public works projects (11). 9
10
Table 1 State Practices for Prequalification for Contract Awards for 37 States (2001)
11
No. State Prequalification No. State No Prequalification
1 Alaska Yes 30 Delaware Yes
2 Colorado Yes 31 Maryland Yes
3 Connecticut Yes 32 Maine Yes
4 Florida Yes 33 Minnesota Yes
5 Georgia Yes 34 Missouri Yes
6 Idaho Yes 35 Montana Yes
7 Illinois Yes 36 New York Yes
8 Indiana Yes 37 South Dakota Yes
9 Iowa Yes 10 Kansas Yes 11 Kentucky Yes 12 Louisiana Yes 13 Massachusetts Yes 14 Maine Yes
15 New Hampshire Yes 16 New Jersey Yes 17 North Carolina Yes 18 North Dakota Yes
19 Nevada Yes
20 Pennsylvania Yes 21 South Carolina Yes
22 Texas Yes
23 Utah Yes
24 Vermont Yes
25 Virginia Yes
26 Washington Yes 27 West Virginia Yes 28 Wisconsin Yes
29 Wyoming Yes
12
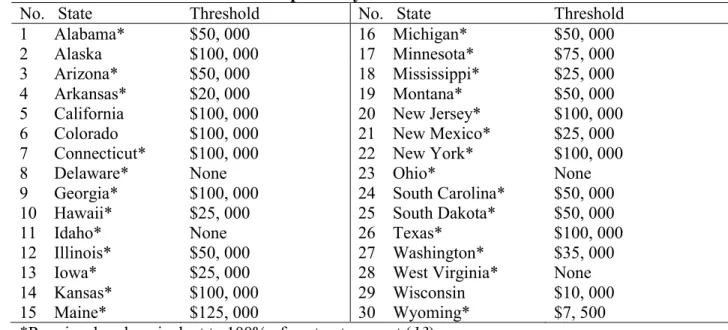
Although both reports mention all states requiring bonds, it is important to take a look at the
13
performance bond practices of the 30 states. Table 2 below shows the performance bond threshold
14
for each state. Above the specified threshold, a performance bond is required. Delaware, Idaho, Ohio,
15
and West Virginia have no thresholds (12). Another source of the performance bond thresholds and 16
requirements is the standard specifications of each state. States requiring a performance bond
17
equivalent to 100 percent of the contract amount are noted.
An interesting question is whether the performance bond is always 100 percent of the
1
contract amount. Seven states gave affirmative responses to the following NCHRP Synthesis 390 2
survey question (21 on pg. 78) “Has your organization ever required less than the full contract 3
amount to be bonded?” (1). The methodology used to evaluate the benefit-cost of performance bond 4
is discussed in the next section.
5 6
Table 2 State Bond Thresholds as Reported by SFAA for 30 Selected States
7
No. State Threshold No. State Threshold
1 Alabama* $50, 000 16 Michigan* $50, 000
2 Alaska $100, 000 17 Minnesota* $75, 000
3 Arizona* $50, 000 18 Mississippi* $25, 000
4 Arkansas* $20, 000 19 Montana* $50, 000
5 California $100, 000 20 New Jersey* $100, 000
6 Colorado $100, 000 21 New Mexico* $25, 000
7 Connecticut* $100, 000 22 New York* $100, 000
8 Delaware* None 23 Ohio* None
9 Georgia* $100, 000 24 South Carolina* $50, 000
10 Hawaii* $25, 000 25 South Dakota* $50, 000
11 Idaho* None 26 Texas* $100, 000
12 Illinois* $50, 000 27 Washington* $35, 000
13 Iowa* $25, 000 28 West Virginia* None
14 Kansas* $100, 000 29 Wisconsin $10, 000
15 Maine* $125, 000 30 Wyoming* $7, 500
*Requires bond equivalent to 100% of contract amount (13). 8 9 METHODOLOGY 10 11 Data Collection 12 13
This section discusses how the research data was collected from the DOTs. Using a questionnaire to
14
get information from the DOTs seemed like a good idea. Raw data was requested instead to minimize
15
errors that could arise from misinterpretation of terminologies. The DOTs were contacted via email,
16
phone or postal mail. Data requested, from September 2007 to September 2009, for all awarded
17
public transportation construction contracts, included the name of the contractor, type of project, the
18
amount awarded for the project, and whether the contractor defaulted on the project. One state did
19
not respond to the request. Others responded but did not provide the data. There were some states
20
that responded and provided data but not in the entirety (four parts) requested.
21
While collecting the data, some DOTs (Arizona DOT) provided the data without a processing
22
charge, since the research is for academic purposes. Others (Texas and California) responded quickly
23
and the information they provided exceeded that which was requested. Some charged for processing
24
the data based on the volume of information being requested. If the requested volume was below a
25
threshold, there was no processing fee. For some states, simply sending an email request was not
26
sufficient. An official request, via a hard copy of the form, had to be made to the DOT based on the
27
Public Record Access. Some states saw requesting this type of information as sensitive and were a
28
little reluctant to release it, while others such as Alaska, California, Colorado, Georgia, Idaho,
29
Mississippi, New Jersey and Texas saw the information requested as public. Colorado, Georgia,
30
Idaho, Mississippi and New Jersey all have their contract information accessible on their website. All
DOTs required a written request for information. The subsection, that follows, discusses data
1
organization for analysis.
2 3
Data Organization
4 5
In the public work sector that is specifically controlled by the DOTs, projects can be federal, state or
6
combined federal and state. Other categories could also include bridges, electrical, maintenance,
7
clearing, roadway resurfacing, roadway rehabilitation, and, from the MTO’s model: road, structures, 8
electrical, structural coating, and general maintenance (1). The data could be categorized in many 9
different ways. Each state has its own data structure of projects. This was evident from the data files
10
obtained. A state, having its highway road data categorized into bridge or not, questioned the data
11
type being requested in the email. That state did not include bridges in the data based on the response
12
given to exclude bridges. Subsequent states with that question were asked to include bridges. When
13
collecting the data, it was inevitable that the data would be categorized.
14
How? That is the difficult question, that led to other questions (Should a regression analysis
15
be done? If so, which way would be best to categorize the data?), that had to be answered. The
16
objective was to simplify the analysis. The research time frame and analyzing 30 states led to the
17
Benefit-Cost Ratio analysis; which represents economic evaluations of alternative resource use and
18
measure costs where outcomes can be measured in terms of their monetary values (14). 19
The first step in the analysis was to obtain an estimate of the surety performance bond
20
premium. Many surety reports indicate that surety bonds, a dependable, proven, and reliable
21
protection against contractor failure, cost between one and three percent of the total contract price.
22
On very large projects, surety bonds may cost less than one percent (15). Likewise, the SFAA reports 23
the cost of the performance bond one-time premium as typically ranging from half to two percent of
24
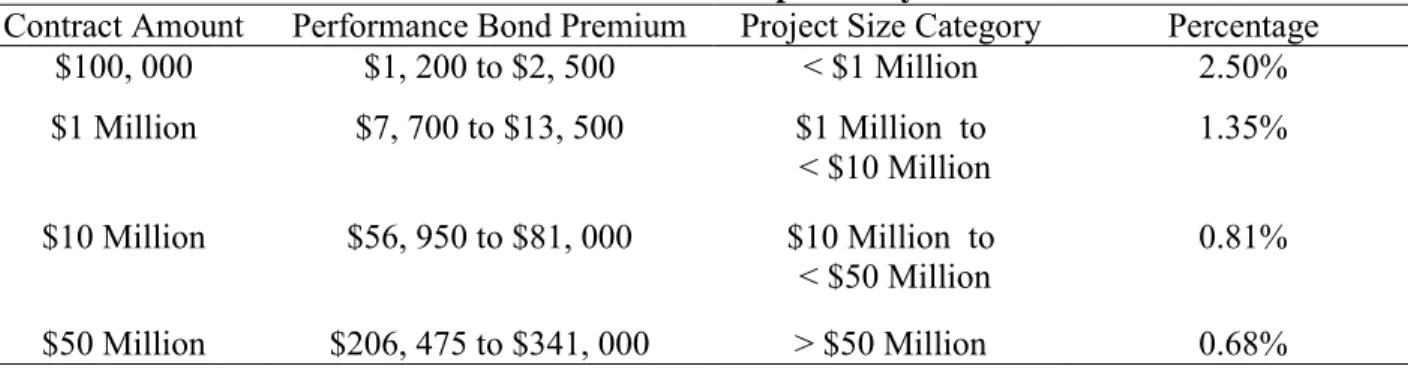
the contract amount. The information gathered from SFAA places the projects into four categories as
25
shown in Table 3 below, in terms of performance bond premium (16). 26
27
Table 3 One-time Performance Bond Premium as Reported by SFAA
28
Contract Amount Performance Bond Premium Project Size Category Percentage
$100, 000 $1, 200 to $2, 500 < $1 Million 2.50% $1 Million $7, 700 to $13, 500 $1 Million to < $10 Million 1.35% $10 Million $56, 950 to $81, 000 $10 Million to < $50 Million 0.81% $50 Million $206, 475 to $341, 000 > $50 Million 0.68% 29
Table 3 shows performance bond premium for various contract amounts. The upper limit of
30
the bond category with corresponding monetary value is use to estimate a percentage. The contract
31
amount and performance bond premium (column 1 and 2 respectively) were given in the surety
32
report. Values in the “Project Size Category” (column 3) are added in order to calculate bond
33
premium cost for all projects (13), and “Percentage” values (column 4) are calculated using the upper 34
limit performance bond premium (column 2) divided by the contract amount (column 1) and
35
multiplied by 100 percent.
36
An alternative to establish percentages, that are not too different from those in Table 3, is by
37
dividing the averages of premiums (column 2) by the contract amounts (column 1), yielding results
38
of 3.70 %, 1.06 %, 0.69 %, and 0.55 %. The cost of a performance bond premium will vary because
it is dependent on the size, type of the project and the contractor’s bonding capacity (16). Note in this 1
same column (Percentage), the percentage decreases as the size of the project increases. An
2
explanation follows:
3
It is not uncommon in today’s construction environment for projects to exceed $500 million 4
or even $1 billion. Many sureties prefer to spread their risk by having project owners break up a large
5
megaproject into multiple large projects (to the extent they can be broken up), notes Mike Cusack,
6
senior vice president, managing director and operations board member, Aon Construction Services
7
Group. Bill Marino, chairman and CEO, Allied North America, says, “From the perspective of the 8
owner, joint ventures and the corresponding co-surety structure necessary to support the larger bond
9
penal sums, are beneficial. In the event that one of the joint venture’s contracting entities fails, it 10
becomes the responsibility of their partners to assume their contractual responsibility (17).” This 11
seems to indicate that sureties have analyzed how to provide the coverage necessary to provide
12
performance bonding in an economical way while minimizing problems that would typically arise.
13
Another organization of members, founded in 1985, dedicated to providing the most
14
productive and cost-effective public service is National Council for Public-Private Partnerships
15
(NCPPP). These contractual arrangements, between government entities and private companies for
16
the delivery of services or facilities, are used for water/wasterwater, transportation, urban
17
development, and delivery of social services, to name a few areas of application. The average
18
American city works with private partners to perform 23 out of 65 municipal services. Governments
19
traditionally realize cost savings of 20 to 50 percent when the private sector is involved in providing
20
services (18).” Some DOTs have PPPs incorporated in their transportation program. For example, 21
Washington Department of Transportation (WSDOT) has a Transportation Innovative Partnership
22
(TIP) program, which was authorized by the legislature in 2005 (19). Another DOT with a similar 23
program is the Texas Department of Transportation. The number of DOTs having PPPs programs
24
needs to be research. The upcoming section provides and discusses the results of the methodology
25
use to analyze the benefit-cost of performance bonding.
26 27
ANALYSIS, RESULTS AND DISCUSSION 28
29
Analysis 30
31
In order to determine the value to the agency of using performance bonds during the period
32
September 2007 to September 2009, an analysis is done of the benefit-cost of having performance
33
bonds in four states with defaulted projects (identified in more detail later). Added information, also
34
presented later, includes the percentage complete of projects when defaulted as well as the
35
percentage of defaulted contractors to the total number of contractors. To begin the analysis, the
36
percentage cost of the performance premium (Table 3, column 4) is applied to all 30 states (Table 4),
37
during the two-year analysis period (13). 38
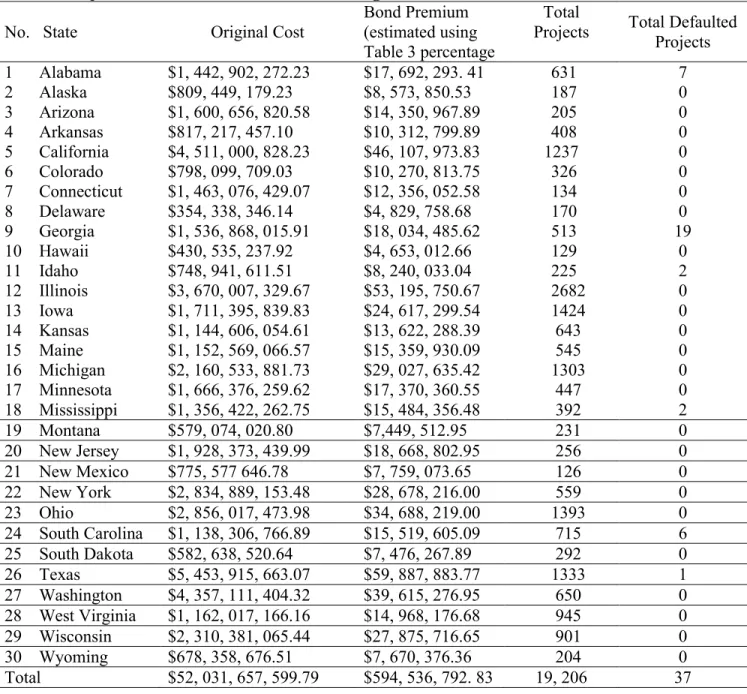
Table 4 below shows the original cost of all projects, the estimated cost of bond premium to
39
the surety, the total number of projects and defaulted projects for each of the 30 states. The total cost
40
of all projects, for the last two years, is $52, 031, 657, 600and total estimated performance bond
41
premium is $595, 000, 000or an equivalent of 1.14 percent of the total project costs. MTO’s 42
percentage is 5 (1). Note, in the last two columns of Table 4, a total of 37 projects were defaulted out 43
of the 19, 206 projects awarded.
44 45 46 47
Table 4 Project Data Collected for 30 States during 2007 – 2009
1
No. State Original Cost
Bond Premium (estimated using Table 3 percentage
Total
Projects Total Defaulted Projects 1 Alabama $1, 442, 902, 272.23 $17, 692, 293. 41 631 7 2 Alaska $809, 449, 179.23 $8, 573, 850.53 187 0 3 Arizona $1, 600, 656, 820.58 $14, 350, 967.89 205 0 4 Arkansas $817, 217, 457.10 $10, 312, 799.89 408 0 5 California $4, 511, 000, 828.23 $46, 107, 973.83 1237 0 6 Colorado $798, 099, 709.03 $10, 270, 813.75 326 0 7 Connecticut $1, 463, 076, 429.07 $12, 356, 052.58 134 0 8 Delaware $354, 338, 346.14 $4, 829, 758.68 170 0 9 Georgia $1, 536, 868, 015.91 $18, 034, 485.62 513 19 10 Hawaii $430, 535, 237.92 $4, 653, 012.66 129 0 11 Idaho $748, 941, 611.51 $8, 240, 033.04 225 2 12 Illinois $3, 670, 007, 329.67 $53, 195, 750.67 2682 0 13 Iowa $1, 711, 395, 839.83 $24, 617, 299.54 1424 0 14 Kansas $1, 144, 606, 054.61 $13, 622, 288.39 643 0 15 Maine $1, 152, 569, 066.57 $15, 359, 930.09 545 0 16 Michigan $2, 160, 533, 881.73 $29, 027, 635.42 1303 0 17 Minnesota $1, 666, 376, 259.62 $17, 370, 360.55 447 0 18 Mississippi $1, 356, 422, 262.75 $15, 484, 356.48 392 2 19 Montana $579, 074, 020.80 $7,449, 512.95 231 0 20 New Jersey $1, 928, 373, 439.99 $18, 668, 802.95 256 0 21 New Mexico $775, 577 646.78 $7, 759, 073.65 126 0 22 New York $2, 834, 889, 153.48 $28, 678, 216.00 559 0 23 Ohio $2, 856, 017, 473.98 $34, 688, 219.00 1393 0 24 South Carolina $1, 138, 306, 766.89 $15, 519, 605.09 715 6 25 South Dakota $582, 638, 520.64 $7, 476, 267.89 292 0 26 Texas $5, 453, 915, 663.07 $59, 887, 883.77 1333 1 27 Washington $4, 357, 111, 404.32 $39, 615, 276.95 650 0 28 West Virginia $1, 162, 017, 166.16 $14, 968, 176.68 945 0 29 Wisconsin $2, 310, 381, 065.44 $27, 875, 716.65 901 0 30 Wyoming $678, 358, 676.51 $7, 670, 376.36 204 0 Total $52, 031, 657, 599.79 $594, 536, 792. 83 19, 206 37 2
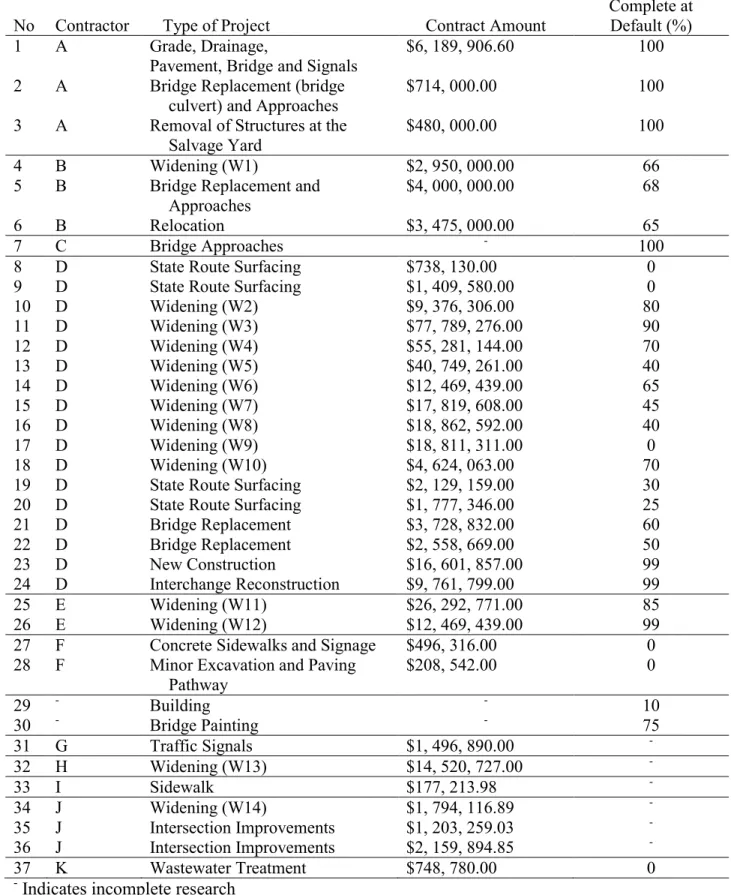
Table 5 below provides information on defaulted contracts (contracts include the state’s 3
criteria for defaults). The contractor (for privacy, the name is replaced with an alphabetic character),
4
the type of project defaulted, the contract award amount and the approximate complete of the project
5
at the time of default expressed as a percentage, are listed. The type of project, experiencing the
6
highest number of defaults, is construction for roadway widening. Also, the highest number of
7
defaults that occurred from any one contractor, Contractor D, is 17. The source of the contract
8
amount (column 3) was either directly from the DOT or the state’s website. 9
For the purposes of this research, projects that qualify as defaulted projects refer to roadway
10
construction project that also qualify under the state's definition of default. Based on this, four states
11
out of the six qualified as candidates for the benefit-cost analysis.
12 13 14
Table 5 Defaulted Project Data Identified by Contractor from 6 States during 2007 – 2009
1
No Contractor Type of Project Contract Amount
Approximate Complete at Default (%)
1 A Grade, Drainage,
Pavement, Bridge and Signals
$6, 189, 906.60 100
2 A Bridge Replacement (bridge
culvert) and Approaches
$714, 000.00 100
3 A Removal of Structures at the Salvage Yard
$480, 000.00 100
4 B Widening (W1) $2, 950, 000.00 66
5 B Bridge Replacement and
Approaches
$4, 000, 000.00 68
6 B Relocation $3, 475, 000.00 65
7 C Bridge Approaches - 100
8 D State Route Surfacing $738, 130.00 0
9 D State Route Surfacing $1, 409, 580.00 0
10 D Widening (W2) $9, 376, 306.00 80 11 D Widening (W3) $77, 789, 276.00 90 12 D Widening (W4) $55, 281, 144.00 70 13 D Widening (W5) $40, 749, 261.00 40 14 D Widening (W6) $12, 469, 439.00 65 15 D Widening (W7) $17, 819, 608.00 45 16 D Widening (W8) $18, 862, 592.00 40 17 D Widening (W9) $18, 811, 311.00 0 18 D Widening (W10) $4, 624, 063.00 70
19 D State Route Surfacing $2, 129, 159.00 30
20 D State Route Surfacing $1, 777, 346.00 25
21 D Bridge Replacement $3, 728, 832.00 60 22 D Bridge Replacement $2, 558, 669.00 50 23 D New Construction $16, 601, 857.00 99 24 D Interchange Reconstruction $9, 761, 799.00 99 25 E Widening (W11) $26, 292, 771.00 85 26 E Widening (W12) $12, 469, 439.00 99
27 F Concrete Sidewalks and Signage $496, 316.00 0
28 F Minor Excavation and Paving
Pathway $208, 542.00 0 29 - Building - 10 30 - Bridge Painting - 75 31 G Traffic Signals $1, 496, 890.00 - 32 H Widening (W13) $14, 520, 727.00 - 33 I Sidewalk $177, 213.98 - 34 J Widening (W14) $1, 794, 116.89 - 35 J Intersection Improvements $1, 203, 259.03 - 36 J Intersection Improvements $2, 159, 894.85 - 37 K Wastewater Treatment $748, 780.00 0
- Indicates incomplete research
2 3
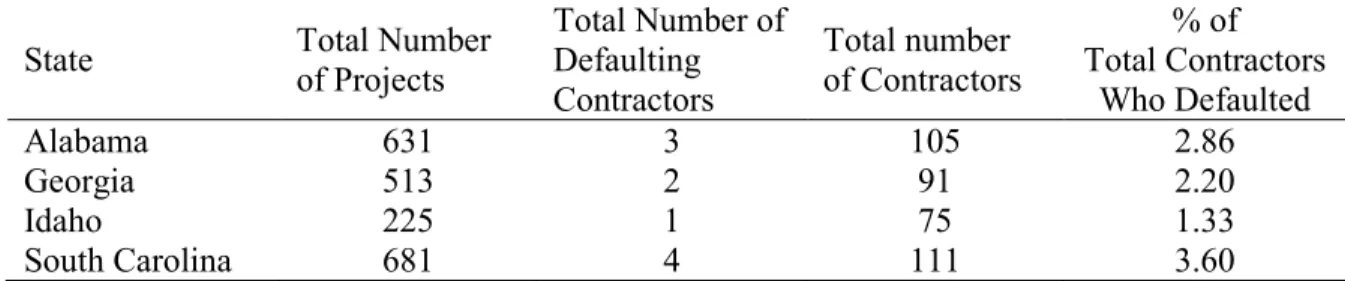
Table 6 shows default project data for four states. The total number of defaulted contractors;
1
contractors; and projects; as well as percentage of defaulted contractors; are listed. The percentage
2
values (column 5) are derived using the total number of defaulted contractors (column 3) divided by
3
the total number of contractors (column 4) and multiplied by 100 percent.
4
For Alabama, three contractors (two contractors defaulted 3 projects each and one contractor
5
1 project) defaulted on 7 projects (refer to Table 4 above). Looking at Georgia, two contractors (one
6
contractor defaulted 17 projects and the other 2 projects) defaulted on 19 projects. For Idaho, one
7
contractor defaulted on 2 projects. Finally, South Carolina had four contractors (three contractors
8
defaulted 1 project each and one contractor 3 projects) defaulted on 6 projects. It is not uncommon
9
for one contractor to have many projects. Alabama’s highest number of contract awards to one 10
contractor is 48 projects; while Georgia, Idaho and South Carolina’s are 102, 18 and 69 respectively. 11
12
Table 6 Defaulted Project Data with Percent of Defaulted Contractors during 2007 – 2009
13
State Total Number of Projects
Total Number of Defaulting Contractors Total number of Contractors % of Total Contractors Who Defaulted Alabama 631 3 105 2.86 Georgia 513 2 91 2.20 Idaho 225 1 75 1.33 South Carolina 681 4 111 3.60 14
In developing Table 7 below, the total cost of defaulted projects for each of the four states
15
(column 2) is divided by half to get an estimated amount (column 3), representing a benefit to the
16
DOT; assuming the surety pays this amount to complete projects to simplify the analysis. SFAA
17
reports that sureties have paid more than $11 billion on contractor defaults since 1994. Half of that
18
was paid between 2002 and 2005 (20). The total performance bond premium cost for the defaulted 19
projects (13) and the Benefit/Cost (B/C) ratio of performance bonds are also listed in Table 7. 20
The B/C ratio (column 5) is obtained by dividing the values in the “50% of Total Cost of 21
Defaulted Projects” (column 3), which is a benefit to the state, by the values in the “Total Cost of 22
Defaulted Projects Bond Premiums” (column 4), which is a cost to the state. 23
24
Table 7 Defaulted Project Data Benefit-Cost Analysis for Selected States during 2007 – 2009
25
State Total Cost of Defaulted Projects
50% of Total Cost of Defaulted Projects (B) Total Cost of Defaulted Projects Bond Premiums (C) Benefit/Cost (B/C) Ratio for State Alabama $17, 598, 906. 60 $8, 799, 453.30 $17, 692, 293.41 0.50 Georgia $332, 347, 230.00 $166, 173, 615.00 $18, 034, 485.62 9.21
Idaho $704, 858.00 $352, 429.00 $8, 240, 033. 04 0.04
South Carolina $7, 974, 633.78 $3, 987,316.89 $14, 666, 964.23 0.27
26
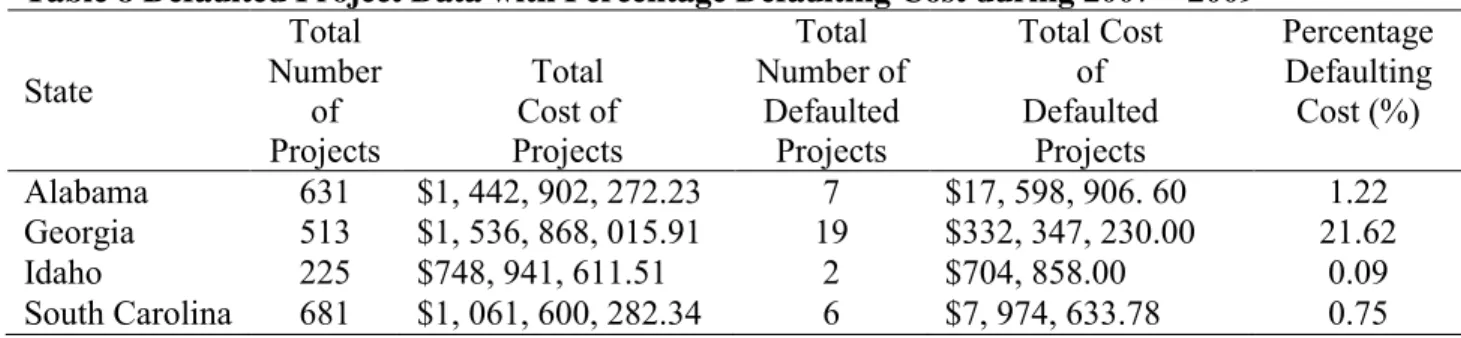
Table 8 below shows the total number of projects (refer to Table 4), total cost of projects,
27
total cost of defaulted projects, and the percentage defaulting cost. The value of “Percentage 28
Defaulting Cost” (column 6) is obtained by dividing the value of “Total Cost of DefaultedProjects” 29
(column 5) by the value of “Total Cost of Projects” (column 3) and multiplying by a 100 percent. 30
31 32
Table 8 Defaulted Project Data with Percentage Defaulting Cost during 2007 – 2009 1 State Total Number of Projects Total Cost of Projects Total Number of Defaulted Projects Total Cost of Defaulted Projects Percentage Defaulting Cost (%) Alabama 631 $1, 442, 902, 272.23 7 $17, 598, 906. 60 1.22 Georgia 513 $1, 536, 868, 015.91 19 $332, 347, 230.00 21.62 Idaho 225 $748, 941, 611.51 2 $704, 858.00 0.09 South Carolina 681 $1, 061, 600, 282.34 6 $7, 974, 633.78 0.75 2
Results and Discussion 3
4
From the Table 7 results, Georgia is the only state where the benefits outweigh the costs. In the other
5
three states, the sureties made a profit. Sureties are in business for the money and deserve to make
6
some profit in view of the risk they are taking and the service they provide. But the amount of profit
7
they are making, especially at the expense of the DOTs that have few or no defaults, is simply
8
staggering. It shows that there is a need to seriously think about replacing performance bonds with
9
another system, such as the Ontario Model in Synthesis 390 (1). 10
To summarize Tables 7 and 8, Alabama’s B/C ratio is 0.50 and percentage defaulting cost is 11
1.22. Georgia’s B/C ratio is 9.21 and percentage defaulting cost is 21.62. Idaho’s B/C ratio is 0.04 12
and percentage defaulting cost is 0.09. South Carolina’s B/C ratio is 0.27 and percentage defaulting 13
cost is 0.75. When benefits exceed the costs, the ratio is greater than 1, and the use of performance
14
bonds can be viewed as being beneficial.
15
While Table 7 gives B/C ratios for the states; it is a simple matter to calculate B/C ratios from
16
the sureties' viewpoint as they are the inverse of the states' B/C ratios. A state’s B/C of 0.50 translates 17
to a surety B/C of 2.0. In other words, if benefits to the state are 1/2 of costs, then costs to the state
18
(which are benefits to the surety) are twice the expenses to the surety. The B/C ratios from the
19
viewpoint of the surety are 2 (AL), 0.11 (GA), 25 (ID), and 3.70 (SC). Of course, additional
20
administrative management costs to the surety for finishing defaults projects decrease the surety B/C
21
somewhat.
22
The results, therefore, indicate that during the 2-year analysis period, Alabama, Idaho and
23
South Carolina’s requirements, for performance bonding (which includes the state’s criteria for 24
defaulting), are not beneficial. For Georgia, the use of performance bonds is beneficial primarily
25
because that state had a relatively large number of defaults for some unidentified reason.
26 27
CONCLUSIONS 28
29
The Benefit-Cost (B/C) analysis, because of the simplicity it provides in getting a ball park figure in
30
a short time frame, is useful to compare the alternatives of having performance bonds to not having
31
any at all. The September 2007 to September 2009 analysis period illustrates that the use of
32
performance bonding, in Alabama, Idaho, and South Carolina, is not beneficial. Also, for the
33
remaining 26 states, the use, of performance bonds, is not beneficial. For Georgia, the only state
34
where this is true, the B/C analysis indicates having performance bonds as beneficial. However, the
35
conclusion should not be made that Georgia is a “winner.” Certainly, having a relatively large 36
number of defaulted projects is not the state's goal. In addition, sureties might well raise the cost of
37
premiums on Georgia’s projects based on that state’s recent history. 38
A B/C ratio greater than 1 can be viewed as the use of performance bonds having been
39
beneficial. Although no specific B/C ratio is established, states that have very low or high B/C ratios
are encouraged to evaluate their performance bond criteria and take a look at the practices of those
1
states with B/Cs that are a little over 1. A very high B/C indicates that many defaults are occurring. A
2
very low B/C indicates little or no defaults are occurring therefore the use of performance bonding
3
should be evaluated. The decision of whether to use performance bonds involves risk. States,
4
therefore, should evaluate the risks involved with projects and make a decision based on that as to
5
whether performance bonds would be required or not.
6
Although no analysis is done on some other aspects, it is interesting to note from the data
7
collected that the project type experiencing the highest number of defaults is roadway widening (14
8
out of 37), and the most projects defaulted by one contactor is 17. There is reason to believe that the
9
contractor probably had a good past performance record and probably went bankrupt all at once
10
resulting in numerous defaulted projects.
11
States that experience defaults benefit from having performance bonding. If little or no
12
defaults occur in a state, no benefit is seen. In light of this, this research is not suggesting eliminating
13
performance bonding. DOTs are encouraged to evaluate the risks involved with using or not using
14
performance bonds for projects and make a decision based on that.
15 16
FUTURE WORK 17
18
For the benefit-cost of performance bonds to be more fully and better analyzed, more detailed
19
information of the benefits and costs to the DOT, contractor and surety need to be collected.
20
Categorizing projects into, for example, duration of projects, types of projects (e.g. roadway
21
surfacing roadway preventative maintenance, and so on), types of funding (federal, state or
22
combined), would help to give a clearer picture of which projects are problematic and would require
23
performance bonding. Future data collection and analysis efforts could also: 1) identify contractors
24
who go bankrupt under one name, later resurface under a new name for business, and are
25
subsequently awarded projects after having a history of poor performance; and 2) evaluate defaults
26
between the years 2002 and 2005, since the surety industry lost half of the total money spent on
27
defaults since 1994 during that time period (20); 3) determine the actual cost of dealing with surety, 28
delays, and so on over and beyond what the contract may have cost and in comparison to the bond
29
cost; 4) determine the cost-effectiveness of these bonds – which are required by state law; 5)
30
investigate the applicability to Public-Private Partnerships and the number of DOTs having PPPs
31
programs; 6) how prequalification should be sufficient and is a lot cheaper than performance
32
bonding.
33
In addition, suggestions for future research for performance bond cost-effectiveness analysis
34
found in Synthesis 390 include: 1) quantifying the cost of performance bonding on a national basis 35
and compare it with a rigorous performance-based contractor prequalification process based on the
36
Ontario Model; 2) analyzing contractor default rates on a state-by-state basis and seek to identify
37
those types of public transportation projects that were at the most and least risk of default; and 3)
38
developing an algorithm to adjust a good contractor’s performance bonding requirements in the event 39
the DOT choose to implement the algorithm (1). 40
41
ACKNOWLEDGMENTS 42
43
The technical support of the DOTs is recognized for providing the necessary data to make the work
44
possible. Also acknowledged is the support of Mr. Peter Kopac, former Federal Highway
45
Administration official, for providing insight, direction and an alternative analytical approach to data
46
interpretation; Dr. Mang Tia, University of Florida Professor, for guiding and encouraging me to
keep focus on what is important; and Dr. William Myers and those who provided help in small, but 1 significant ways. 2 3 REFERENCES 4
1. Gransberg, D. and Reimer, C. NCHRP Synthesis 390: Performance-Base Contractor 5
Prequalification, http://onlinepubs.trb.org/onlinepubs/nchrp/nchrp_syn_390.pdf. 6
Transportation Research Board. Accessed date July, 2009.
7
2. Minchin Jr., R. E. and Smith, G. R. Quality-Based Performance Rating of Contractors 8
Prequalification and Bidding Purposes, 9
http://onlinepubs.trb.org/onlinepubs/nchrp/nchrp_w38.pdf. Transportation Research Board.
10
Accessed date July, 2009.
11
3. American Bar Association. The Law of Performance Bonds. Chicago, Illinois. 2009, 2nd Edition, 12
pp. 3-5, 22.
13
4. Luckey, J. and Allman, A. Overview of the Miller Act Subcontractor Protection in Federal 14
Projects. http://stuff.mit.edu/afs/sipb.mit.edu/contrib/wikileaks-crs/wikileaks-crs-reports/97-15
751.pdf. United States Congressional Research Service, American Law Division. Accessed date
16
November, 2009.
17
5. Wittie, P.H. Unpaid Ship Repair Subcontractors and Miller Act Waivers: Time for a Change?, 18
The Procurement Lawyer, Spring 2007, at 9, http://www.obblaw.com/pdf/PatArticle3.pdf. 19
American Bar Association. Accessed date January, 2010.
20
6. American Bar Association. The Law of Performance Bonds. Chicago, Illinois. 1999, 1st Edition, 21
pp. 3, 7.
22
7. United States Congress House Committee on the Judiciary. Amending the Act of April 29, 1941, 23
to authorize the waiving of the requirement of performance and payment bonds in connection 24
with certain contracts entered into by the Secretary of Commerce. Washington, D.C. 1970. 22 p. 25
8. United States General Accountability Office. Federal Contractors: Better Performance 26
Information Needed to Support Agency Contract Award Decisions. 27
http://www.gao.gov/new.items/d09374.pdf. Accessed date August, 2009.
28
9. Wisconsin Department of Transportation. Transportation Synthesis Report: Contractor 29
Prequalification Quality-Based Rating, 30
http://on.dot.wi.gov/wisdotresearch/database/tsrs/tsrcontractorprequalification.pdf. Accessed
31
date July, 2009.
32
10.Thomas, H. and Smith, G. NCHRP Synthesis 190: Criteria for Qualifying Contractors for 33
Bidding Purposes, http://books.google.com/books?id=zG-34 SwPbizbwC&pg=PA19&lpg=PA19&dq=surety+and+dots+require+performance+bonds&so 35 urce=bl&ots=-pBlLQ2yG4&sig=TVC9hUdUWHWoDAqaKdrwWMidA-36 U&hl=en&ei=0PTwSpC1CcXQ8QazwsD0CA&sa=X&oi=book_result&ct=result&resnum 37 =1&ved=0CBAQ6AEwAA#v=onepage&q=surety%20and%20dots%20require%20perform 38
ance%20bonds&f=false. Transportation Research Board. Accessed date November, 2009.
11.The Surety and Fidelity Association of America. Ohio HB 1 – The State Budget Hurts Small and 1
Emerging Contractors and Puts State Taxpayers and Laborers at Risk, 2
http://www.surety.org/GovRel/OhioHB1.pdf. Accessed date October, 2009.
3
12.The Surety and Fidelity Association of America. State Bonds Thresholds, 4
http://www.surety.org/GovRel/StateBondThresholds.pdf. Accessed date October, 2009.
5
13.Myers, L. Performance Bond Cost-Effectiveness Analysis. Department of Civil and Coastal 6
Engineering, University of Florida. Gainesville, FL. 2009. 68 p.
7
14. Levin, H. M. Cost-effectiveness Analysis,
8
http://www.unioldenburg.de/zef/cde/econ/readings/levin95.pdf. Accessed date May, 2010.
9
15.Associated Insurance Agency. The Importance of Surety Bonds in Construction, 10
http://www.aiabonds.com/Misc/Default.aspx?EditId=65&ParentId=61. Accessed date
11
November, 2009.
12
16.Surety Information Office. Contract Surety Bonds: Protecting Your Investment, 13
http://www.sio.org/html/protectinvest.html. The Surety and Fidelity Association of America.
14
Accessed date October, 2009.
15
17.Surety Information Office. 2007 Surety Market Report: Rising to the Occasion, 16
http://www.sio.org/pdf/enr_07.pdf. The Surety and Fidelity Association of America. Accessed
17
date October, 2009.
18
18.The National Council for Public-Private Partnerships. Top Ten Facts About PPPs, 19
http://www.ncppp.org/presskit/topten.shtml. Accessed date November, 2010. 20
19. Washington Department of Transportation. Transportation Innovative Partnership (TIP) 21
Program, http://www.wsdot.wa.gov/Funding/Partners/tipp.htm. Accessed date November, 22
2010. 23
20.Associated Builders and Contractors. 2008 Surety Market Overview: The Value of Surety in 24
Today’s Challenging Construction Economy,
25
http://www.constructionexec.com/Issues/November_2008/Features2.aspx. Accessed date
26
October, 2009.
27 28