Remnant Coal Detection System for Coal Train Wagons C Hargrave, J Thompson, D Hainsworth
REMNANT COAL DETECTION SYSTEM FOR COAL TRAIN WAGONS
Chad Hargrave (B.Eng.), Jeremy Thompson (B.Eng.), David Hainsworth (PhD)
CSIRO Australia – Division of Earth Science and Resource Engineering 1 Technology Court, Pullenvale, Queensland 4069 Australia
Chad.Hargrave@csiro.au
SUMMARY
The paper describes an automatic system, developed by the Commonwealth Scientific and Industrial Research Organisation (CSIRO) of Australia, to detect and quantify remnant coal (carryback) that is left in coal wagons after dumping at coal terminal facilities. A two-year carryback detection project included software development, sensor selection and testing, pre-site trials at a train yard in Brisbane Australia, and site installation at the R G Tanna coal terminal in Gladstone together with an extended site trial of the technology under normal production conditions. The system uses scanning laser technology to build up a three dimensional profile of the interior of each coal wagon with anomalies associated with coal carryback being automatically detected using algorithms developed by CSIRO. The success of the initial trials is attested to by the fact that the system is now being further developed in conjunction with the port authority in preparation for commercialisation.
1 INTRODUCTION
Remnant coal left in coal wagons after dumping (known as carryback) is a major problem for coal terminals, rail operations and coal mines [1]. Carryback is responsible for reducing wagon capacity for future loading, causing cross-contamination of coal types, increasing coal dust pollution in population centres near train lines and in some cases causing derailments due to spillage of remnant coal onto the tracks.
Effective management of carryback is thus a high priority with clear benefits in terms of productivity, safety and environmental control. The first requirement for effective control of carryback is a reliable and accurate system that can detect and quantify the level of post-dump remnant coal in coal wagons. A project to develop such a detection system was sponsored by the Australian Coal Association Research Program (ACARP) and was led by CSIRO with assistance from Queensland Rail (QR) and the Gladstone Ports Corporation (GPC) as the first step towards a comprehensive carryback management system. The system was designed with the following key requirements:
• Detect coal deposits in a wagon without a human operator
• Estimate the volume of each coal deposit to determine if cleaning is necessary
• Identify and record the carryback contained in each wagon, as well its location within that wagon
A system to address these requirements was developed over the course of a two year project, and tested at a coal terminal in Gladstone, Queensland. The system uses scanning laser technology to build up a three dimensional profile of the interior of each coal wagon. These laser profiles provide the raw data for the CSIRO carryback detection algorithms which identify the location and volume of individual coal deposits, along with the position of the deposit within the wagon interior.
The system has proven to be very successful for detecting, locating and quantifying remnant coal, and has been used to complete an extensive survey of carryback occurrence. Based on this research prototype a robust commercial detection system is now being developed in conjunction with the GPC. Further research into an automated cleaning system has also commenced.
2 BACKGROUND
2.1 The Carryback Problem
Carryback is a major problem for the coal industry in Australia, with serious safety, productivity and environmental consequences. From a safety perspective the major risk caused by carryback is the possibility of train derailments due to spillage of coal onto the tracks. Production penalties are
incurred due to both direct effects such as derailments (or unwanted system down-time to allow for rail cleaning) and also to the consequences of coal cross-contamination, when poorer quality coal is mixed with a higher grade product. This mixing can lead to contractual penalties if the grade of the coal delivered to a customer fails to meet the mine’s export specification. This also has a deleterious effect on the miner’s reputation as a reliable supplier. Finally, the residual coal that is spilled onto rails or that remains in unloaded wagons is prone to drying and dispersal as fine coal dust, which is a major environmental and health issue for towns in the coal mining regions of Australia.
2.2 Coal Unloading and Carryback
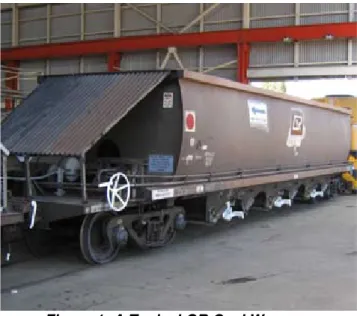
The doors of a typical QR coal wagon (Figure 1) are a Downer EDI-designed system that enables automatic belly-dumping; the doors are known as “Kwik-Drop™ Doors” (KDDs).
Figure 1: A Typical QR Coal Wagon
An unloading sequence commences when a coal wagon (typically with three or four compartments and associated KDDs) enters a dump station equipped with pits underneath the rail lines. Outside the rail near the entry to each pit is an electrically actuated trigger that will mechanically engage with levers on the wagon to open the KDDs according to a particular unloading pattern, spreading the coal across the available pits below. A final actuator closes the doors prior to the wagon passing beyond the last pit.
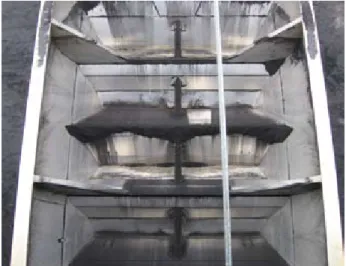
Any coal that remains in the wagon after the KDDs have closed again is known as carryback (Figure 2). Carryback typically occurs due to one or more of the following reasons:
• Incorrect operation of the automatic triggers causing the doors to remain open for insufficient time. This may be due to excessive train speed or more rarely because of an incorrectly identified
wagon-type, so that for example a four-door wagon is triggered on a three-door pattern. • “Sticky coal” (due to moisture) hanging up in the wagon. This can be relatively small amounts, or more rarely, very large segments of coal.
• Coal “ploughing”, where the flow of coal out of the pit is too slow for the wagon unloading rate, backing up the coal flow and preventing a full discharge.
Figure 2: Carryback in a Coal Wagon
Depending on how the carryback is trapped in the wagons, the remnant coal can also spill onto the tracks some time after leaving the dump station. Such spillages occur due to the doors not closing completely at the end of unloading. This is typically caused by residual coal becoming jammed in the door gap as the doors close. At a later time the residual coal will spill out through the improperly closed doors and onto the rails due to vibration of the train during subsequent travel. The cumulative build-up of small amounts of remnant coal leaking from the gaps in the doors of thousands of wagons can eventually cause derailments.
In addition to this cumulative effect, a more immediate and catastrophic situation can occur when large sticky coal hangups remain in the wagon after unloading. If these large hangups remain in a wagon in which the KDDs have failed to fully close and lock (as described above) a dangerous scenario results: at some point the hanging coal will drop, hitting the doors and knocking them open, spilling large volumes of coal onto the rails. This will almost certainly cause a derailment of the train, with serious safety and productivity consequences [2].
2.3 Traditional Carryback Detection and Mitigation
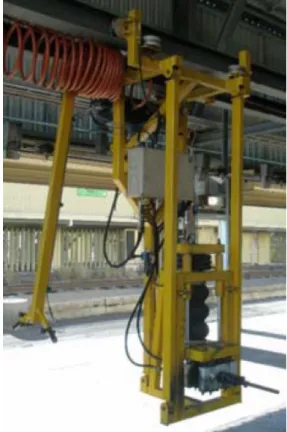
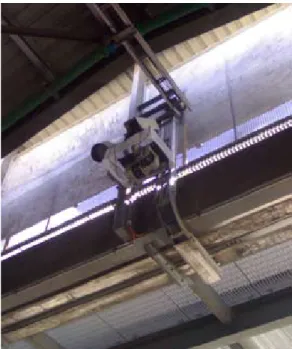
The current practice with regard to carryback detection in most coal terminal operations requires the use of multiple closed-circuit television (CCTV) cameras. These cameras are positioned to allow operators to manually monitor the contents of the coal wagons during and after dumping. If operators see what they deem to be excessive carryback remaining in a wagon after dumping, they can halt the train in time to allow other personnel to vibrate the sides of the wagon in an attempt to dislodge the sticky coal. The dislodging is accomplished by means of manual vibrators (tethered jack-hammers, in many cases, see Figure 3) that are applied to the outside of the wagons in the vicinity of the sticky coal.
Figure 3: Tethered Jackhammer
Typically this dislodgement is done over a final set of pits that are used specifically for this overflow purpose, with the doors of the wagon being left open as it passes over those pits.
There are several problems associated with the current carryback mitigation technology. Most obviously, there is the risk in any manual monitoring situation that the human operator will fail to see or to recognise the carryback, allowing an incident to occur. Lapses in operator alertness and vigilance is a known and well-documented problem [3], with “vigilance decrement” [4] leading to a failure to detect critical information over time. Frequent incidents of large volumes of carryback going undetected at various
coal unloading facilities are evidence of this effect, with at times quite serious consequences. During the course of the project several incidents occurred at various port facilities in Queensland, the most serious being a derailment caused by the sudden discharge of hanging coal carryback which resulted in substantial damage to the overhead and was a serious safety incident.
Another issue associated with manual monitoring concerns the subjective nature of the operator’s decisions. Even in cases where carryback is detected, it is up to the judgement of the operator whether or not the remnant coal is of sufficient volume to justify cleaning. These decisions will vary from operator to operator and even for a single operator over the course of a shift. It is inevitable that at times substantial amounts of carryback are ignored due to these variable human factors.
Both of these concerns: the failure to detect remnant coal and the inconsistency of the threshold-of-action decisions, supply ample motivation for the development of an automatic carryback detection system. An additional motivation is the potential for this technology to be partnered with an automatic cleaning system, rather than the manual and labour-intensive method currently used. In recent years an automated cleaning system has been developed by BMT WBM [5] in the form of a robotic wagon vibrator: this system would be a good match for an automatic detection technology as described below.
3 AUTOMATED CARRYBACK DETECTION
3.1 Technology Development
The detection system is based on the concept of laser scanning technology to build up a profile of the target scene. For this application, a two dimensional (2D) laser scanner (see Figure 4) is rigidly mounted over moving wagons to provide data to develop a three dimensional (3D) scene model.
Figure 4: 2D Laser Scanner
This technique, which can create very accurate 3D models, was initially used by the CSIRO for volume estimation of loads in mining haul trucks (Figure 5). The vehicles were driven under a pair of 2D laser scanners, and the transverse 2D slices acquired were then stacked together by the
CSIRO software in order to reconstruct an accurate 3D volume [6]. By scanning the empty haul truck tray prior to any subsequent loading of the tray, a volume subtraction algorithm could be applied to the 3D models reconstructed from the laser data (Figure 6) in order to calculate the volume of the loaded material.
Figure 5: Mining Haul Truck
Figure 6: 3D Models of Haul Truck Tray
When the volume information for the load is combined with the measured weight of the load, the bulk density of the loaded material in the tray can be calculated. This is a critical parameter for haul trucks in surface mining operations, affecting decisions such as blasting profiles, haul truck tray selection, and tyre wear. The volume measurement system was successfully commercialised in conjunction with an Australian company as the “Trayscan” product, and is currently in use in several surface mining operations.
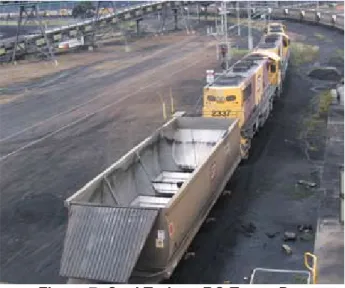
Given the successful development of laser-based load detection systems by CSIRO and the demonstrated need for a carryback solution, there was clear motivation for the coal industry and QR to pursue carryback research based on this earlier work. CSIRO and QR commenced the project with funding from ACARP. The Gladstone Port Authority became a partner in the project, offering Dump Station 3 at the RG Tanna Coal Terminal (Figure 7) as a test site.
Figure 7: Coal Train at RG Tanna Port
3.2 System Design, Implementation and Testing
During the design phase of the project a system was proposed comprising a suite of two laser scanners and a network camera (to provide a visual confirmation of the scanned results). The combination of the two laser scanners and the network camera are shown in Figure 8.
Figure 8: Sensor Suite for Carryback Detection
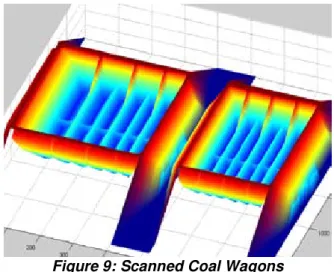
The laser scanners were installed overhead and at right-angles to each other such that one will scan the train wagons transversely to build up a profile of the wagon, while the other scanned the train longitudinally in order to measure speed (and hence correctly position the multiple 2D slices from the transverse laser). The combined information from the two laser scanners was processed in several stages by the CSIRO software system. In the first stage of processing, the system reconstructs the raw 3D data of the train as a continuous data set (Figure 9).
Figure 9: Scanned Coal Wagons
Once the train has been identified, the software then extracts the specific data required to create a 3D model of each individual wagon (Figure 10).
Figure 10: Reconstructed 3D Wagon Model
In the next stage of the processing system, various algorithms are employed to detect the presence of anomalous features such as residual coal. In order to test these algorithms, a version of the system was installed at QR’s Redbank (Brisbane) train yard. QR provided rollingstock for the test in the form of a diesel locomotive and two 73 tonne VAKQ coal wagons. After initial profiles of the empty wagons to confirm that the system was working, various objects (cardboard boxes of different shapes and sizes) were placed in the wagons (Figure 11). The first task of this processing stage is to identify and isolate the individual objects within the wagon (Figure 12). Once the objects have been identified, they need to be located within the internal boundaries of the wagon: this information is important both for alerting the operator to the exact location of the carryback, but also to guide an automated cleaning system to the target. Having isolated and localised the object, the system provides an approximate volume calculation for the object based on the underlying structure of the wagon section around it.
Figure 11: Test Target in a Coal Wagon
One of the reasons for initial testing with objects of known size was to verify the accuracy of the volume measurement algorithms. Although very accurate volume information is not critical for the basic application (since a decision to clean is based on an approximate threshold), nevertheless it was considered highly desirable for the system to make accurate volume measurements in order to derive statistical information regarding bulk amounts of carryback in the coal chain over a longer period of time. It was also important to determine how small an item could be before it was not able to be indentified by the laser scanners: it was found, however, that even pieces of string attached to the test objects (to facilitate retrieval) were clearly identifiable in the reconstructed data (Figure 12).
Figure 12: 3D Reconstruction of Test Target
4 RESULTS
4.1 Site Installation
After the successful testing of system components at Redbank in Brisbane, the full system was installed at the Port. The installed system consisted of the sensor suite and mounting bracket, along with power supplies, serial protocol converters, and a rack-mounted acquisition computer that was located in a 19-inch rack in the main operator control room for Dump Station 3. The sensors were placed overhead of the rail at the exit of the station, ensuring that only residual coal would be detected (Figure 13).
Figure 13: Installed Sensor Suite at RG Tanna
The system was tested and commissioned during a shutdown period, and trigger points for data acquisition were set according to the known sizes of the train wagons.
4.2 Survey and Results
Once the carryback detection system was commissioned, it began to scan trains as they ran through the dump station. The system immediately began to acquire large amounts of data from the passing coal wagons (Figure 14).
Figure 14: 3D Reconstruction of Coal Train
At this stage of the project the system was designed to operate in batch mode, acquiring the 3D scan data for later retrieval and analysis by CSIRO researchers. The data was post-processed to determine the location and quantities of carryback. The post-processing software demonstrated the efficacy of the algorithms used for testing, as it was able to successfully localise data for individual segments of remnant coal across multiple wagons. This information could then be analysed in compressed form in order to summarise the carryback incidents across an entire train. A section of this compressed format data is shown in Figure 15, where small to moderate quantities of carryback from several wagons are shown together.
Figure 15: Summary of Detected Carryback Incidents (Multiple Wagons)
Once it was clear that the system was reliably acquiring data, a longer survey of carryback at the coal terminal was planned. The intention of this phase of the project was to demonstrate the efficacy of the carryback detection system and also to acquire previously unavailable data regarding the quantity and distribution of carryback for a typical coal rail system. A six-month survey period was planned. Despite the inability to gather data for three weeks during this period because of operational issues at the Terminal, more than 50,000 wagons, or approximately 250 trains, were scanned during the survey period. A histogram of the carryback distribution for the total period is shown in Figure 16. The histogram shows the volume of carryback (along the horizontal axis bins, in cubic metres) versus the number of wagons in each bin on the vertical axis.
Figure 16: Histogram of Carryback Volumes (March-August 2007)
The histogram distribution reveals some interesting features of the data. First, as would be expected, a large number of wagons contained very little carryback, as represented by the large peak at the origin and tapering out over the first few bins of the histogram. Two more peaks in the
graph (at approximately 0.35 m3 and 1.2 m3) are initially puzzling. If carryback is distributed in wagons according to some typical pattern, a standard Gaussian distribution (a single bell curve) would be expected. On reflection, however, the presence of two separate curves can be easily explained, with the graph being consistent with the known characteristics of the supply chain. Two main types of wagon design are in operation, one with three compartments and one with four. The three-compartment wagons are smaller and typically contain less carryback than the four-compartment wagons. This is the explanation of the two separate distributions in the histogram, corresponding to the superposition of typical volume distributions for the two wagon types. Another interesting feature of the histogram data became clear when the volume distributions for individual months were compared. From June onwards there was a dramatic shift of the distributions away from the lower end of the graph, where the majority of wagons can be seen to contain significant carryback (Figure 17).
Figure 17: Histogram of Carryback Volumes (June-August 2007)
This shift required deeper analysis since typically the winter months are drier in central Queensland, resulting in drier and hence less sticky coal. Further investigation, however, revealed an interesting fact: the summer of 2007 had been unusually dry, and then was followed by a major series of rains in late June of that year (Figure 18).
0 20 40 60 80 100 120 140 160 180
Mar. Apr. May Jun. Jul. Aug. Month R a in fa ll [ m m ]
Figure 18: Central Queensland Rainfall (March-August 2007)
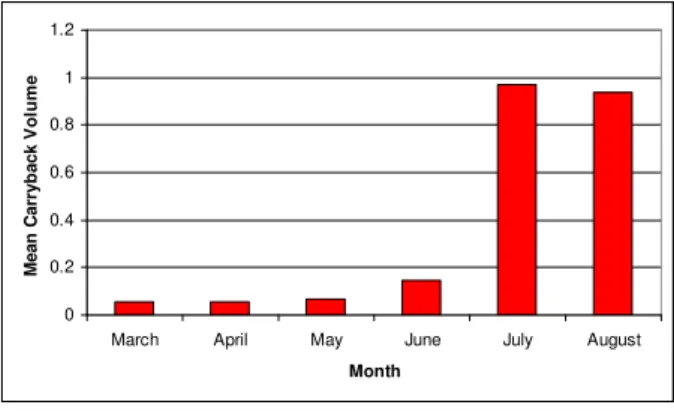
This major rainfall event in June explains the sudden increase in carryback volumes in the subsequent months (Figure 19). Although the data for June does not show a large increase in volumes, it must be recalled that the system was unable to acquire data for most of the month due to terminal operational issues. For the following two months, it appears that wetter coal from the Central Queensland mines’ stockpiles was making its way through the rail system, vastly increasing the incidence of sticky coal in the wagons.
0 0.2 0.4 0.6 0.8 1 1.2
March April May June July August
Month M e a n C a rr y b a c k V o lu m e
Figure 19: Mean Monthly Carryback Volumes (June-August 2007)
The data gathered during the survey period formed the basis of an interim report [7].
4.3 System Improvements
Based on the successful results of the initial offline post-processing-based experiments, a “proof-of-concept” real-time detection and alarm system, was developed This system featured essentially the same algorithms as had been previously developed for the offline processing version, but these were now implemented in custom C++ software installed on the embedded processing computer in the control room.
The operator interface for the system consisted of a display of current and historical trains and wagons, and featured the ability for the operator to set specific threshold levels for warning and alarm events, corresponding to moderate and significant carryback, respectively.
In order to provide a basic visual reference of the carryback location, some work was done on developing a summarised cross-sectional view of the wagons, showing the underlying wagon structure and the outline of the highest peaks of carryback across the wagon. Figure 20 shows an example of this summarised view for a wagon with a significant volume of carryback, while Figure 21 shows the same view for an essentially clean wagon. The vertical axes on these graphs show the distance from the overhead laser scanner installation in millimetres, while the horizontal axes show the wagon length in millimetres.
Figure 20: Summary Profile of a Wagon with Extensive Carryback
Figure 21: Summary Profile of a Clean Wagon
A version of this side profile, combined with a plan view showing the distribution of carryback across the wagon, was developed and included in the user interface for the real-time detection system. A screenshot from this graphical user interface (GUI) is shown in Figure 22. The top section of the GUI shows the train and wagon details (including highlights for wagons with warning and alarm levels of carryback – see Figure 23).
Figure 22: Automatic Carryback Detection User Interface
Figure 23: User Interface Detail of Wagons Information
The bottom section of the GUI shows the summarised display of the carryback distribution in the currently selected wagon, both in plan and profile view (Figure 24).
Figure 24: User Interface Detail of Carryback Information
The installation also functioned successfully as a proof-of-concept real time carryback detection system and demonstrated that carryback, as displayed on the system GUI, could be directly visually correlated with the visible remnant coal in wagons passing under the control station (Figure 25).
4.4 Ongoing Development
The proof-of-concept system demonstrated at RG Tanna was recognised by the port as a highly valuable technology that could significantly improve the reliability of carryback detection at the port. It was therefore resolved that a follow-up “hardening” project should be implemented that would take the proof-of-concept system to the level of a pre-commercial prototype, capable of operating as a 24/7 component of the port operation. Once the commercial negotiations were concluded, work on the new system commenced in early 2010. This development work is currently planned to be commissioned onsite in September 2010.
5 CONCLUSION
An automatic remnant coal detection system for coal wagons has been described. The system has been installed at an operating port in Gladstone, Australia and has provided important and previously unobtainable information regarding the quantity and distribution of coal carryback over the coal train fleet. Furthermore, an initial proof-of-concept real-time detection system was developed in order to alert operators to the presence of excessive residual coal. This system was demonstrated at the port, and has resulted in a follow-up project to develop a hardened prototype that can function as a component of the port’s unloading surveillance facility.
Future opportunities for systems based on the use of the laser scanning technology have been identified in a number of related areas. These include:
• Automatic cleaning systems directed to
the wagons, and the sections of wagons, in which carryback is found;
• Monitoring systems installed at mines to
ensure that returning trains are clean of carryback;
• Modified versions of the software to scan loaded train wagons and compare the loaded profiles with an ideal profile for transport (a major issue in preventing coal spillage from full wagons);
• Modified versions of the software to assist
with automatic loading of coal wagons at the mines.
Apart from scanning coal within the wagons, the CSIRO is also continuing to explore and develop applications relating to the profiling of coal and ore in stockpiles, on conveyor belts, and within ship holds.
ACKNOWLEDGEMENTS
The authors would like to acknowledge the Australian Coal Associate Research Program (ACARP) for their support through research project C15071, together with Syd Paterson (Gladstone
Ports Corporations) and Clive Plunkett
(Queensland Rail Network Access) for their invaluable assistance.
REFERENCES
1. Interim Report Environmental Evaluation of
Fugitive Coal Dust Emissions from Coal Trains: Queensland Rail Limited 2008.
2. Plunkett C, Kayes I, Trieu H, Graham J,
McMullen P. Coal Spill Derailment Review of QR Coal Network. QR Network Access; Sep 2003.
3. Mackworth NH. The breakdown of vigilance
during prolonged visual search. Quarterly Journal of Experimental Psychology1948;1:6-21.
4. Boff J, Kaufmann L, Thomas J P. Handbook
of Human Perception and Performance, Vol.2, Cognitive Processes and Performance. New York: Wiley; 1986.
5. Robotic Wagon Vibrator Unloading Sticky
Coal. BMT WBM; 2007; Available from:
http://media.bmt.org/bmt_media/resources/49/Wag onVibratorA4.pdf.
6. Duff E. Haul-Truck Load Volume Estimation:
CSIRO Internal Report. 2002.
7. Einicke G, Hargrave C, Haustein K, Plunkett C. Analysis of Carry-Back at the RG Tanna Coal Terminal: CSIRO Exploration and Mining 2007.