ASPIRATIONS OF FRESHMEN AND EXPECTATIONS OF SENIORS IN THE COLLEGE OF AGRICULTURE AT KANSAS STATE UNIVERSITY
by
AMANDA PARKS
B.S., Kansas State University, 2014 A THESIS
submitted in partial fulfillment of the requirements for the degree MASTER OF SCIENCE
Department of Agricultural Communications and Education College of Agriculture
KANSAS STATE UNIVERSITY Manhattan, Kansas
2016
Approved by: Major Professor Dr. Shannon Washburn
Copyright
AMANDA PARKSAbstract
Agriculture is one of the fastest growing industries in the world. Universities have the opportunity to meet the growing demand for more agricultural graduates. To better understand how to facilitate students in degree completion at Kansas State University, this study looked at the aspirations of freshmen and the expectations of seniors within the College of Agriculture at Kansas State University. The sample included 517 freshmen and 196 seniors, for a total of 713 students who completed the questionnaire.
Both freshmen and seniors indicated positivity toward future career goals. Additionally, both groups indicated having participated or the desire to participate in a student organization within the College of Agriculture, and to complete an internship relevant to their major.
Intrinsic values, such as relevance to their interests and personal values, were influential in choice of degree for both freshmen and seniors. Both groups responded very positively about future job opportunities and preparedness for the career force. Freshmen and Seniors were relatively consistent in their predication of salary one year and five years after graduation, however freshmen had higher expectations 10 years post-graduation. Forty-two percent (n = 210) of freshmen indicated that they had thought about changing majors, while 29.2% (n = 56) of seniors had responded that they had changed majors during their academic career. Both groups indicated that they had a positive college experience at Kansas State University.
According to this research, Kansas State University students need more information about job opportunities and salary expectations. Additionally, more information regarding majors will help students choose a major most connected to their personal interests.
iv
Table of Contents
List of Figures ... vi
List of Tables ... vii
Acknowledgements ... ix
Chapter 1 - Introduction ... 1
Statement of Problem ... 2
Theoretical Basis ... 3
Need for the Study ... 5
Purpose of Study ... 6
Chapter 2 - Literature Review ... 8
Choice of Major ... 8
Commitment to Major ... 9
Aspirations of Freshmen ... 10
Retention ... 11
Senior Job Expectations ... 12
Barriers to Careers ... 14
Chapter 3 - Methodology ... 15
Purpose of the Study ... 15
Research Design ... 15
Population ... 16
Instrumentation ... 16
Data Collection ... 17
Data Analysis ... 19
Assumptions and Limitations ... 20
Summary ... 21
Chapter 4 - Findings... 22
Purpose of this Study ... 22
Population ... 22
Research Objective One ... 24
v
Commitment to Major ... 29
Career Aspirations ... 34
Future Job Selection ... 38
Expectations of Salary ... 39
College Experience ... 43
Perceived Barriers to Future Employment ... 45
Research Objective Two ... 47
College Experience ... 47
Expectations of Job Opportunities ... 55
Choice of Major ... 58
Expectations of Salary ... 61
Barriers to Future Employment ... 64
Future Job Selection ... 66
Research Objective Three ... 67
Aspirations and Expectations ... 67
Barriers to Future Employment ... 70
Choice of Major ... 71
Summary of Findings ... 74
Research Objective One ... 74
Research Objective Two ... 75
Research Objective Three ... 76
Chapter 5 - Conclusions and Implications ... 78
Research Objective One ... 78
Research Objective Two ... 82
Research Objective Three ... 83
Recommendations for Research ... 85
References ... 87
Appendix A - Freshmen Questionnaire ... 91
vi
List of Figures
Figure 1.1. Tinto’s Student Integration Model ... 4 Figure 1.2. Bean's Student Attrition Model ... 5
vii
List of Tables
Table 3.1 Freshmen classes surveyed ... 18
Table 3.2 Senior classes surveyed ... 19
Table 4.1 Freshmen current majors of population ... 24
Table 4.2 Freshmen student hometown population ... 25
Table 4.3 Freshmen influence of factors on choice of major (n = 517) ... 26
Table 4.4 Freshmen influence of perceptions on choice of major (n = 517) ... 27
Table 4.5 Freshmen influence of external factors on choice of major... 28
Table 4.6 Freshmen choice of major grand means by major ... 29
Table 4.7 Freshmen commitment to major (n = 517) ... 30
Table 4.8 Freshmen commitment score frequencies ... 31
Table 4.9 Freshmen grand mean for commitment to major ... 32
Table 4.10 Freshmen thoughts about changing majors ... 33
Table 4.11 Freshmen potential new major ... 34
Table 4.12 Freshmen reasons for changing majors ... 35
Table 4.13 Freshmen aspirations (n = 517) ... 36
Table 4.14 Freshmen aspirations of job opportunities (n = 517) ... 37
Table 4.15 Freshmen grand mean for aspirations ... 38
Table 4.16 Freshmen factors for job selection ... 39
Table 4.17 Freshmen expected salary after graduation ... 41
Table 4.18 Freshmen mean response compared to actual salary averages post-graduation ... 43
Table 4.19 Freshmen college experience (n = 517) ... 44
Table 4.20 Freshmen college experience thus far ... 45
Table 4.21 Freshmen perceived barreirs to future employment (n = 517) ... 46
Table 4.22 Freshmen grand mean for barriers to future employment ... 47
Table 4.23 Senior academic college experience (n = 196) ... 49
Table 4.24 Senior college participation ... 50
Table 4.25 Senior changed majors ... 51
viii
Table 4.27 Seniors previous major before changing ... 53
Table 4.28 Senior major changes ... 54
Table 4.29 Senior semesters before changing majors ... 55
Table 4.30 Senior college experience ... 55
Table 4.31 Senior expectations of job opportunities (n = 196) ... 56
Table 4.32 Senior career goals (n = 196) ... 57
Table 4.33 Senior career goals after graduation ... 58
Table 4.34 Senior grand mean for expectations ... 59
Table 4.35 Senior influence of factors on choice of major (n = 196) ... 60
Table 4.36 Senior influence of external factors on choice of major ... 61
Table 4.37 Senior grand mean for choice of major ... 61
Table 4.38 Senior expected salary after graduation ... 63
Table 4.39 Senior mean response compared to actual salary averages post-graduation ... 64
Table 4.40 Senior perceived barreirs to future employment (n = 196) ... 65
Table 4.41 Senior grand mean for barriers to future employment ... 66
Table 4.42 Senior factors for job selection ... 67
Table 4.43 Aspirations ... 69
Table 4.44 Expectations of job opportunities ... 70
Table 4.45 Independent T-Test for aspirations/expectations by status ... 70
Table 4.46 Barriers to future employment ... 71
Table 4.47 Independent T-Test for barriers to future employment by status ... 72
Table 4.48 Choice of major ... 73
Table 4.49 Influence of external factors on choice of major ... 73
ix
Acknowledgements
I would like to express my sincere gratitude to my advisor Dr. Shannon Washburn for the continuous support of my research, his patience, and knowledge.
Besides my advisor, I would like to thank Dr. Christine Wilson and Dr. Jason Ellis for their membership on my committee. I could not have completed this thesis without their support, patience, and immense motivation.
Finally, I would like to thank my family and friends for their support during my higher education; specifically, my sister for her valiant efforts at keeping me on track, and Monica Cohen for her listening ear and continuous guidance. Thank you from the bottom of my heart.
1
Chapter 1 - Introduction
Kansas State University, along with most other universities in the country, is interested in the retention and success of students. Agriculture is one of the fastest growing industries in the world, supported by the increase of students enrolling in agricultural programs. In the last decade the characteristics of university agriculture students have changed from students coming from a farm background, to now more undergraduates coming from an urban demographic (Thielen, 2012).
This change in demographics results in a change in student career aspirations. Family background, expected work roles, and society’s opinions on potential job opportunities are all factors pertaining to career aspirations (Conroy, 2000). Conroy found that agricultural
knowledge and knowledge of opportunities within the industry also play a large part in forming student aspirations. As aspirations evolve, a college must also adapt to help students find their place within the industry. This has never been more important than today, when the job opportunities are growing.
The United States Department of Agriculture estimates that employment opportunities for college graduates in the agriculture industry will be around 57,900 jobs between the years 2015-2020. Within the industry, management and business will have around 46% of the total open jobs. However, the current data show that agricultural degree programs are not able to satisfy the employment needs with their student graduates. Companies look elsewhere to fill these positions. With so many job openings filled by non-agricultural graduates, this provides immense potential for agriculture graduates to find career placement (Goecker, Smith, Fernandez, and Ali, 2015).
2
Statement of Problem
An expected increase in job opportunities from 2015-2020 has led many universities to seek to increase agricultural graduates. Of the predicted 57,900 job opportunities within the United States, agricultural graduates will fill only 35,400. Graduates of non-agricultural programs will occupy the remaining 22,500 openings. Employers have stated they prefer agricultural graduates for these openings, rather than students from other areas of study (Goecker, et. al., 2015).
Increase in enrollment support data for increase job openings in the future; the past few years have had agricultural colleges all over the country experience a vast influx of students (Krogstad, 2012). Texas A&M, one of the largest agriculture universities in America,
experienced an increase from 6,694 students in 2009 to 7,895 students in 2014 (Enrollment and Student Demographics, 2014). The University of Connecticut has doubled its College of Agriculture enrollment since 2004 (Krogstad, 2012). Kansas State University also is
experiencing this trend. In 2000, there were 2,004 students enrolled at KSU in the College of Agriculture for the fall semester. The Fall 2014 semester enrolled 2,780 students in the College of Agriculture (Enrollment Summary by College, 2014). As the economy recesses, agriculture is still extremely important. The need to increase food production by a reported 50-70% will keep agriculturalists desirable for some time (“FAO forecasts”, 2011).
Regarding demands for more agriculture graduates, a number of studies have examined recruitment within a college (Einhorn & Hogarth, 1981; Conroy, 2000; Montmarquette,
Cannings, & Mahseredijian, 2002; Malgwi, Howe, & Burnaby, 2005) but a shortage of research exists related to the choice of major within colleges of agriculture. More research is needed to learn how to facilitate the retention of agriculture students within a university. One important
3
component of retention within a major is career aspirations of the student (Cabrera, et al., 1993). This research seeks to develop a clearer understanding of how freshmen choose their major and what factors contributed to their choice at Kansas State University. Additionally, it will shed light on what graduating seniors expect for job opportunities, as well as the factors that contributed to their academic college experience.
Theoretical Basis
The theoretical framework of this study was based on Einhorn and Hogarth’s 1981 theory of behavioral decision making. Einhorn and Hogarth (1981) state that much of the previous research on decision making is unrealistic and set between impractical boundaries that leave much to interpretation bias. They theorize that the context in which decisions are made is just as important as the decisions themselves. Context has previously been illustrated as the variables surrounding a decision, Einhorn and Hogarth (1981) proposed that context should also include variables within a person, such as previous experience, memory, and learning processes of the individual. Moreover, the way the choice is presented, external feedback, and motivations also play an important role in how decisions are made (Einhorn and Hogarth, 1981).
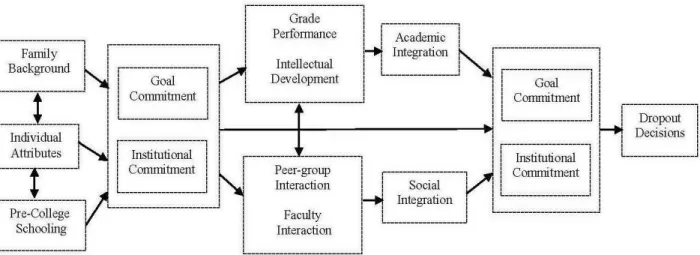
Additionally, two conceptual models were used for this study: Tinto’s Student Integration Model (Figure 1.1) and Bean’s Student Attrition Model (Figure 1.2). Tinto’s model associates students’ attrition to disconnection between students and universities. Tinto emphasized that an individual’s motivation and academic ability, coupled with a university’s characteristics, help strengthened a student’s commitment to their chosen university (Tinto, 1975). Tinto did not, however, look at the role of external factors in shaping a student’s commitment (Cabrera, Nora, and Castaneda, 1993).
4
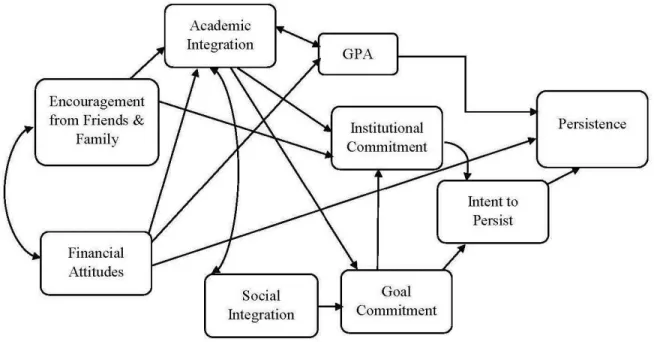
Therefore, Bean’s Student Attrition Model, which focused on attitudes and intentions in regards to persistence, also was used in this study. Bean stated external experiences, outside of the university setting, play a major role in decisions students make. Further research of this model shows that non-intellectual factors play a part in retention as well, such as student culture, family approval, and university experience. Family opinion and support also have both a direct and indirect effect, on student persistence (Cabrera, et al., 1993).
Figure 1.1 Tinto’s Student Integration Model
Figure 1.1. Tinto's model that students' motivation and ability in connection with a university's characteristics helped reinforce a student's commitment to their university. Adapted from: "Dropout from Higher Education: A Theoretical Synthesis of Recent Research” by V. Tinto, 1975, Review of Educational Research, 45, 89-125.
5
Still, major commonalities exist between the two models. Both seem to recognize the importance of internal factors, including courses and student integration into the university culture. Although they differ on what factors are most important in student retention, both agree that retention involves multiple factors over time (Cabrera, et al., 1993).
Need for the Study
At Kansas State University, the College of Agriculture prides itself on being able to provide an excellent learning environment through first-class education and earnest advising. One measure of success is the percentage of students who graduate the university, but few studies (Barkley, 2005; Sivapirunthep, 1999; Thielen, 2012; Wildman, 2001) have examined
Figure 2.2. Bean's Student Attrition Model shows how student attitudes and intentions, in conjunction with external experiences play a role in student commitment and decision making. Adapted from: "College Persistence: Structural Equations Modeling Test of an Integrated Model of Student Retention.” By A. F. Cabrera, A. Nora, and M. B.
6
student perceptions within their majors in the College of Agriculture. This line of inquiry has the potential to provide a better understanding of the aspirations of incoming freshmen, alongside their opinions of majors and their associated career choices. As Kansas State University seniors contemplate entry into the work force, an examination of their expectations of career
opportunity, choice, and satisfaction, as well as their assessment of the College of Agriculture as a whole, will allow the College to better address student retention and satisfaction throughout the college.
Evaluating Kansas State’s retention rate in the College of Agriculture can provide
direction on the areas of needed improvement. Determining key reasons for switching majors can help provide insight on how to better facilitate choosing a major. Additionally, evaluating K-State seniors on their expectations of career opportunity and college experience should shed light on what helped them succeed in, or modify, their major.
Purpose of Study
The purpose of this study was to describe how recruitment retention at Kansas State University in the College of Agriculture is affected by the aspirations of incoming freshmen and by career expectations of exiting seniors. Freshmen students entering the College of Agriculture during the 2015 Fall semester were surveyed during their freshmen orientation class to better understand factors pertaining to their choice of major, commitment to their selected major, and future career aspirations. Additionally, to understand exiting seniors’ expectations and examine factors pertaining to their academic college experience, exiting seniors in the College of
Agriculture were surveyed during a senior class in the Fall 2015 semester. To facilitate this study, the following research objectives were developed:
7
1.) Examine factors pertaining to incoming freshmen choice of degree, commitment to major, and career aspirations.
2.) Examine factors pertaining to exiting seniors’ academic college experience and their expectations of job opportunities.
3.) Compare aspirations and expectations, choice of major, and barriers to future employment between freshmen and seniors in the College of Agriculture at Kansas State University.
8
Chapter 2 - Literature Review
More than 75% of university students change their major between the first day of class and graduation (Maher, 2014). This can add tuition fees to student’s bills, as well as decreasing the chance of student degree completion (Seidman, 2012). From 2012-2022, the number of college graduates needed to fill agriculture job opportunities is projected to increase 10.8%, compared to 2010-2015 (Goecker, G. Smith, E. Smith, and Geotz, 2015). However, only 35,400 graduates of the needed 57,900 will come from a college agricultural program (Goecker, et al., 2015). To increase graduates from Kansas State’s College of Agriculture the factors pertaining to changing major, commitment to major, and factors leading to change of major should be
examined.
Choice of Major
As a student enters a university, one of the first things they are asked to do is to select a major within their college. Some students are unsure and choose an “undecided” category, but most indicate an intended area of study. However, research shows that the majority of students change their major at least once during their college career, and many factors have been shown to influence students’ choice of major (Maher, 2014).
Interest in the major area is the most important factor in choosing a major, supporting prior research (Malgwi, Howe and Burnaby, 2005). Additionally, they stated university services geared toward helping students find a major are the least influential. Takacs (2007) research supported this statement, but found that the professors students had early in their college careers made a profound impact on student persistence within a subject. Enthusiasm and knowledge of professors could help persuade students’ choice of major (Walmsley, 2010). Also, the student culture and previous experiences play significant roles in major choice. Availability of required
9
courses, perception of course rigor, and stress placed upon math and sciences also swayed the major selection (Takacs, 2007).
Family also played a large part in major choice in terms of providing information and job outlook. Parental support of major also tended to increase a student’s selection of a major
(Walmsley, Wilson, & Morgan, 2010).
Commitment to Major
Commitment to their choice of major, also known as academic persistence (Strauss and Volkwein, 2004), is the term used to describe how devoted students are towards graduating in their selected major. This attribute is made up of many factors, including impression of major, satisfaction with the university, academic experience, and sense of belonging. Determining influences on student commitment is important to universities in order to better understand how to facilitate student success (Strauss and Volkwein, 2004).
It has long been thought that students who begin college undecided are at a higher risk of not completing their degree. However, some research disagrees( Anderson, 1985; Foote, 1980). Others have found that more factors played into persistence in addition to the initial major selection by a student (Foote, 1980). Student ACT scores and college entrance exams were the most important indicators of college success and graduation, with higher scores translating into higher graduation rates (Foote, 1980). Uncertainty about selecting a major and indecision are negative barriers to commitment, especially in undecided students within a college (Anderson, 1985).
Conversely, some scholars have found the undecidedness is not a negative aspect towards persistence, rather just one factor of many that lace this multifaceted subject. Degree completion is not substantiated by persistence within major or academic career (Graunke, Woosley &
10
Helms, 2006). Other researchers (Anderson, 1985; Lewallen, 1993) have found fault in the research method for undecided students, in that other factors besides commitment were not studied within the undecided student groups. However, most studies admit their flaws in that not every aspect of persistence is evaluated in each study, and often times gender, demographics, college experience, and other factors are not fully integrated in the data, leaving many
opportunities for more research.
Student experiences can be the most important issue in regards to commitment to a major (Strauss & Volkwein, 2004). Faculty focus efforts on maximizing a student’s experience and involvement to help the student feel more integrated and welcome. In addition, faculty-student communication, learning experiences both inside and outside the classroom, and social
involvement with other students are all positively related to persistence (Strauss & Volkwein, 2004).
Aspirations of Freshmen
One view into students’ aspirations is their choice of major. The factors pertaining to choice of major have shifted in the past few decades. Berger (1988) found that choosing a major was based significantly on student perceptions of predicted future earnings, with less emphasis on projected beginning earnings. However, Wildman and Torres (2001) found that being able to work outdoors and field work were the most persuasive for students majoring in agriculture. Future job market and location of career also ranked high, while projected income and prestige of career were lower in influence (Wildman and Torres, 2001). Nauta (2007) found that students’ satisfaction within a major increased their career decision. Roberts and Styron (2010) found that previous learning experiences ranked highest on factors leading to choice of major. This is
11
supported by Barkley (2005) who found that prior agriculture experience also was the dominant factor in selecting an agriculture major for students at Kansas State University.
In 2012, 26.8% of students in the College of Agriculture at Kansas State University reported coming from an urban area (over 50,000 in population). With more urban students entering agriculture, more emphasis is needed to communicate job opportunities to students with little prior agriculture exposure (Wildman and Torres, 2001).
Retention
Grade point average has long been used as a way of predicting college performance and retention (Garton, Ball, & Dyer, 2002). But that this alone was not the sole variable for
determining retention. Nauta (2007) found that 70 (36%) of 195 students with selected majors at a mid-western university changed majors during the course of two years. Nauta also found that early major satisfaction led to higher satisfaction about career choices. Student interest in a chosen major, clear goals, and connections within a college also help increase retention (Reason, 2009). Helping students early on in finding a major to commit to may help increase retention within a college. An article from the New York Times stated that more than 40% of science based majors switched to another degree due to the rigor of courses (Drew, 2011).
Montmarquette, Cannings, Mahseredjian (2002) found that perceived “riskier” majors, such as science, could be a factor in students choosing other career routes.
Reason (2009) found that retention was a multi-faceted construct that was determined by numerous factors, which has supported with Garton, Ball, and Dyer’s 2002 findings. Reason stated college choice was largely based on high school experiences with agriculture, and personal traits. These traits included willingness to change, student aspirations, and motivation. These findings tended to agree with research conducted over the last decade, however, Reason (2009)
12
also stated other factors were largely at play as well, including socioeconomics and gender. Persistence rates have shown large racial and ethnic differences when compared in college students. White and Asian students had more persistence than other students of color. However, when controlling for socioeconomic status, these differences decreased, signifying that possible income and previous agriculture experience might be the reason behind the change in persistence between the students (Reason, 2009).
Additionally, Reason (2009) established that family is a considerable variable in student retention within a university and remains relatively unstudied. Past studies (Tinto, 1975, Tinto & Pusser; 2006) have indicated that family ties need to be relaxed to encourage persistence.
However, previous studies found that strong family ties and support increased persistence in students of color. As student demographics change in many universities, more research is needed to fully comprehend the influence family has on individual student retention.
Moreover, individual student attributes also have a notable impact on their persistence through a major. Motivation, self-efficacy, aspirations, and excellent high school academics continue to show an influence on persistence. However, it is impractical and disreputable for colleges to only vie for and attain the brightest of our nation’s youth. Therefore, it is more representative for universities to expand efforts on factors they can control.
Senior Job Expectations
Job satisfaction is based upon many factors including salary, potential earnings, and job match quality. In 2002, Lydon and Chevalier found that expectations of recent graduates were a major component of job satisfaction. They stated that young graduates often over-estimate their future income, which leads to a negative impact on satisfaction. Additionally, student lack of awareness of their career monetary position causes less satisfaction than those who were more
13
prepared for the reality of their wage or income level after graduation. Type of degree plays a component in assumed wages (Lydon, 2002).
In his study of graduates between 1978-1988, Barkley (1992) found salaries varied considerably between different agriculture degrees. He found that economics and business degree graduates earned more out of college than animal science graduates. Advanced degrees in agriculture also improved earning potential (Barkley, 1992). It should be noted that at the time of this study (Barkley, 1992), agriculture enrollment was on the decline, however, these findings are not consistent with today’s data (Artz, 2013).
In 2013, Artz found that a graduate of a specialized agricultural degree, such as animal science or agricultural education, earned more than one who earned a generalized agriculture degree, such as agricultural economics or business. Interestingly, the study found that jobs outside of the agriculture industry employing agricultural graduates paid more than jobs found within the industry. This might suggest that graduates are choosing employment outside of the industry when looking at salary alone. However, according to employers, generalized skills were in more demand then specified skills. Artz suggested a more general knowledge of agriculture might help in wage earnings and job satisfaction due to the prospect of additional jobs (Artz, 2013).
These studies support the idea that college retention and job satisfaction are multi-layered and comprised of many factors (Cabrera, Nora, and Castaneda, 1993). An increased
understanding of the complexity of student expectations of their prospective career, and how a college might improve outlooks and satisfaction of their graduates is needed (Reason, 2009).
14
Barriers to Careers
Even though there are a surplus of agricultural jobs available (Goecker, et. al., 2015), there is still concern from college students about employment after graduation. Even after securing a college degree, some students are failing to finding a job. Several factors are thought to be in connection with this issue. Firstly, some research (e.g., Seibert, Kraimer & Crant, 2001) has suggested that a student must be proactive in their job search, and that proactive, outgoing students have a higher job placement versus those who are less active. Searching for jobs requires dedication and persistence, and students who are goal-orientated might have an
advantage over students who are not as driven or focused during job fairs and career employment activities. Students with a less proactive approach toward finding a career after graduation, would participate less in university job fair events (Brown, Cober, Kane, Levy, & Shalhoop, 2006).
Just as self-efficacy has a major impact on a student during college, it also influences their career choices. Self-efficacy (Bandura, 1994), which is students’ belief in their ability and knowledge to succeed, plays a major component in their selection or investigation of a career. This confidence can come from multiple sources, including previous experience, advisor
interaction, or academic preparedness. Additionally, students who possess a lower self-efficacy tend to show more career indecision and less proactive behavior when searching for a job. Students who feel more prepared academically will be more proactive in reaching out to
15
Chapter 3 - Methodology
Purpose of the Study
The purpose of this study was to describe how retention in majors at Kansas State University is affected by the aspirations of incoming freshmen and by career expectations of exiting seniors. Freshmen students entering the College of Agriculture during the 2015 Fall semester were surveyed during their freshmen orientation class to better understand factors pertaining to their choice of major, commitment to their selected major, and future career aspirations. Additionally, to understand exiting seniors’ expectations and examine factors pertaining to their academic college experience, 2015 exiting seniors in the College of Agriculture were surveyed during a senior class in the Fall 2015 Semester. To facilitate this study, the following research objectives were developed:
1.) Examine factors pertaining to incoming freshmen choice of major, commitment to major and career aspirations.
2.) Examine factors pertaining to exiting seniors’ academic college experience and their expectations of job opportunities.
3.) Compare aspirations and expectations, choice of major, and barriers to future employment between freshmen and seniors in the College of Agriculture at Kansas State University.
Research Design
This descriptive census study employed a self-reported survey research design. The instrument consisted of both Likert-type items and multiple response questions that allowed participants to choose the answer best fitting their situation.
16
Population
The population of this study consisted of freshmen students enrolled in the College of Agriculture at Kansas State University during the Fall 2015 semester (N = 564), and anticipated graduating seniors for this academic year enrolled in the College of Agriculture at Kansas State University (N = 549).
Instrumentation
Two questionnaires (Appendix A, Appendix B) were developed in June 2015 by the researcher based on a review of literature (Anderson, 1985; Barkley, 2005; Maher, 2014; Malgwi,et al., 2005; Nauta,2007; Strauss & Volkwein, 2004; Takacs, 2007; Walmsley, et al, 2010). Two questionnaires were administered to the population from August through September of 2015, one for the accessible Freshmen population and one for the accessible Senior
population. A Likert-type scale was used in both instruments, where applicable, to determine influence of each question criteria. Student variables included on the questionnaire identified: students’ current major, students’ previous major, choice of major, commitment to major, career aspirations, and career expectations following graduation.
To test content validity, the questionnaires were reviewed by a panel of faculty at Kansas State University within the College of Agriculture in March 2015. Modifications were made, following the panel’s suggestions, and two questionnaires were finalized. The freshmen questionnaire consisted of 19 questions. The senior questionnaire consisted of 24 questions.
An application was submitted to the Kansas State University’s Institutional Review Board on August 14, 2015. The Institutional Review Board approved the questionnaire and survey procedures on August 17, 2015.
17
Zipcode information was obtained from the U.S. Census website, and population numbers were taken from the 2010 census. For practicality, the population for both Freshmen and Seniors were divided into groups for comparison. Population was determined to be either small, medium, large or metropolitan. Small population was regarded as 1 to 2,500 people per town. Medium population was regarded as 2,501 to 20,000 people per town. Large population was regarded as 20,001 to 75,000 people per town. Metropolitan was regarded as any town with a population > 75,000, including surrounding suburbs. US Census data was used to find most populated cities in Kansas and their suburbs.
Data Collection
To best facilitate this research, teaching coordinators in each department were contacted, via email, to identify the best classes to reach freshmen and exiting seniors. Then, instructors of those courses were contacted via email, and permission was asked to administer the
questionnaire during one class period.
An appropriate exiting senior class meeting time for majors in Agribusiness, Agricultural Communications and Education, Agricultural Economics, Bakery Science and Management, Horticulture, Milling Science and Management, and Wildlife and Outdoor Management could not be arranged, therefore no seniors from these majors were in the data set. Teachers of these suggested classes were contacted three times before concluding that no agreement could be reached. Some student identified those majors as their current majors while being surveyed during other major class times.
Both population groups were given verbal directions and information about the questionnaire and accompanying informed consent form. Students were asked to return the completed questionnaires once completed.
18
The freshmen questionnaire was administered in each freshmen orientation class according to their major from August 20 through September 15, 2015. A total response of 517 students represented 91.7% of the 2015 freshmen class (Table 3.1).
Senior classes were surveyed from August 20 through September 15, 2015. All students were instructed to only complete the questionnaire if they were a graduating senior. A total of 196 seniors completed the questionnaire, representing 35.7% of the exiting senior population (Table 3.2). A total of 713 useable instruments were collected.
Table 3.1
Freshmen classes surveyed
Major n %
Animal Science and Industry 102 231 44.7
Agricultural Economics 105 102 19.6
Agronomy 101 37 7.2
Grain Science 100 28 5.4
Park Management and Conservation 210 28 5.4
Food Science and Industry 101 21 4.1
Agricultural Education 300 18 3.5
Horticulture 190 16 3.1
General Agriculture 101 9 1.7
Agricultural Technology Management 101 6 1.2
Table 3.2
Senior classes surveyed
Major n %
Agricultural Technology Management 661 12 6.1
Agricultural Education 500 15 7.7
Agronomy 625 24 12.2
Animal Science and Industry 533 94 48.0
Food Science and Industry 500 24 12.2
Park Management and Conservation 625. 20 10.2
19
Data Analysis
In this study, measures of central tendency were used to describe how current major, aspirations, commitment to major, college experience, expectations, and choice of major helped students in regards to their overall college experience. Grand means were calculated to better compare differences between freshmen and seniors for the constructs of aspirations and expectations, choice of major, and barriers to employment. Data were analyzed using the SPSS/Windows version 20 computer program.
The first objective was to examine factors pertaining to incoming freshmen choice of major, commitment to major, and career aspirations. Measures of central tendency were utilized to discover information on freshmen students, and to discover differences that might exist between freshmen students enrolled in different majors within the College of Agriculture at Kansas State University. Grand means were calculated to develop a scale for each student in regards to their commitment to their current major, future expectations, and perceptions of barriers to future job placement. Means were compared between majors.
The second objective was to examine factors pertaining to exiting seniors’ academic college experience and their expectations of job opportunities. Measures of central tendency were used to find information on senior students, and to discover differences that might exist between exiting senior students enrolled in different majors within the College of Agriculture at Kansas State University. Grand means were created to identify a score of each student in regards to their attitude towards their major, academic experience, and perceptions of barriers towards future job expectations. Participant responses for all factors in the construct were summed and then divided by the number of responses in order to arrive at a mean for each participant. Then
20
all participant means were summed and divided to arrive at a grand mean for the overall
construct. Grand means were also calculated for students within each major.
The final objective was to compare aspirations and expectations, choice of major, and barriers to future employment between freshmen and seniors in the College of Agriculture at Kansas State University. Measures of central tendency were generated to analyze differences. Independent Sample T-Tests were used to compare means between freshmen and seniors.
Assumptions and Limitations
This research had the following assumptions:1.) Students would answer the self-reported questions with an understanding of their personal beliefs.
2.) Students were able to recall attitudes and beliefs about previous experiences and knowledge.
3.) Students were knowledgeable about academic terminology including major, degree option, minor, etc.
As with most research, procedural obstacles were present in this study and led to the following limitations:
1.) Data from this study were collected from an accessible population of 196 exiting seniors who were enrolled in the College of Agriculture at Kansas State University during the Fall of 2015. A total of 549 anticipated graduating seniors for this academic year were enrolled in the College of Agriculture, therefore decreasing the ability to provide descriptive census data for the population and limiting the
researcher’s ability to draw conclusions.
21
3.) Students answered questions based on their knowledge of terms used. Terms about major could have been misinterpreted to mean option, minor, etc.
4.) Responses were collected only from students present in the classroom at the time and day the researcher visited each class.
5.) An appropriate exiting senior class meeting time for majors in Agribusiness, Agricultural Economics, Bakery Science and Management, Horticulture, Milling Science and Management, and Wildlife and Outdoor Management could not be arranged, therefore no seniors from these majors were in the data set. Teachers of these suggested classes were contacted three times before concluding that no agreement could be reached.
Summary
This descriptive study was conducted using two questionnaires to determine student information regarding how students chose their majors, commitment to their major, expectations, and aspirations. Additionally, this study examined the differences between freshmen and seniors in regards to choice of major, expectations, and aspirations. The population of this study
consisted of 517 freshmen students and 196 exiting seniors within the College of Agriculture at Kansas State University during the Fall 2015 semester.
22
Chapter 4 - Findings
Purpose of this Study
The purpose of this study was to describe how retention in majors at Kansas State University is affected by the aspirations of incoming freshmen and by career expectations of exiting seniors. Freshmen students entering the College of Agriculture during the 2015 Fall semester were surveyed during their freshmen orientation class to better understand factors pertaining to their choice of major, commitment to their selected major, and future career aspirations. Additionally, to understand exiting seniors’ expectations and examine factors pertaining to their academic college experience, 2015 exiting seniors in the College of Agriculture were surveyed during a senior class in the Fall 2015 Semester.
Population
The population of this study consisted of freshmen students enrolled in the College of Agriculture at Kansas State University during the Fall 2015 semester (N = 564), and anticipated graduating seniors this academic year enrolled in the College of Agriculture at Kansas State University (N = 549). A total of 713 students participated (Table 4.1). An appropriate exiting senior class meeting time for majors in Agribusiness, Agricultural Economics, Bakery Science and Management, Horticulture, Milling Science and Management, and Wildlife and Outdoor Management could not be arranged, therefore no seniors from these majors were in the data set. Instructors of these suggested classes were contacted three times before concluding that no satisfactory class time for data collection could be identified. Some student identified those majors as their current major while being surveyed during another major class time.
23
The small, medium and large population sections were fairly consistent in size. However, 9% (n = 46) of freshmen and 8% (n = 15) of seniors were classified as Metropolitan (Table 4.2). Seven students did not respond when asked their zip code.
Table 4.1
Freshmen current majors of population
Major Freshmen n % Seniors n % General Agriculture 9 1.70 0 0.0 Agribusiness 70 13.50 0 0.0
Agricultural Communications and Journalism 21 4.10 1 .50
Agricultural Education 18 3.50 14 7.10
Agricultural Economics 32 6.20 0 0.00
Agricultural Technology Management 6 1.20 12 6.10
Agronomy 37 7.20 24 12.40
Animal Science and Industry 215 41.6 93 47.40
Bakery Science and Management 9 1.70 0 0.00
Feed Science and Management 10 1.90 1 0.50
Food Science and Industry 21 4.10 24 12.20
Horticulture 16 3.10 0 0.00
Milling Science and Management 9 1.70 0 0.00
Park Management and Conservation 25 4.80 20 10.20
Wildlife and Outdoor Enterprise 1 .20 0 0.00
Other 5 .01 5 2.60
24
Research Objective One
The first research objective was to examine factors pertaining to incoming freshmen choice of major, commitment to major, and career aspirations. Data collected from the
questionnaire regarded freshmen choice of major, commitment to major, and career aspirations. Additional information on their future job selection, salary expectations, college experience, perceived barriers to future employment, and expectations of job opportunities was also collected.
Choice of Major
In order to better understand the influence factors had on choice of major, freshmen were asked multiple questions regarding how they chose their major. Table 4.3 and Table 4.5 utilized the scale that consisted of “5,” indicating “Very Influential,” “4,” indicating “Influential,” “3,” indicating “Neutral,” “2,” indicating “Somewhat Influential,” and “1,” indicating “Not
Influential.” Additionally, Table 4.5 used “0,” indicating “Not applicable,” and a Likert-type
Table 4.2
Freshmen student hometown population
Population Freshmen n % Seniors n % Small population 152 29.4 75 38.3 Medium population 197 38.1 65 33.2 Large population 115 22.2 41 20.8 Metropolitan 46 8.9 15 7.7 Not identified 7 1.4 --- ---
Note. Population was divided along natural breaks within reasonable ranges of community size to obtain the most balanced distribution possible. Small population = 1 to 2,500 inhabitants, Medium population = 2,501 to 20,000 inhabitants, Large population = 20,001 to 75,000 inhabitants, and Metropolitan = > 75,001 inhabitants including suburbs.
25
scale that consisted of “5,” indicating “Strongly Agree,” “4,” indicating “Agree,” “3,” indicating “Neutral,” “2,” indicating “Disagree,” “1,” indicating “Strongly Disagree.” Some questions were negatively worded and responses from those questions were reverse coded for comparison purposes.
Participants were asked to indicate the level of influence each factor played in the selection of their major (Table 4.3). “Being interested in my major” (M = 4.54), “Working in a field consistent with my personal values” (M = 4.27), and “Availability of hands-on experiences” (M = 4.22) were the factors with the greatest influence upon choice of major. “Family’s
acceptance of major” (M = 3.21), “Fitting in with students in the major” (M = 3.30) were the lowest in influence.
Table 4.3
Freshmen influence of factors on choice of major (n = 517)
Factors M SD
Being interested in my major 4.54 .66
Working in a field consistent with personal values 4.27 .77
Availability of hands-on experiences 4.22 .80
Future availability of good jobs within this major 4.20 .79 Ability to make a good living within this major 4.14 .83 Desired working conditions of jobs in this field 4.04 .88
Opportunity for higher education 3.87 .94
Making a difference in this field 3.86 .92
Desired location of job opportunities 3.66 .99
Fitting in with students in this major 3.30 1.14
26
Freshmen were asked to what extent they agreed with the listed statements regarding their choice of current major, (Table 4.4). “My family approves of this major” (M = 4.50), “Fitting in this major” (M = 4.17), and “This major aligns with my personal values” (M = 4.06) were the highest positive factors regarding students’ selection of their current major. “Students in the major” (M = 2.65), “Faculty in major” (M = 3.04), and “Community needs more graduates in this major” (M = 3.16) were the least influential factors in how students’ chose their current major.
Table 4.4
Freshmen influence of perceptions on choice of major (n = 517)
Factors M SD
My family disapproves of this major* 4.50 .76
I don’t see myself fitting in this major well* 4.17 .93 This major aligns with personal values that are important to me 4.06 .84 I chose this major due to future availability of jobs 3.70 1.00 Ag industry needs more graduates of this major 3.63 .96 Prior experience prepared me most for this major 3.62 1.14 My community needs graduates in this major 3.16 1.05 Faculty in major played a large part in my choosing this major 3.04 1.06 Students in major did not play a large role in my selection* 2.65 1.07
27
Participants were asked to best describe the influence each item listed had on their choice of major (Table 4.5). This question utilized “0,” indicating “Not applicable.” All participants (n = 612) who responded “0” were removed from the data computation. “Relatives working in an agriculture industry” (M = 3.96), perception of “Availability of future job openings (M = 3.81), Projected future earnings after graduation (M = 3.73), “Agriculture classes” (M = 3.72), and “Previous 4-H experience” (M = 3.62) had an influence in major selection.
Table 4.5
Freshmen influence of external factors on choice of major
Factors n M SD N/A
Relative working in an agriculture industry 393 3.96 1.17 121 Availability of future job openings 491 3.81 1.04 22 Projected future earnings after graduation 496 3.73 1.04 18
High school agriculture classes 308 3.72 1.29 206
28
The grand mean for the construct of choice of major (Table 4.3, Table 4.4, and Table 4.5)
was calculated. Participant responses for all twenty-five items in the commitment construct
(Table 4.6) were summed and then divided by twenty-five in order to arrive at a mean for each
participant. Then all 517 means were summed and divided by 517 to arrive at a grand mean for
the overall construct. Grand means were also calculated for students within each major. “Not Applicable” responses were removed from the calculation.
Table 4.6
Freshmen choice of major grand means by major
Factors n M SD
Feed Science and Management 10 4.35 .45
Wildlife and Outdoor Enterprise Management 1 4.31 N/A
Bakery Science and Management 9 4.06 .58
Agribusiness 70 4.04 .50
Agronomy 37 4.00 .59
Milling Science and Management 9 3.93 .37
Agricultural Economics 32 3.89 .42
Agricultural Education 18 3.89 .52
General Agriculture 9 3.88 .42
Food Science and Industry 21 3.88 .45
Animal Science and Industry 215 3.85 .58
Horticulture 16 3.85 .47
Agricultural Communications and Journalism 21 3.84 .50 Agricultural Technology Management 6 3.76 .14
Park Management and Conservation 25 3.61 .56
Other/Unidentified 18 3.56 .16
29
Commitment to Major
In order to better understand freshmen commitment to major, students were asked about perceptions of their major. Students were asked to report their attitudes toward their current major (Table 4.7). Table 4.7 utilized the scale which consisted of “5” indicating “Strongly Agree,” “4,” indicating “Agree,” “3,” indicating “Neutral,” “2,” indicating “Disagree,” “1,” indicating “Strongly Disagree.” Some questions were negatively worded, and those responses were reverse coded for comparison purposes.
“I can make a difference with this major” (M = 4.42), “This major can get me the job I want” (M = 4.30), and “I don’t feel connected to this major” (M = 4.29) were the most positively selected factors in regards to current attitudes toward a student’s major. “My family accepts this major” (M = 3.20) was the lowest attitude towards their major selection.
Table 4.7
Freshmen commitment to major (n = 517)
Factors M S.D
I can make a difference with this major* 4.42 .82
This major can get me the job I want 4.30 .91
I feel connected to this major* 4.29 .96
I plan on graduating with this major 4.24 .99
I will work in this major for most of my career 4.15 .96 This major will help me reach higher education* 4.11 1.19 I am fully interested in the topic of my major* 3.93 1.21 I will graduate with this major because family accepts this major 3.20 1.17
30
Students considered to be Committed to their major had either a mean of “5,” indicating “Strongly Agree,” or a mean of “4,” indicating “Agree” to the eight factors. Students classified as Uncommitted had a mean of “3,” indicating “Neutral,” “2,” indicating “Disagree,” or “1,” indicating “Strongly Disagree.” A majority of freshmen were categorized as Committed to their major (65.8%). One hundred and seventy-seven freshmen had an Uncommitted score,
representing 34.6% (Table 4.8).
Table 4.8
Freshmen commitment score frequencies
Range n % 5.0 27 5.2 4.9 – 4.0 312 60.6 3.9 – 3.0 148 28.8 2.9 – 2.0 25 5.0 1.9 – 1.0 4 0.8
31
The grand mean for the construct of commitment (Table 4.9) was calculated. Participant
responses for all eight items in the commitment construct (Table 4.7) were summed and then
divided by eight in order to arrive at a mean for each participant. Then all 517 means were
summed and divided by 517 to arrive at a grand mean for the overall construct. Grand means
were also calculated for students within each major.
Table 4.9
Freshmen grand mean for commitment to major
Factors n M SD
Horticulture 16 4.38 .38
Bakery Science and Management 9 4.37 .40
Feed Science and Management 10 4.31 .42
Milling Science and Management 9 4.25 .45
Agricultural Education 18 4.24 .55
Animal Science and Industry 215 4.16 .68
Agronomy 37 4.13 .64
Agribusiness 70 4.03 .51
Other/Unidentified 18 4.03 .63
Park Management and Conservation 25 3.92 .73
Food Science and Industry 21 3.90 .61
Agricultural Economics 32 3.89 .61
Agricultural Technology Management 6 3.83 .64
Agricultural Communications and Journalism 21 3.63 .78
General Agriculture 9 3.51 .72
Wildlife and Outdoor Enterprise 1 2.25 .63
32
Students were asked if they had ever thought about changing majors (Table 4.10). Forty-two percent reported that they had thought about changing majors (n = 210). Fifty-eight percent reported that they had not thought about changing majors (n = 292).
Table 4.10
Freshmen thought about changing majors
Answer n %
Yes 210 41.8
33
Students who responded that they had thought about changing majors were asked into which major they would most likely change. Thirty-nine percent reported Other, which could include majors outside the College of Agriculture. Ten percent reported that they would change into Animal Science and Industry. Agribusiness and Wildlife and Outdoor Enterprise
Management both received 8% of students (Table 4.11).
Table 4.11
Freshmen potential new major
Factors n %
Other 78 38.5
Animal Science and Industry 20 10.0
Agribusiness 16 8.0
Wildlife and Outdoor Enterprise 16 8.0
Agricultural Economics 12 6.0
Agronomy 12 6.0
Feed Science and Management 10 5.0
Agricultural Technology Management 8 4.0
General Agriculture 8 4.0
Agricultural Communications and Journalism 5 2.5
Agricultural Education 4 2.0
Park Management and Conservation 4 2.0
Food Science and Industry 3 1.5
Bakery Science and Management 2 1.0
Horticulture 2 1.0
34
When asked the main reasons for potentially leaving their current major, the highest rated factors included, “The major does not align with my personal goals” (n = 49), “The curriculum does not match my career interests” (n = 42), and “I am not enjoying the classes in which I am enrolled for my major” (n = 40). “My family does not support my choice in major” (n = 1), “I have a personality conflict with one or more faculty in my major” (n = 6), and “I am not sure how I ended up in this major” (n = 9) were the lowest ranked reasons for changing majors (Table 4.12).
Career Aspirations
In order to better understand career aspirations of freshmen, questions were asked
regarding future goals. Table 4.13 and Table 4.14 utilized a Likert-type scale which consisted of “5,” indicating “Strongly Agree,” “4,” indicating “Agree,” “3,” indicating “Neutral,” “2,”
Table 4.12
Freshmen reasons for changing majors
Factors n %
Major does not align with my personal goals 49 19.4 Curriculum does not match my career interests 42 16.7 I am not enjoying classes I am enrolled in for my major 40 15.9
I chose my major without much thought 36 14.3
I don’t fit into the culture of my major 32 12.7
I feel disconnected to the students in my major 25 9.9 Scholarship opportunities are better in other majors 12 4.8 I am not sure how I ended up in my current major 9 3.6 I have a personality conflict with one or more faculty 6 2.6 My family does not support my choice of major 1 .1
35
indicating “Disagree,” “1,” indicating “Strongly Disagree.” Some questions were negatively worded, and those responses were reverse coded for comparison purposes.
Participants were asked to what extent they agreed with the listed factors in regards to their future career goals (Table 4.13). “I would prefer to work in a career centered around my major” (M = 4.22), and “I plan to pursue a career in an agriculture industry relevant to my major” (M= 4.21) were the highest rated aspirations. “I feel that I have a working knowledge of job availabilities within my major” (M = 3.55), “I feel that there is recognition of my major in my community” (M = 3.56), and “I am using my major as a stepping block to higher education” (M = 3.61) were the lowest rated responses.
Table 4.13
Freshmen aspirations (n = 517)
Factors M SD
I would prefer to work in a career centered around this field 4.22 .81 I plan to pursue a career relevant to my major 4.21 .90 My major will allow me to find a job with good pay* 4.06 .97 Using my major as a stepping stone to more jobs 4.02 .80 This major will allow me to live in my desired location 4.00 .84 This major will allow me to make a difference in the world 3.97 .83 There are adequate opportunities to stand out in my major* 3.87 .95 Using my major as a stepping stone to higher education 3.61 1.00
My community recognizes my major 3.56 1.01
I have knowledge of job availabilities in my major 3.55 .95
36
Participants were asked their attitudes toward future expectations within their major (Table 4.14) “I must choose a job that will help me maintain a good quality of life” (M = 4.23), “My degree will prepare me to take a middle to high level position within my field” (M = 4.11), and “My salary will allow me to maintain a comfortable standard of living in my chosen location after college” (M = 4.08) were the factors with the highest means in regards to expectations of future job opportunities. “Being in a community larger than my hometown is important in the selection of my job” (M = 2.45) was the lowest mean reported of the available factors.
Table 4.14
Freshmen aspirations of job opportunities (n = 517)
Factors M SD
I must choose a job that will help me maintain a good quality of life 4.23 .76 I will be prepared to take a middle/high level position 4.11 .74 Salary will allow a comfortable standard of living 4.08 .79 I am prepared to take a management/administration position 3.82 .90 Salary is an important factor when selecting a job* 3.39 1.01
Being located near my family is important 3.32 1.10
Being in a community larger than my hometown is important 2.45 1.01
37
The grand mean for the construct of aspirations was compared between majors (Table 4.15). The means from Table 4.13 and Table 4.14 were combined to give a grand mean for each student.
Table 4.15
Freshmen grand mean for aspirations
Factors n M SD
Wildlife and Outdoor Enterprise 1 4.48 N/A
Feed Science and Management 10 4.12 .32
Agribusiness 70 3.90 .38
Agronomy 37 3.87 .43
Bakery Science and Management 9 3.82 .31
Agricultural Technology Management 6 3.82 .06
Agricultural Economics 32 3.81 .31
Food Science and Industry 21 3.80 .30
Horticulture 16 3.80 .37
Animal Science and Industry 215 3.79 .43
Milling Science and Management 9 3.77 .37
General Agriculture 9 3.76 .34
Agricultural Education 18 3.74 .39
Park Management and Conservation 25 3.60 .43
Agricultural Communications and Journalism 21 3.56 .37
Other/Unidentified 18 3.53 .35
38
Future Job Selection
In order to better understand freshmen perceptions on future job selection, a total of 9 prompts were given (Table 4.16). The participants were asked to rank the top 3 factors most important to future job selection. The top three factors selected by freshmen, in any rank, were “Salary” (n = 324), “Relevance to My Interests” (n = 275), and “Location” (n = 242). The three lowest selected factors were “Community Perception of My Job” (n = 14), “Co-Workers” (n = 25), and “Prestige of Job” (n = 36).
Table 4.16
Freshmen factors for job selection
Factors n %
Salary 324 24.3
Relevance to my interests 275 20.6
Location 242 18.2
Long term opportunities in this field 170 12.8 Making a difference in this field 132 9.9 Opportunity for advancement 115 8.6
Prestige of job 36 2.7
Co-Workers 25 1.9
39
Expectations of Salary
In order to better understand freshmen expectations of salary, participants were asked to choose the range that best represented the salary they expect to receive annually 1 year, 5 years, and 10 years after graduation (Table 4.17).
Students selected the most appropriate response for their expected salary one year after graduation, with “1,” indicating between “$0 - $10,000,” “2,” indicating between “$10,001 – 30,000,” “3,” indicating between “$30,001 – 50,000,” “4,” indicating between “$50,000-
75,000,” “5,” indicating between “$75,001 – 100,000,” “6,” indicating “ greater than $100,000,” and “7,” indicating “Unsure.”
40
Table 4.17
Freshmen expected salary after graduation
Factors n %
1 Year After Graduation
$0 – 10,000 42 9.7 $10,001 – 30,000 86 19.9 $30,001 – 50,000 160 37.0 $50,001 – 75,000 72 16.7 75,001 – 100,000 7 1.6 > $100,0001 6 1.4 Unsure 58 13.4
5 Years After Graduation
$0 – 10,000 3 0.7 $10,001 – 30,000 20 4.5 $30,001 – 50,000 98 22.1 $50,001 – 75,000 169 38.1 75,001 – 100,000 89 20.0 > $100,0001 16 3.6 Unsure 49 11.0
10 Years After Graduation
$0 – 10,000 1 0.2 $10,001 – 30,000 3 0.7 $30,001 – 50,000 28 6.6 $50,001 – 75,000 96 22.5 75,001 – 100,000 107 25.1 > $100,001 128 30.0 Unsure 63 14.8
41
For comparison purposes, 2014 and 2015 post-graduation average salary data from Kansas State University Career and Employment Services are presented (Employment Report). Additionally, the number of reported offers by major are recorded in Table 4.18. According to the Kansas State University Career and Employment Services data (Table 4.18), students majoring in Agribusiness, Agricultural Education, Agricultural Economics, Animal Science and Industry, Bakery Science and Management, Feed Science and Management, and Wildlife and Outdoor Enterprise Management students reported a mean within the range that Career and Employment Services reported for the average salary one year after graduation. Agricultural Communication, Agricultural Technology Management, Agronomy, Food Science and Industry, Horticulture, Milling Science and Management, Park Management and Conservation students had an average expected salary one year after graduation which was lower than the average salary one year after graduation reported by Kansas State University Career and Employment Services. No majors reported an average higher than the average salary one year after graduation as reported by Career and Employment Service.
42
Table 4.18
Freshmen mean response compared to actual salary averages post-graduation
Major n M SD n*
Actual Salary Average*
General Agriculture 8 $10,001- 30,000 1.98 -- N/A
Agribusiness 58 $30,001- 50,000 1.18 40 $47,471
Agricultural Communication 20 $10,001- 30,000 1.50 5 $42,140
Agricultural Education 16 $30,001- 50,000 1.73 10 $38,325
Agriculture Economics 28 $30,001- 50,000 1.50 28 $46,147
Agricultural Technology Management 5 $10,001- 30,000 1.00 6 $47,080
Agronomy 27 $30,001- 50,000 1.25 26 $50,722
Animal Science and Industry 184 $30,001- 50,000 2.06 61 $36,500 Bakery Science and Management 9 $50,001 – 75,000 1.59 8 $56,000 Feed Science and Management 10 $30,001- 50,000 .95 3 $47,667 Food Science and Industry 16 $10,001- 30,000 .95 17 $49,933
Horticulture 13 $10,001- 30,000 1.72 11 $37,429
Milling Science and Management 8 $30,001- 50,000 .46 11 $62,529 Park Management and Conservation 20 $10,001- 30,000 .58 11 $43,165 Wildlife & Outdoor Ent. Management 1 $30,001- 50,000 N/A 7 $40,200
Total 423 $30,001- 50,000 -- -- --
43
College Experience
Several questions were asked to better understand freshmen college experience thus far at Kansas State University, and their anticipated experiences during their academic career. To determine freshmen college academic experience, including curriculum, extracurricular
activities, and work experience, participants were asked what they anticipate they will participate in during their time at Kansas State University (Table 4.19). Table 4.19 utilized a Likert-type scale that consisted of “5,” indicating “Strongly Agree,” “4,” indicating “Agree,” “3,” indicating “Neutral,” “2,” indicating “Disagree,” “1,” indicating “Strongly Disagree.” “I will participate in an internship related to my major” (M = 4.26), and “I will participate in a student organization within the College of Agriculture” (M = 4.13) were the top rated experiences students expected to pursue. “I will have a non-career related part time job on campus” (M = 2.79) and “I will participate on a competitive/judging team in the College of Agriculture” (M = 2.80) were the lowest rated expected experiences.
Table 4.19
Freshmen college experience (n = 517)
Factors M SD
Participate in an internship related to my major 4.26 .81
One student organization in the College of Agriculture 4.13 .96
Participate in one student organization outside of the College of Agriculture 3.66 1.09
Career-related part-time job off campus 3.30 .99
Participate in a study abroad 3.21 1.23
Career-related part time job on campus 3.20 1.07
Non-career related part-time job off campus 2.88 1.06
Compete on a judging team in the College of Agriculture 2.80 1.08
44
When asked to rate their college experience, more than 88% students reported having extremely positive or positive experience thus far at Kansas State University (Table 4.20). Seven students (1.4%) reported Negative or Extremely negative experiences.
Table 4.20
Freshmen college experience thus far
Factors n % Extremely positive 155 31.0 Positive 288 57.6 Neutral 50 10.0 Negative 6 1.2 Extremely negative 1 0.2