INSIDE:
U.S. Department of Education
Institute of Education Sciences
NCES 2006-459Results From NAEP 2000–2005
EXECUTIVE SUMMARY INTRODUCTION STUDENT CHARACTERISTICS STUDENT PERFORMANCE SCORE CHANGES STUDENT GROUP PERFORMANCE STUDENT GROUP CHANGES TECHNICAL AND DATA APPENDIX 1 2 4 7 10 12
CONTENTS
Student Achievement
in Private Schools
14 16The Nation’s Report Card™, the National Assessment of Educational Progress (NAEP), is a nationally representative and continuing assessment of what America’s students know and can do in various subject areas. For over three decades, assessments have been conducted periodically in reading, mathematics, science, writing, history, geography, and other subjects.
By making objective information on student performance available to policymakers at the national, state, and local levels, NAEP is an integral part of our nation’s evaluation of the condition and progress of education. Only informa-tion related to academic achievement and relevant variables is collected under this program. The privacy of individual students and their families is protected, and the identities of participating schools are not released.
NAEP is a congressionally mandated project of the National Center for Education Statistics within the Institute of Education Sciences of the U.S. Department
of Education. The Commissioner of Education Statistics is responsible, by law, for carrying out the NAEP project through competitive awards to qualified organizations. In 1988, Congress established the National Assessment Governing Board (NAGB) to oversee and set policy for NAEP. The Board is responsible for selecting the subject areas to be assessed; setting appropriate student achieve-ment levels; developing assessachieve-ment objectives and test specifications; developing a process for the review of the assessment; designing the assessment methodology; devel-oping guidelines for reporting and disseminating NAEP results; developing standards and procedures for inter-state, regional, and national comparisons; determining the appropriateness of all assessment items and ensuring the assessment items are free from bias and are secular, neutral, and nonideological; taking actions to improve the form, content, use, and reporting of results of the National Assessment; and planning and executing the initial public release of NAEP reports.
The National Assessment Governing Board
What is The Nation’s Report Card
™
?
Darvin M. Winick, Chair President
Winick & Associates Dickinson, Texas Sheila M. Ford, Vice Chair Former Principal
Horace Mann Elementary School
Washington, D.C. Francie Alexander Chief Academic Officer,
Scholastic, Inc. Senior Vice President,
Scholastic Education New York, New York David J. Alukonis Chairman
Hudson School Board Hudson, New Hampshire Amanda P. Avallone Assistant Principal and
Eighth-Grade Teacher Summit Middle School Boulder, Colorado Honorable Jeb Bush Governor of Florida Tallahassee, Florida Barbara Byrd-Bennett Chief Executive Officer Cleveland Municipal School
District Cleveland, Ohio
Carl A. Cohn Superintendent San Diego City Schools San Diego, California Shirley V. Dickson Educational Consultant Laguna Niguel, California John Q. Easton Executive Director Consortium on Chicago School Research Chicago, Illinois David W. Gordon Sacramento County Superintendent of Schools Sacramento County Office
of Education Sacramento, California Kathi M. King
Twelfth-Grade Teacher Messalonskee High School Oakland, Maine
Honorable Keith King Member
Colorado House of Representatives
Colorado Springs, Colorado Kim Kozbial-Hess
Fourth-Grade Teacher Fall-Meyer Elementary School Toledo, Ohio
Andrew C. Porter Director
Learning Sciences Institute Peabody College Vanderbilt University Nashville, Tennessee Luis A. Ramos Community Relations Manager PPL Susquehanna Berwick, Pennsylvania Mark D. Reckase Professor Measurement and Quantitative Methods Michigan State University East Lansing, Michigan John H. Stevens Executive Director Texas Business and
Education Coalition Austin, Texas
Mary Frances Taymans, SND Executive Director National Catholic Educational Association Washington, D.C. Oscar A. Troncoso Principal
Socorro High School Socorro Independent School
District El Paso, Texas
Honorable Thomas J. Vilsack Governor of Iowa
Des Moines, Iowa Michael E. Ward
Former State Superintendent of Public Instruction North Carolina Public Schools Jackson, Mississippi
Eileen L. Weiser Member, State Board of
Education Michigan Department of Education Lansing, Michigan Grover J. Whitehurst (Ex officio) Director Institute of Education Sciences U.S. Department of Education Washington, D.C. Charles E. Smith Executive Director, NAGB Washington, D.C. U.S. Department of Education Margaret Spellings Secretary Institute of Education Sciences Grover J. Whitehurst Director
National Center for Education Statistics
Mark Schneider Commissioner
Executive Summary
This report is the first to focus on private school stu-dents’ performance on NAEP assessments. It provides results in reading, mathematics, science, and writing in 2000, 2002, 2003, and 2005. Specifically, it focuses on the three private school types that combined enroll the greatest proportion of private school students (Catholic, Lutheran, and Conservative Christian) as well as private schools overall. It also compares the per-formance of students in these schools to that of public school students to provide additional perspective. Comparing student
performance among the three types of pri-vate schools highlights several differences at grades 4 and 8 and a few at grade 12. Among the three types of private schools, few significant differences in performance were
found at grade 12. The exceptions were that in 2000, the average score in science for grade 12 students in Catholic schools was 6 points higher than for students in Lutheran schools, and that in the 2000 mathemat-ics assessment, a higher percentage of twelfth-graders in Catholic schools performed at or above Proficient than twelfth-graders in Conservative Christian schools. Where differences existed at grades 4 and 8, students in Lutheran schools generally outperformed those in Conservative Christian schools. In some grade/subject
combinations, Lutheran school students outperformed Catholic school students, and Catholic school students outperformed Conservative Christian school students. Students at grades 4, 8, and 12 in all categories of private schools had higher average scores in reading, mathematics, science, and writing than their counter-parts in public schools. In addition, higher percentages of students in private schools performed at or above Proficient compared to those in public schools. Average scores in mathematics at grades 4 and 8 increased between 2000 and 2003 for both public and private schools overall. Students in Catholic schools also had higher average mathematics scores in 2003 than in 2000 in both grades.
The three types of private schools have few differences in their student demographics, except that Catholic schools generally enroll a greater proportion of Hispanic students than Lutheran schools. In general, private schools enroll a higher proportion of White students
than public schools, while public schools have a higher proportion of Black and Hispanic students. Private schools also enroll a smaller proportion of students with disabilities, English language learn-ers, and students eligible for free or reduced-price school lunch.
Black and Hispanic fourth-graders in all private schools combined had higher average mathematics scores in 2003 than in 2000. However, no significant differences in scores were found across the same time period for Black and Hispanic private school students in grade 4 reading or grade 8 mathematics.
A word of caution is needed: The data in this report provide a summary of the performance of students in public and private schools. The number of assessed students in some types of private schools is small, so it is not always feasible to make statistically meaningful comparisons between the performance of public school students and students in particular types of private schools. Factors not reported here, such as admission policies and parental involvement, can also influence student achievement. Students in Lutheran schools outperformed students in Conservative Christian schools in some instances in grades 4 and 8. Private schools generally enroll a smaller proportion of Black and Hispanic students than public schools.
The NAEP website (http://nces. ed.gov/nationsreportcard/) provides an array of information and results from the main NAEP assessments in 2000, 2002, 2003, and 2005, including PDF versions of all NAEP reports, a data tool for exploring the summary results and calculating statistical significance of differences, and a tool for examining released questions from the assessment. Subject-area frameworks for the NAEP assessments are available on the NAGB website (http://www. nagb.org/pubs/pubs.html).
!
1Eighth- and twelfth-grade students reported the highest level of education attained by either parent. Parental education data from fourth-graders are not reported because research indicates that these students are less likely to report data accurately.
Introduction
The National Assessment of
Educational Progress (NAEP) measures the knowledge of students in grades 4, 8, and 12 in a variety of subject areas. About 10 percent of the entire U.S. school population, almost 5.3 mil-lion students, attended private schools during the 2001–02 school year (Broughman and Pugh 2004). This report provides NAEP results for pri-vate schools in 2000, 2002, 2003, and some in 2005. The subjects addressed in this report are reading and writing at grades 4 and 8, and mathematics and science at grades 4, 8, and 12.
What Information Is Available
From NAEP About Private
Schools?
In the 1970s and 1980s, the NAEP long-term trend assessment reported data separately for public school students and for all private school stu-dents, without distinguishing among types of private schools. Beginning in 1990, main NAEP also has reported performance data separately for private school students in Catholic and in non-Catholic schools. NAEP further increased the number of reporting categories for private schools for the 2000 assessments to include Catholic, Lutheran, Conservative Christian, Other Religious, and Nonsectarian. Different reporting categories for
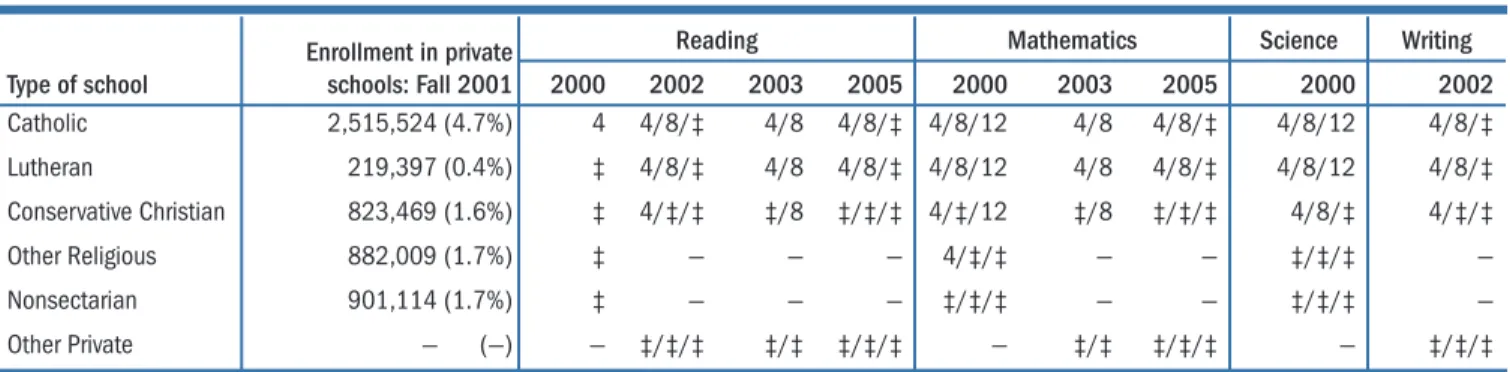
pri-vate schools were used in 2002 and 2003. In 2005, data were available only for Catholic and Lutheran schools. Table 1 shows the types of private schools for which NAEP collected reportable data in each subject and assessment year.
What Findings Are Discussed
in This Report?
For the past 30 years, NAEP has reported that students in private schools outperform students in public schools. This report confirms that point, but also looks more closely at NAEP results for three types of private schools: Catholic, Lutheran, and Conservative Christian. Combined, these schools enroll the majority of private school students, and they participated in NAEP at most grades in 2000, 2002, and 2003. This is the first NAEP report to compare the performance of students in these three types of private schools.
In this report, results of the 2000, 2002, and 2003 NAEP assessments for Catholic, Lutheran, and Conservative Christian schools are compared with each other. Although all categories of private schools are included in the total for "overall" private, only these three categories are shown separately. An update on 2005 results for Catholic and Lutheran schools is also provided.
Comparisons to public schools are also provided as points of reference. Results are given for students overall, as well as for student groups defined by race/ethnicity and—at grades 8 and 12 only—by the highest level of education reached by the students’ parents.1 Comparisons over time for the 2000–2003 mathematics and read-ing assessments are included whenever possible. Changes in the gaps between private and public school students’ performance are also discussed. The comparisons discussed in this report between students in the different types of private schools, and between students in private schools and pub-lic schools, are statistically significant unless otherwise stated.
Enrollment in private schools: Fall 2001
Reading Mathematics Science Writing
Type of school 2000 2002 2003 2005 2000 2003 2005 2000 2002 Catholic 2,515,524 (4.7%) 4 4/8/‡ 4/8 4/8/‡ 4/8/12 4/8 4/8/‡ 4/8/12 4/8/‡ Lutheran 219,397 (0.4%) ‡ 4/8/‡ 4/8 4/8/‡ 4/8/12 4/8 4/8/‡ 4/8/12 4/8/‡ Conservative Christian 823,469 (1.6%) ‡ 4/‡/‡ ‡/8 ‡/‡/‡ 4/‡/12 ‡/8 ‡/‡/‡ 4/8/‡ 4/‡/‡ Other Religious 882,009 (1.7%) ‡ — — — 4/‡/‡ — — ‡/‡/‡ — Nonsectarian 901,114 (1.7%) ‡ — — — ‡/‡/‡ — — ‡/‡/‡ — Other Private — (—) — ‡/‡/‡ ‡/‡ ‡/‡/‡ — ‡/‡ ‡/‡/‡ — ‡/‡/‡
— Not available because data were not collected.
‡ Reporting standards not met. Data are not reported because participation rates failed to meet minimum NCES standards for reporting.
NOTE: The grade in each cell indicates that reportable data for the category are available at this grade in this subject and year. Percentages of all students enrolled in each type of private school are shown in parentheses. Enrollment numbers are for elementary and secondary schools combined.
SOURCE: U.S. Department of Education, Institute of Education Sciences, National Center for Education Statistics, Private School Universe Survey (PSS), 2001–2002, National Assessment of Educational Progress (NAEP), various years, 2000–2005 Reading, Mathematics, Science, and Writing Assessments.
Table 1. Grades assessed with reportable data, by subject and type of private school: Various years, 2000–2005
Achievement levels are performance standards set by the National Assessment Governing Board (NAGB) to help interpret student performance on NAEP. The three NAEP achievement levels, from lowest to highest, are
Basic—denotes partial mastery of the knowledge and skills that are fundamental for proficient work at each grade.
Proficient—represents solid academic performance. Students reaching this level have demonstrated competency over
challenging subject matter.
Advanced—signifies superior performance.
Detailed descriptions of the NAEP achievement levels for each subject can be found on the NAGB website (http://www.nagb.org/pubs/pubs.html).
What Are NAEP Achievement Levels?
! Catholic schools includedparo-chial, diocesan, and private order schools.
! Lutheran schools included all those that indicated an affiliation with any branch of the Lutheran Church.
! Conservative Christian schools included all those that indicated membership in Accelerated Christian Education, American Association of Christian Schools, Association of Christian Schools International, Association of Christian Teachers and Schools, or the Oral Roberts University Educational Fellowship.
! Other Religious included all other schools that indicated an affiliation with any other religious organization. This category was tabulated separately only in 2000.
! Nonsectarian schools included all private schools without an affiliation to any religious organization or institution. This category was tabulated sepa-rately only in 2000.
! Other Private schools includ-ed the combininclud-ed data for “Nonsectarian” and “Other Religious” schools, when data in those categories were too few to report separately. This category was created in 2002.
Private School Types
How Are Results Reported?
Results are reported in two ways: as average scale scores and as percentages of students attaining NAEP achieve-ment levels. Average scale scores in NAEP measure what students know and can do, and are reported on 0–500 scales in mathematics and read-ing, with all three grades on the same scale; science and writing are reported on 0–300 scales with each of the three grades on a separate scale.
Three achievement levels—Basic, Proficient, and Advanced—have been developed by the National Assessment Governing Board (NAGB) to provide a context for interpreting student per-formance on NAEP assessments. These achievement levels state what students should know and be able to do in each subject area and at each grade assessed. Further information on achievement levels and sample questions associ-ated with these achievement levels can be found in previous NAEP reports (see, for example, Braswell et al. 2005; Donahue, Daane, and Jin 2005) or online at http://nces.ed.gov/ nationsreportcard/itemmaps/ or http://www.nagb.org/pubs/pubs.html. As provided by law, the National Center for Education Statistics (NCES), upon review of congressio-nally mandated evaluations of NAEP, has determined that achievement lev-els are to be used on a trial basis and should be interpreted and used with caution. However, NCES and NAGB have affirmed that these performance standards are useful for understanding trends in achievement. NAEP achieve-ment levels have been widely used by national and state officials for over a decade.
Cautions in Interpretation
It is important to note that a relationship between a variable and measures of educational achievement, like the ones presented in this report, does not imply that a difference in the variable causes differences in educational achievement. Higher performance scores in private schools do not imply that the private schools are better than public schools, as they often serve different populations of students. In addition, the results are cross-sectional, rather than longitudinal, so they only provide a snap-shot for any given point in time. Comparing students of a particular demographic group may provide more information; however, only one characteristic is compared at a time. For example, this report compares the performance of Black students in different types of schools, but it does not compare the performance of Black students who are eligible for free school lunch across school types, because of limita-tions of the sample. There are many reasons why the performance of one group of students differs from another, including factors that are not measured in NAEP.
Some key results are presented in the body of the report. Additional data for reading and mathematics are found in the Technical and Data Appendix. As indicated in the appen-dix tables, some of the data presented in the appendix should be interpreted with caution due to the uncertainty of the variability of the estimates. Also, estimates based on smaller student groups are likely to have relatively large standard errors. These large standard errors mean that some differences that seem large may not be statistically significant. Because private school results are based on smaller samples, they are less likely to show significant differences than the results from public schools. Standard errors, as well as additional data on science and writing, can be found using the NAEP data tool at http://nces.ed.gov/nations reportcard/nde/. Further explanation is pro-vided in the Technical and Data Appendix.
Characteristics of Students in Private Schools
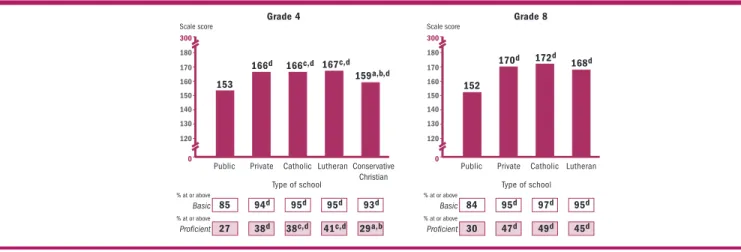
Comparison of the characteristicsof students in different types of pri-vate schools can indicate the extent to which they are serving different student populations. Characteristics of public school students are also shown for comparison. The student groups highlighted here include those defined by students’ race/eth-nicity, by the level of their parents’ education, by their eligibility to receive free or reduced-price school lunch, and by whether they have been identified as having a disability or as English language learners. The figures on these pages display the data from the 2003 grade 8 reading assessment, and are representative of findings across the subjects and grades. For student demographics in other grades and subjects, see the data appendix and the NAEP data tool, http://nces.ed.gov/ nationsreportcard/nde/.
Race/Ethnicity
At all grades and in all subject assessments included in this report, private schools overall had a higher percentage of White students than public schools, and public schools had higher percentages of Black and Hispanic students than pri-vate schools. Within the different types of private schools, Lutheran schools generally enrolled a higher percentage of White students than Catholic schools, and Catholic schools enrolled a higher percent-age of Hispanic students than Lutheran schools. Figure 1 shows the racial/ethnic distributions for the 2003 grade 8 reading assess-ment. The racial/ethnic categories shown—White, Black, Hispanic, and Asian/Pacific Islander—are mutually exclusive. Pacific Islander includes Native Hawaiian, and Hispanic includes Latino. Race Figure 1. Percentage distribution of students who participated in reading
assessment, by race/ethnicity and type of school, grade 8: 2003
a Signifi cantly different from Catholic schools. b Signifi cantly different from Lutheran schools. d Signifi cantly different from public schools.
NOTE: At each grade, approximately 1 percent of public school students were classifi ed as Ameri-can Indian/Alaska Native, while the proportion of students of the same race/ethnicity in private schools rounds to zero. Results are not shown for students whose race/ethnicity was "other." Data for Other Private schools are included in the overall Private data but not reported separately. SOURCE: U.S. Department of Education, Institute of Education Sciences, National Center for Edu-cation Statistics, National Assessment of EduEdu-cational Progress (NAEP), 2003 Reading Assessment.
77d 83a, d 72b, d 76d 61 11 8d 9d 9d 17 7d 5a,d 13b 9d 15 3 2d 4 5 4 0 10 20 30 40 50 60 70 80 90 100 Conservative Christian Catholic Lutheran Private Public Type of school Percent Asian/ Pacific Islander Hispanic Black White Grade 8
Figure 2. Percentage distribution of students who participated in reading assessment, by student-reported parents’ highest level of education and type of school, grade 8: 2003
d Signifi cantly different from public schools.
NOTE: Detail may not sum to totals because of rounding. Data for Other Private schools are included in the overall Private data but not reported separately. SOURCE: U.S. Department of Education, Institute of Education Sciences, National Center for Education Statistics, National Assessment of Educa-tional Progress (NAEP), 2003 Reading Assessment.
1d 1d 1d 7 2d 11d 9d 9d 18 11d 15 15d 13d 18 16 68d 70d 72d 46 65d 6d 5d 5d 11 7d 0 10 20 30 40 50 60 70 80 90 100 Grade 8 Conservative Christian Catholic Lutheran Private Public Type of school Percent Unknown Graduated from college Some education after high school Graduated from high school Less than high school
categories exclude Hispanic origin unless specified. Data for American Indian/Alaska Native students are included in the total but are not broken out separately due to small sample sizes.
Parents’ Highest Level of
Education
When eighth-grade students were asked to report their parents’ highest level of education, a greater percent-age of students in private schools compared to public schools reported that at least one parent had gradu-ated from college. No statistically significant differences in the highest level of education reported for at least one parent were found for any school category among the three types of private schools. Figure 2 provides data at grade 8 from the 2003 reading assessment.
Free and Reduced-Price
School Lunch
A student’s eligibility for free or reduced-price school lunch, which depends on family income, is often used as a proxy for a measure of socioeconomic status. In the 2003 reading assessment, 6 percent of students in all private schools combined were reported as eligible for free or reduced-price lunch at grade 4, and 11 percent at grade 8. Approximately 9 percent of fourth-graders in both Catholic and Lutheran schools were eligible. In contrast, public schools reported that 44 percent of their fourth-graders were eligible for free or reduced-price lunch.
However, these data should be interpreted with caution because of the high percentages of students in private schools for whom informa-tion was not available. Informainforma-tion was not available for about half of the fourth-grade students in Catholic and Lutheran schools. As seen in figure 3, the percentages of private school students for whom lunch-eligibility information was not available are also high for grade 8. In contrast, information was not available for only 6 percent of the eighth-grade students in public schools. As a result, this report does not present performance data by groups defined by eligibility for free and reduced-price school lunch.
KEY FINDINGS
✓
! Private schools enrolled a higher percentage of White students and a lower percentage of Black and Hispanic students than public schools.
! On average, Lutheran schools enrolled a higher percentage of White students than Catholic schools, and Catholic schools enrolled a higher percentage of Hispanic students than Lutheran schools.
! For all the assessments discussed in this report, at each grade, students in all types of private schools scored higher on average than public school students.
! Where differences existed at grades 4 and 8, students in Lutheran schools generally out-performed those in Conservative Christian schools.
Figure 3. Percentage distribution of students in reading, by students’ eligibility for free/reduced-price school lunch and type of school, grade 8: 2003
a Signifi cantly different from Catholic schools. b Signifi cantly different from Lutheran schools.
c Signifi cantly different from Conservative Christian schools. d Signifi cantly different from public schools.
1 For Conservative Christian schools, the percentage of students who were eligible for free/ reduced-price lunch rounds to zero. This percentage is signifi cantly different from the percentages in Catholic, Lutheran, and public schools.
NOTE: Detail may not sum to totals because of rounding. Data for Other Private schools are included in the overall Private data but not reported separately.
SOURCE: U.S. Department of Education, Institute of Education Sciences, National Center for Education Statistics, National Assessment of Educational Progress (NAEP), 2003 Reading Assessment.
10c,d 13c,d 11d 36 12a,b,d 39c,d 39c,d 29d 58 87a,b,d 50c,d 48c,d 60d 6 0 10 20 30 40 50 60 70 80 90 100 Grade 8 Conservative Christian1 Catholic Lutheran Private Public Type of school Percent Information not available Not eligible Eligible 5 STUDENT CHARA CTERISTICS
Figure 4. Percentage distribution of students in reading, by students with disabilities and English language learners, and by type of school, grade 8: 2003
d Signifi cantly different from public schools. 1 Students with disabilities.
2 English language learners.
3 The percentages of students who are English language learners round to zero in private schools overall and in Catholic and Lutheran schools. For private schools overall and for Catholic schools, these percentages are signifi cantly different from those for public schools.
NOTE: Detail may not sum to totals because of rounding. Data for Other Private schools are included in the overall Private data but not reported separately.
SOURCE: U.S. Department of Education, Institute of Education Sciences, National Center for Education Statistics, National Assessment of Educational Progress (NAEP), 2003 Reading Assessment.
2d 2d 3d 10 3d 98d 98d 97d 97d 90 0 10 20 30 40 50 60 70 80 90 100 Conservative Christian Catholic Lutheran Private Public Type of school Percent No Yes Grade 8 SD1 5 1d 99d 100d 100d 100 95 0 10 20 30 40 50 60 70 80 90 100 Conservative Christian Catholic3 Lutheran3 Private3 Public Type of school Percent No Yes Grade 8 ELL2
Students With Disabilities
(SD) and English Language
Learners (ELL)
Two other demographic variables that were analyzed for this report are the percentage of students with disabilities and the percentage of students identified as English lan-guage learners in the different types of schools. Figure 4 shows these percentages for eighth-graders par-ticipating in the reading assessment in 2003. Overall, less than 3 percent of grade 8 students enrolled in any private school were identified as SD or ELL. No significant differ-ences in this percentage were found among the three private school types discussed here. Public schools enroll a larger percentage of students who are SD, ELL, or both—15 percent.
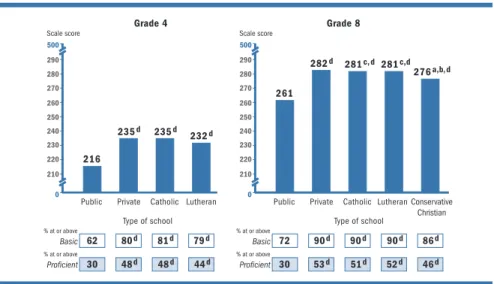
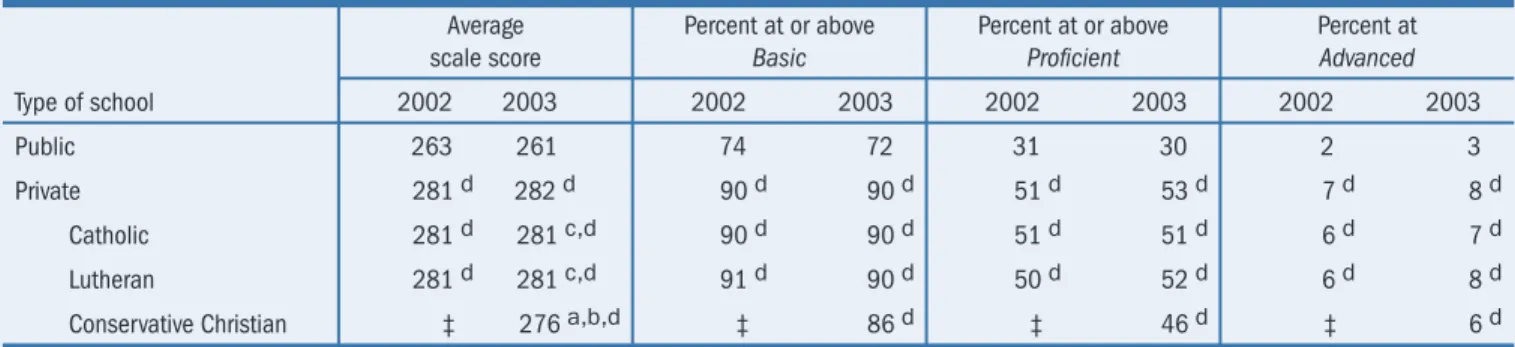
Figure 5. Average scale scores and achievement-level results in reading, by type of school, grades 4 and 8: 2003
a Signifi cantly different from Catholic schools. b Signifi cantly different from Lutheran schools.
c Signifi cantly different from Conservative Christian schools. d Signifi cantly different from public schools.
NOTE: The NAEP reading scale ranges from 0 to 500. Data for Other Private schools are included in the overall Private data but not reported separately.
SOURCE: U.S. Department of Education, Institute of Education Sciences, National Center for Education Statistics, National Assessment of Educational Progress (NAEP), 2003 Reading Assessment.
216 235d 235d 232d 62 80d 81d 79d 30 48d 48d 44d 250 220 0 500 230 240 260 Scale score Grade 4 % at or above Basic % at or above Proficient 210 270
Public Private Catholic Lutheran
261 282d 281c, d 281c,d 276a,b, d 72 90d 90d 90d 86d 30 53d 51d 52d 46d 250 220 0 500 230 240 260 Scale score Grade 8 % at or above Basic % at or above Proficient 210 270 280 290 280 290 Public Conservative Christian Lutheran Catholic Private Type of school Type of school
Few differences in performance were found among the three types of private schools. Where differences were found, students in Lutheran schools generally outperformed their counterparts in Conservative Christian schools. With some excep-tions, no significant differences were found between the performance of students in Lutheran schools and Catholic schools. Students in Catholic schools outperformed students in Conservative Christian schools in three of the grade/subject combinations.
For each assessment discussed in this report at each grade, students as a whole in every category of private schools had a higher average score than their counterparts in public schools. In addition, higher percent-ages of students in most categories of private schools performed at or above Proficient and Basic compared to the percentages of public school students.
Reading Performance
As shown in figure 5, among the three types of private schools, there were no significant differences in reading performance at grade 4 in 2003. The average scale scores in 2003 for students at grade 8 in
both Catholic and Lutheran schools were higher than the average score for those in Conservative Christian schools.
Students in all types of private schools at both grades 4 and 8 had higher average reading scores in 2003 than students at the same grade in public schools. Also, higher percentages of students at grades 4 and 8 performed at or above Proficient and at or above Basic in reading in all private schools combined, as well as in all the sub-categories of private schools, than in public schools. No significant differences in these percentages were found among the three types of pri-vate schools at either grade.
Performance of Students in Private Schools
7
STUDENT
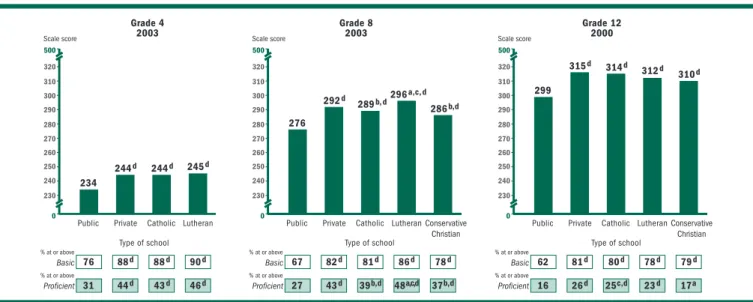
Figure 6. Average scale scores and achievement-level results in mathematics, by type of school, grades 4, 8, and 12: 2000 and 2003
a Signifi cantly different from Catholic schools. b Signifi cantly different from Lutheran schools.
c Signifi cantly different from Conservative Christian schools. d Signifi cantly different from public schools.
NOTE: The NAEP mathematics scale ranges from 0 to 500. Data for Nonsectarian and Other Religious schools for 2000 and data for Other Private schools for 2003 are included in the overall Private data for those years but not reported separately.
SOURCE: U.S. Department of Education, Institute of Education Sciences, National Center for Education Statistics, National Assessment of Educational Progress (NAEP), 2000 and 2003 Mathematics Assessments. 234 244d 244d 245d 76 88d 88d 90d 31 44d 43d 46d 270 240 0 500 250 260 280 Scale score Grade 4 2003 % at or above Basic % at or above Proficient 230 290
Public Private Catholic Lutheran
276 292d 289b, d296 a,c, d 286b,d 67 82d 81d 86d 78d 27 43d 39b,d 48a,c,d 37b,d 270 240 0 500 250 260 280 Scale score Grade 8 2003 % at or above Basic % at or above Proficient 230 290 Public Conservative Christian Lutheran Catholic Private 299 315d 314d 312d 310d 62 81d 80d 78d 79d 16 26d 25c,d 23d 17a 270 240 0 500 250 260 280 Scale score Grade 12 2000 % at or above Basic % at or above Proficient 230 290 300 310 320 300 310 320 300 310 320 Public Conservative Christian Lutheran Catholic Private Type of school Type of school Type of school
Mathematics Performance
Figure 6 shows that at grade 4 there were no significant differ-ences in mathematics performance between students in Catholic and Lutheran schools in 2003. At grade 8, students in Lutheran schools scored higher on average than stu-dents in Catholic and Conservative Christian schools in 2003. A greater percentage of eighth-graders in Lutheran schools also performed at or above Proficient in 2003 than their counterparts in Catholic and Conservative Christian schools. There were no significant differences in average scores among the three types of private schools at grade 12 in 2000.
In 2003, students at grades 4 and 8 in private schools overall, and in all types of private schools with reportable data, had higher average scores in mathematics than students
in public schools. Similar results were seen for grade 12 in 2000 (the most recent mathematics assess-ment for that grade). Also, higher percentages of students at all three grades in private schools overall, and in Catholic and Lutheran schools, performed at or above Proficient and at or above Basic, compared to their counterparts in public schools.
Science Performance
Figure 7 shows results from the most recent science assessment in 2000. Fourth-graders in Lutheran schools scored 8 points higher, on average, than their counterparts in Conservative Christian schools. No significant differences were seen among eighth-grade students in the three private school types. The average score of twelfth-graders in Catholic schools was 6 points higher than the average score of twelfth-graders in Lutheran schools. Also,
a greater percentage of Catholic school students at grade 12 than their peers in Lutheran schools performed at or above Basic. These twelfth-grade science results are the only overall results in which students in Catholic schools out-performed their Lutheran school counterparts.
In 2000, students at grades 4, 8, and 12 in all categories of private schools with reportable data had higher average scores in science than students in public schools. Higher percentages of students at grades 4 and 8 in all private school categories performed at or above Proficient in comparison to their counterparts in public schools. At grade 12, higher percentages of students in private schools overall and in Catholic schools than students in public schools performed at or above Proficient.
Figure 8. Average scale scores and achievement-level results in writing, by type of school, grades 4 and 8: 2002
a Signifi cantly different from Catholic schools. b Signifi cantly different from Lutheran schools.
c Signifi cantly different from Conservative Christian schools. d Signifi cantly different from public schools.
NOTE: The NAEP writing scale ranges from 0 to 300. Data for Other Private schools are included in the overall Private data but not reported separately.
SOURCE: U.S. Department of Education, Institute of Education Sciences, National Center for Education Statistics, National Assessment of Educational Progress (NAEP), 2002 Writing Assessment. 153 166d 166c,d 167c,d 159a,b,d 85 94d 95d 95d 93d 27 38d 38c,d 41c,d 29a,b 160 130 0 300 140 150 170 Scale score Grade 4 % at or above Basic % at or above Proficient 120 180 Public Conservative Christian Lutheran Catholic Private 152 170d 172d 168d 84 95d 97d 95d 30 47d 49d 45d 160 130 0 300 140 150 170 Scale score Grade 8 % at or above Basic % at or above Proficient 120 180
Public Private Catholic Lutheran Type of school Type of school
Figure 7. Average scale scores and achievement-level results in science, by type of school, grades 4, 8, and 12: 2000
a Signifi cantly different from Catholic schools. b Signifi cantly different from Lutheran schools.
c Signifi cantly different from Conservative Christian schools. d Signifi cantly different from public schools.
NOTE: The NAEP science scale ranges from 0 to 300. Data for Nonsectarian and Other Religious schools are included in the overall Private data but not reported separately.
SOURCE: U.S. Department of Education, Institute of Education Sciences, National Center for Education Statistics, National Assessment of Educational Progress (NAEP), 2000 Science Assessment. 147 162d 161d 166c,d 158b,d 62 82d 81d 85d 78d 27 41d 39d 46d 35d 160 130 0 300 140 150 170 Scale score Grade 4 % at or above Basic % at or above Proficient 120 180 Public Conservative Christian Lutheran Catholic Private 149 166d 165d 169d 162d 59 80d 79d 84d 75d 30 47d 45d 50d 40d 160 130 0 300 140 150 170 Scale score Grade 8 % at or above Basic % at or above Proficient 120 180 Public Conservative Christian Lutheran Catholic Private 145 160d 161b,d 155a,d 50 70d 71b,d 63a,d 17 28d 28d 22 160 130 0 300 140 150 170 Scale score Grade 12 % at or above Basic % at or above Proficient 120 180
Public Private Catholic Lutheran
Type of school Type of school
Type of school
Writing Performance
Figure 8 shows results from the most recent writing assessment in 2002. Average scores for fourth-graders in Catholic and Lutheran schools were higher than the average score for fourth-graders in Conservative Christian schools. The percentages of students at grade 4 who scored at or above Proficient were higher in
Catholic and Lutheran schools than in Conservative Christian schools. There were no significant differences in performance among the three pri-vate school types at grade 8.
In 2002, students at grades 4 and 8 in private schools overall, and in Catholic and Lutheran schools, had higher average scores in writing than students in the same grades in
public schools. Students at grade 4 in Conservative Christian schools scored higher on average than their counterparts in public schools. Higher percentages of fourth- and eighth-grade students in private schools overall, in Catholic, and in Lutheran schools performed at or above Proficient in writing in comparison to their counterparts in public schools.
9
STUDENT
Changes in Scores for Public and Private Schools
Changes in performance between2000 and 2003 can be examined for reading at grade 4 and mathematics at grades 4 and 8. Studying changes over time will help to determine which types of schools are making strides in improving student achieve-ment as well as provide an indicator of changing demographics. Changes in overall average scale scores are shown in this section. Additional results, including changes in achieve-ment-level performance and changes for particular student groups, can be found in the data appendix.
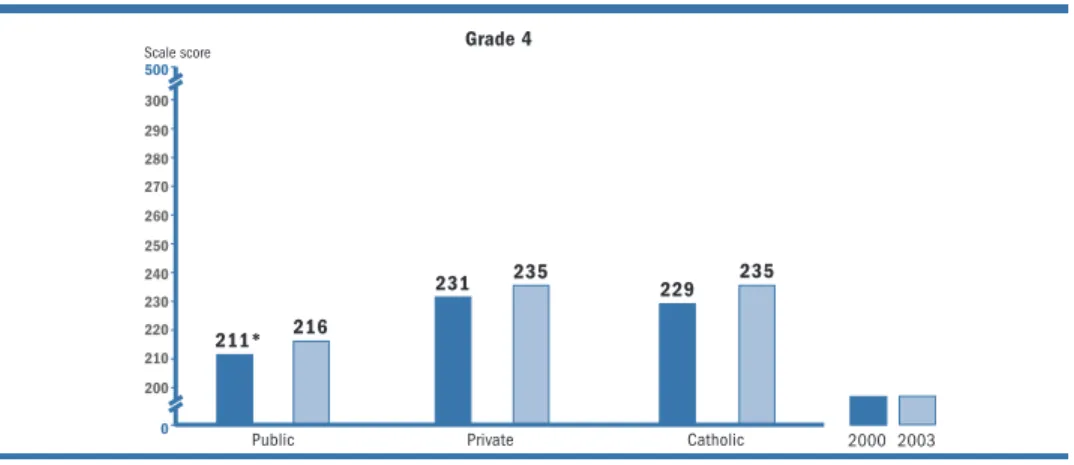
Grade 4 Reading Changes
As shown in figure 9, the apparent increase between 2000 and 2003 in the average reading score for private school students was not statistically significant. Catholic schools were the only private school type with reli-able data in both 2000 and 2003. The apparent increase of 6 points
between those two years was also not statistically significant. Public school students showed an improvement of 5 points in the average reading score during the same time. There was no statistically significant change in the reading score gap between public and private school fourth-graders from 2000, when it was 20 points, to 2003, when it was 18 points.
Grade 4 Mathematics
Changes
At grade 4, improvements in average mathematics scores between 2000 and 2003 were seen in almost all types of schools, including private overall, Catholic, Lutheran, and pub-lic schools (see figure 10). Average scores in Catholic and Lutheran schools increased by 7 and 4 points, respectively, while average scores for all private schools combined increased 6 points. Average scores in
public schools increased by 10 points in this same time period. The public-private score gap decreased from 14 points in 2000 to 10 points in 2003.
Grade 8 Mathematics
Changes
As shown in figure 11, average math-ematics scores increased between 2000 and 2003 for eighth-grade students in all private schools com-bined, in Catholic schools, and in public schools. The average score for Catholic schools increased by 6 points between 2000 and 2003. The apparent increase during that same time in average score for Lutheran schools was not statistically signifi-cant. The difference between average mathematics scores of eighth-grade students in public and private schools did not change significantly between 2000, when it was 15 points, and 2003, when it was 16 points.
2005 Private School Results
The 2005 results for private schoolstudents overall are not presented because the participation rates for this group were too low to produce valid and reliable estimates. Results are, however, available for students who attended two types of private schools: Catholic and Lutheran. Only these two private school types had suf-ficient participation rates to produce valid and reliable results.
In reading, the average scores for Catholic and Lutheran students were not significantly different in 2005 than in any previous assessment year in both grades 4 and 8. Likewise, the average mathematics scores for both types of schools did not differ signifi-cantly from those in previous years in either grade. No differences between 2005 and previous assessment years were seen in the percentage of
Reading Mathematics
Type of school Average scale score
Percentage of students
Average scale score
Percentage of students
At or above Basic At or above Proficient At or above Basic At or above Proficient
Grade 4 Catholic 234 80 46 244 88 43 Lutheran 231 77 44 245 89 47 Grade 8 Catholic 280 90 49 290 81 40 Lutheran 280 89 49 293 84 44
SOURCE: U.S. Department of Education, Institute of Education Sciences, National Center for Education Statistics, National Assessment of Educational Progress (NAEP), 2005 Reading and Mathematics Assessments.
students performing at or above Proficient or at or above Basic at either grade 4 or 8 in either subject. No differences were seen in 2005 between the two types of private schools on any measure.
These data and other 2005 data are available through the NAEP data tool (http://nces.ed.gov/nations reportcard/nde/.)
11
SCORE CHANGES
Figure 9. Average reading scale scores, by type of school, grade 4: 2000 and 2003
* Signifi cantly different from 2003.
NOTE: The NAEP reading scale ranges from 0 to 500. Data for Nonsectarian and Other Religious schools for 2000 and data for Other Private schools for 2003 are included in the overall Private data for those years but not reported separately. SOURCE: U.S. Department of Education, Institute of Education Sciences, National Center for Education Statistics, National Assessment of Educational Progress (NAEP), 2000 and 2003 Reading Assessments.
240 210 0 500 220 230 250 Scale score 200 260 280 270 290 300 211* 231 229 216 235 235
Public Private Catholic 2000 2003
Grade 4
Figure 10. Average mathematics scale scores, by type of school, grade 4: 2000 and 2003
* Signifi cantly different from 2003.
NOTE: The NAEP mathematics scale ranges from 0 to 500. Data for Nonsectarian and Other Religious schools for 2000 and data for Other Private schools for 2003 are included in the overall Private data for those years but not reported separately.
SOURCE: U.S. Department of Education, Institute of Education Sciences, National Center for Education Statistics, National Assessment of Educational Progress (NAEP), 2000 and 2003 Mathematics Assessments.
234 244 244 245 224* 238* 237* 241* 240 210 0 500 220 230 250 Scale score
Public Private Catholic Lutheran
200 260 280 270 290 300 2000 2003 Grade 4
Figure 11. Average mathematics scale scores, by type of school, grade 8: 2000 and 2003
* Signifi cantly different from 2003.
NOTE: The NAEP mathematics scale ranges from 0 to 500. Data for Nonsectarian and Other Religious schools for 2000 and data for Other Private schools for 2003 are included in the overall Private data for those years but not reported separately. SOURCE: U.S. Department of Education, Institute of Education Sciences, National Center for Education Statistics, National Assessment of Educational Progress (NAEP), 2000 and 2003 Mathematics Assessments.
272* 286* 284* 292 240 210 0 500 220 230 250 Scale score
Public Private Catholic Lutheran
200 260 280 270 290 300 276 292 289 296 2000 2003 Grade 8
Average Performance for Various Student Groups
12
NAEP gathers information related to academic achievement from school records and from question-naires administered to the students it assesses. The groups highlighted in this report include those defined by students’ race/ethnicity and by level of parents’ education. Further results for these groups, and information on results by gender, can be found in the data appendix for reading and mathematics and in the data tool for writing and science (http://nces. ed.gov/nationsreportcard/nde/.)
Race/Ethnicity
No significant differences were found in the performance of Black students or Hispanic students in the three types of private schools. In several instances, White students in Catholic and Lutheran schools had higher average scores than White students at the same grade in Conservative Christian schools. For instance, at grade 4, White stu-dents in Catholic schools had higher average scores on the 2002 writing assessment than White students in Conservative Christian schools. At grade 8, White students in Catholic schools scored higher, on average, on the 2003 reading assessment than White students in Conservative Christian schools. White eighth-grade students in Lutheran schools also had higher average mathematics scores in 2003 than their coun-terparts in Conservative Christian schools.
In private schools overall, in every case but one, students from each racial/ethnic category had higher average scores than their counter-parts in public schools in the most
recent assessment year. The one exception was in grade 4 mathemat-ics (shown in figure 12), where there was no statistically significant dif-ference between the average scores of Asian/Pacific Islander students in public schools (246) and in private schools overall (249) in 2003. White students and Hispanic students in Catholic schools scored higher on average than public school students of the same race/ethnicity in every subject and grade where the sample size was sufficient to produce a reliable estimate. Black students in Catholic schools had higher average scores than Black students in public schools in all subjects and grades, except in grade 4 mathematics and grade 4 writing, where the apparent differences were not statistically sig-nificant.
Again, as with the average scores, generally a greater percentage of students in private schools per-formed at or above Proficient than their counterparts in public schools, regardless of their racial/ethnic back-ground. However, there were some exceptions. For example, there was no statistically significant difference between the percentages of Asian/ Pacific Islander students performing at or above Proficient in mathemat-ics and writing in private schools overall compared to public schools at grade 4.
Parents’ Highest Level of
Education
Within each level of parents’ high-est educational attainment, there were almost no differences in the performance of students among
the three types of private schools. Figure 13 illustrates these findings with grade 8 data from the 2003 reading assessment. Additional data are provided in the data appendix. The exceptions were in grade 8 mathematics and grade 12 science. In 2003, the average mathematics score of eighth-graders in Lutheran schools who reported that at least one parent graduated from college was higher than the average scores of their counterparts in Catholic and Conservative Christian schools. In 2000, the average science score of twelfth-graders in Catholic schools who reported that one parent received some education after high school was higher than the aver-age score of students in Lutheran schools reporting the same parental education level.
In almost all cases, the average scores of students in all types of private schools were higher than those of their counterparts in public schools for each reported level of their parents’ education. Exceptions to this pattern occurred in math-ematics and science at grades 8 and 12, where there were no significant dif-ferences between the average scores of students in public and private schools for certain categories of parents' educa-tion.
In both eighth and twelfth grades and in all subjects included in this report, a greater percentage of stu-dents reporting that at least one parent graduated from college than their counterparts in public schools performed at or above Proficient.
13
STUDENT GR
OUP
PERFORMANCE
Figure 12. Average scale scores and achievement-level results in mathematics, by race/ethnicity and type of school, grade 4: 2003
! Interpret data with caution. The nature of the sample does not allow accurate determination of the variability of the statistic. d Signifi cantly different from public schools.
1 Data for Hispanic and Asian/Pacifi c Islander students attending Lutheran schools are not shown because sample size is insuffi cient to permit a reliable estimate. NOTE: The NAEP mathematics scale ranges from 0 to 500. Data for Other Private schools are included in the overall Private data but not reported separately. SOURCE: U.S. Department of Education, Institute of Education Sciences, National Center for Education Statistics, National Assessment of Educational Progress (NAEP), 2003 Mathematics Assessment. 221 231d 229d 62 76d 72d 15 24d 22 230 200 0 500 210 220 240 Scale score Hispanic1 % at or above Basic % at or above Proficient 190 250
Public Private Catholic
246 249 242 87 93 89 48 49 36 230 200 0 500 210 220 240 Scale score Asian/ Pacific Islander1 % at or above Basic % at or above Proficient 190 250
Public Private Catholic
243 248 d 248d 248d 87 92d 93d 93d 42 50d 50d 50 230 200 0 500 210 220 240 Scale score White % at or above Basic % at or above Proficient 190 250
Public Private Catholic Lutheran
216 221 d 222 227! d 54 62d 64 72! 10 13 13 16! 230 200 0 500 210 220 240 Scale score Black % at or above Basic % at or above Proficient 190 250
Public Private Catholic Lutheran Type of school
Type of school Type of school Type of school
Grade 4
Figure 13. Average scale scores and achievement-level results in reading, by student-reported parents’ highest level of education and type of school, grade 8: 2003
d Signifi cantly different from public schools.
1 Data for Catholic, Lutheran, and Conservative Christian are not shown because sample sizes are insuffi cient to permit reliable estimates of these categories for students whose parents’ reported education level is less than high school.
NOTE: The NAEP reading scale ranges from 0 to 500. Data for Other Private schools are included in the overall Private data but not reported separately.
SOURCE: U.S. Department of Education, Institute of Education Sciences, National Center for Education Statistics, National Assessment of Educational Progress (NAEP), 2003 Reading Assessment. 271 287d 285d 286d 282d 81 93d 93d 92d 90d 41 60d 57d 59d 52d 270 240 0 500 250 260 280 Scale score
Graduated from college
% at or above Basic % at or above Proficient 230 290 Public Conservative Christian Lutheran Catholic Private
Type of school Type of school
Type of school Type of school
245 263d 55 74d 13 34d 270 240 0 500 250 260 280 Scale score
Less than high school1
% at or above Basic % at or above Proficient 230 290 Public Private 253 268d 269d 271d 263d 65 81d 82d 84d 77 19 34d 34d 37 26 270 240 0 500 250 260 280 Scale score
Graduated from high school
% at or above Basic % at or above Proficient 230 290 Public Conservative Christian Lutheran Catholic Private 266 277d 277d 276d 275d 79 88d 88d 89d 86 32 46d 45d 47 43 270 240 0 500 250 260 280 Scale score
Some education after high school
% at or above Basic % at or above Proficient 230 290 Public Conservative Christian Lutheran Catholic Private Grade 8
14
Changes in Average Scores for Racial/Ethnic Groups
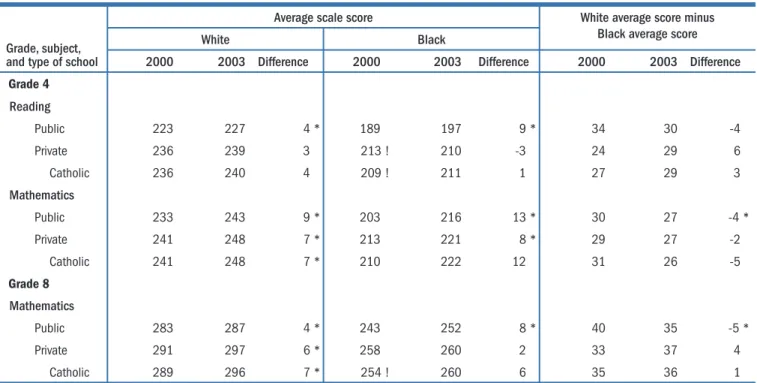
Because of the strong nationalemphasis on reducing the achieve-ment gaps between minority and nonminority students, it is infor-mative to examine the changes in average scores by race/ethnicity (see tables 2 and 3). This section examines the White – Black and White – Hispanic score gaps in private schools. Because the sample sizes for Black and Hispanic stu-dents in private schools were small, resulting in large standard errors, tests of statistical significance may show no difference in cases where the differences appear large.
Grade 4 Reading
No significant improvements in average reading scores for any racial/ethnic group were detected for any type of private school between 2000 and 2003. For public school students, average reading scores increased between 2000 and 2003 at grade 4 for Whites (by 4 points), Blacks (by 9 points), and Hispanics (by 11 points).
Comparing the White – Black and White – Hispanic reading score gaps between 2000 and 2003 showed no statistically significant change in any type of school, with one exception. The White – Hispanic score gap decreased by 7 points between 2000 and 2003 for public school students.
Grade 4 Mathematics
The average mathematics scores in private schools overall increased for White, Black, and Hispanic fourth-graders between 2000 and 2003. Average scores for White and Hispanic fourth-graders in Catholic schools also increased between 2000 and 2003. In Lutheran schools, the average score for White students increased by 6 points from 2000 to 2003. The apparent changes in the White – Black and White – Hispanic score gaps between 2000 and 2003 were not statistically significant in any of the types of private schools. In contrast, the score gaps between White and Black students and between White and Hispanic stu-dents in public schools decreased between 2000 and 2003.
Grade 8 Mathematics
Average scores for White eighth-graders increased between 2000 and 2003 in private schools overall and in Catholic schools. In public schools, average mathematics scores for White, Black, and Hispanic eighth-graders increased between 2000 and 2003, by 4, 8, and 6 points, respectively. The White – Black score gap decreased between 2000 and 2003 in public schools only. No statistically significant changes in the score gaps between White and Hispanic students were detected for any type of school.
15
Table 3. Average scale scores and score gaps for White and Hispanic students in reading and mathematics, by type of school, grades 4 and 8: 2000 and 2003
! Interpret data with caution. The nature of the sample does not allow accurate determination of the variability of the statistic. * Statistically signifi cant change.
NOTE: The NAEP reading and mathematics scales each range from 0 to 500. Score differences are calculated based on differences between unrounded average scale scores. Data for Nonsectarian and Other Religious schools for 2000 and data for Other Private schools for 2003 are included in the overall Private data for those years but not reported separately.
SOURCE: U.S. Department of Education, Institute of Education Sciences, National Center for Education Statistics, National Assessment of Educational Progress (NAEP), 2000 and 2003 Reading and Mathematics Assessments.
Table 2. Average scale scores and score gaps for White and Black students in reading and mathematics, by type of school, grades 4 and 8: 2000 and 2003
! Interpret data with caution. The nature of the sample does not allow accurate determination of the variability of the statistic. * Statistically signifi cant change.
NOTE: The NAEP reading and mathematics scales each range from 0 to 500. Score differences are calculated based on differences between unrounded average scale scores. Data for Nonsectarian and Other Religious schools for 2000 and data for Other Private schools for 2003 are included in the overall Private data for those years but not reported separately.
SOURCE: U.S. Department of Education, Institute of Education Sciences, National Center for Education Statistics, National Assessment of Educational Progress (NAEP), 2000 and 2003 Reading and Mathematics Assessments.
Grade, subject, and type of school
Average scale score White average score minus Black average score
White Black
2000 2003 Difference 2000 2003 Difference 2000 2003 Difference
Grade 4 Reading Public 223 227 4 * 189 197 9 * 34 30 -4 Private 236 239 3 213 ! 210 -3 24 29 6 Catholic 236 240 4 209 ! 211 1 27 29 3 Mathematics Public 233 243 9 * 203 216 13 * 30 27 -4 * Private 241 248 7 * 213 221 8 * 29 27 -2 Catholic 241 248 7 * 210 222 12 31 26 -5 Grade 8 Mathematics Public 283 287 4 * 243 252 8 * 40 35 -5 * Private 291 297 6 * 258 260 2 33 37 4 Catholic 289 296 7 * 254 ! 260 6 35 36 1 Grade, subject, and type of school
Average scale score White average score minus Hispanic average score
White Hispanic
2000 2003 Difference 2000 2003 Difference 2000 2003 Difference
Grade 4 Reading Public 223 227 4 * 188 199 11 * 35 28 -7 * Private 236 239 3 215 220 5 21 19 -2 Catholic 236 240 4 211 ! 219 8 25 21 -4 Mathematics Public 233 243 9 * 207 221 14 * 26 21 -5 * Private 241 248 7 * 220 231 11 * 21 17 -4 Catholic 241 248 7 * 217 229 11 * 24 20 -4 Grade 8 Mathematics Public 283 287 4 * 252 258 6 * 31 28 -3 Private 291 297 6 * 273 274 1 18 23 5 Catholic 289 296 7 * 271 272 1 18 24 6
16
Technical and Data Appendix
2005, the participation rates of private schools overall did not meet the participation rate standard, and therefore their results are not reported.
See http://nces.ed.gov/nationsreportcard/nrc/ reading_math_2005/s0089.asp for information on 2005 participation rates.
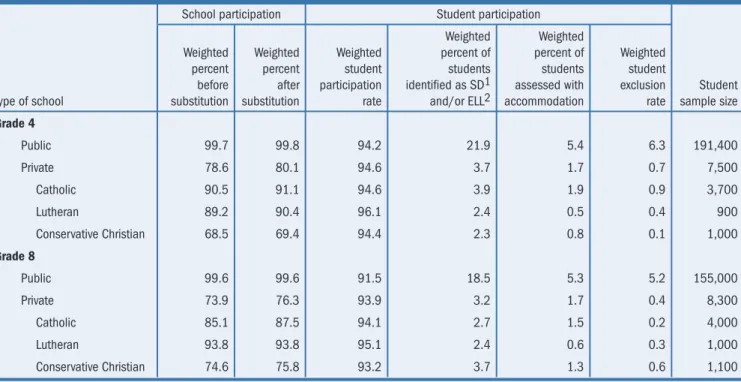
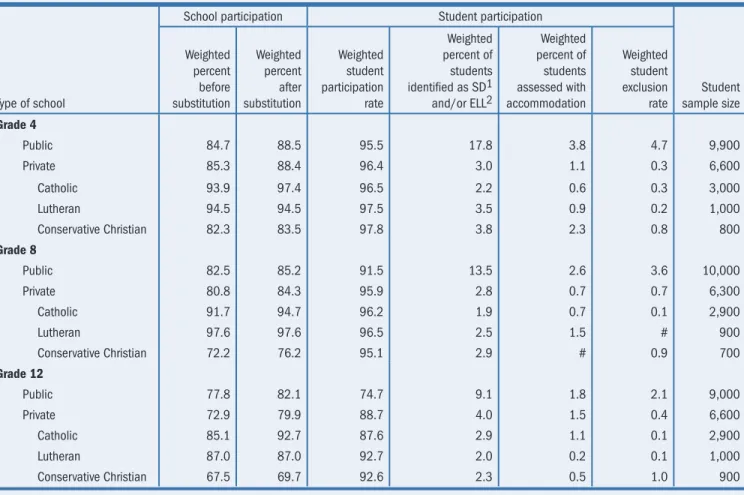
Assessed Students
Every effort is made to ensure that all sampled students who are capable of participating in the assessment are assessed. A sampled student who is identified by the school as a student with a disability or as an English language learner may be tested with accommodations allowed by NAEP; students so iden-tified may be excluded from the assessment if they do not meet criteria for inclusion established by NAEP. Tables A-1 through A-4 display the participation and exclusion rates for all four subjects. At grade 4, public schools in the national sample excluded 4 percent of students in mathematics and 6 percent in read-ing in 2003. At grade 8, the exclusion rates in public schools were 4 percent in mathematics and 5 percent in reading in 2003. The comparable exclusion rates in private schools were less than 1 percent in both subjects at both grades.
Definitions of Variables
Information on race/ethnicity is presented for White, Black, Hispanic, and Asian/Pacific Islander students based on school records. Results for other races or ethnicities are not presented in the body of the report because sample sizes were too small to meet reporting standards. Data on American Indian/Alaska Native students are presented in the data appendix when available.
Parents’ highest level of education is defined by the highest level reported by eighth-graders and twelfth-graders for either parent. Fourth-twelfth-graders’ replies to this question were not reported because their respons-es in previous studirespons-es were highly variable, and a large percentage of them chose the “I don’t know” option.
NAEP Sampling Procedures
The schools and students participating in NAEP assessments are chosen to be nationally representative. The results from the assessed students are combined and weighted to provide accurate estimates of overall public and private school performance. The sampling weights are also used to adjust for nonresponse and in estimating percentages of students in various student groups. To obtain reliable data on the private school students, private schools were oversampled beginning with the 2000 assessment. Scores were then weighted appropriately to provide national estimates.
School Participation Rates
In order to ensure unbiased samples, NCES and NAGB standards require that the weighted school participation rate before substitution of replacement schools be 70 percent or higher. All data presented in this report are based on samples meeting this stan-dard. Sample sizes and participation rates are shown in tables A-1 through A-4. Samples for Conservative Christian schools did not meet the participation rate standard in the following assessments, and therefore their results are not reported for these assessments: grade 8 mathematics and grade 12 science in 2000; grades 8 and 12 reading and writing in 2002; grade 4 reading and mathematics in 2003; and grades 4 and 8 reading and mathematics in 2005.
In 2003, the participation rates of private schools overall were below 85 percent at grades 4 and 8, so nonresponse bias analyses were conducted. The nonresponse bias analyses showed significant differ-ences between responding and nonresponding private schools in terms of reporting group, census region, and racial/ethnic composition of the schools at both grades. Nonresponse weighting adjustments have completely accounted for the differences in reporting group, and largely accounted for the differences in census region. These adjustments are unlikely to have fully accounted for differences in race/ethnicity. In
Reference List
Braswell, J.S., Dion, G.S., Daane, M.C., and Jin, Y. (2005). The Nation’s Report Card: Mathematics 2003
(NCES 2005-451). U.S. Department of Education, National Center for Education Statistics. Washington, DC: U.S. Government Printing Office.
Broughman, S.P., and Pugh, K.W. (2004). Characteristics of Private Schools in the United States: Results From the 2001–2002 Private School Universe Survey (NCES 2005-305). U.S. Department of Education. Washington, DC: National Center for Education Statistics.
Donahue, P.D., Daane, M.C., and Jin, Y. (2005). The Nation’s Report Card: Reading 2003. (NCES 2005-453). U.S. Department of Education, National Center for Education Statistics. Washington, DC: U.S. Government Printing Office.
17
Interpreting Statistical Significance
The differences between statistics—such as average scale scores and percentages—that are discussed in this report are calculated using statistical measures known as standard errors. Standard errors for the NAEP scores and percentages presented in this report are available on the NAEP website (http://nces.ed.gov/nationsreportcard/nde/). Comparisons are based on statistical tests that con-sider both the size of the differences and the standard errors of the two statistics being compared. Estimates based on smaller student groups are likely to have relatively larger standard errors than estimates based on larger student groups, all other things being equal. As a consequence, a numerical difference that seems large may not be statistically significant. Furthermore, differences of the same magnitude may or may not be statistically significant, depending upon the size of the standard errors of the statistics. For example, a 5-point difference between male and female students may be statistically significant, while a 5-point differ-ence between White and Hispanic students may not
be. The differences described in this report have been determined to be statistically significant at the .05 level with appropriate adjustments for multiple com-parisons. The .05 level of significance means that one can say with 95 percent certainty that the difference is not due to chance.
In the tables and charts of this report, the symbols (a), (b), (c), (d), and (*) are used to indicate that a score or percentage is significantly different from another. The symbol (!) is used to indicate that the nature of the sample—its size or its variance—does not allow accurate determination of the variability of the statistics, and that any significance tests involving these statistics should be interpreted cautiously. Data on the percentage of students reaching Advanced are not shown in most tables because the small sample sizes limit what can be reported. More information on these data can be found using the data tool at http://nces.ed.gov/nationsreportcard/nde/.
TECHNICAL