CHAPTER I
INTRODUCTION
This chapter discusses: (a) Background of the Study, (b) Research Problem, (c) Objective of the Study, (d) Hypothesis of the Study, (e) Assumption, (f) Scope and Limitation, (g) Significance of the Study, (h) Definition of Key Terms.
A. Background of the Study
English Competence is absolutely essential for students of English Study Program which includes writing, reading, listening, and speaking which need to be developed. Writing as one of the four basic skills of language is very central role. By having a good competence in writing, students who have been prepared to be professional teacher candidates, be able to carry out the tasks of learning with good and quality. Writing skills are specific abilities which help writers put their thoughts into words in a meaningful form and to mentally interact with the message. According to Ivanic (1998, p.181), writing is not just about conveying content but also about the representation of self. So, the researcher concludes that writing is a way to product language that comes from our thought. By using writing, people can share idea, feeling or anything that exist in mind.
In English learning, the development of writing skills should also be designed so that the learning process has the language skills to write good and right. In general,
the process of mastering writing will take quite a long and intensive rehearsals. Bereiter and Scardamalia (2002, p.29) reminded that only some people who master the skill of writing. There are differences between the knowledge telling and the knowledge transforming the ideas in writing skills. In addition, the writing skills not only make students fluent, both in grammar, coherent organization, the selection of appropriate vocabulary, and conventions of written language and mechanical aspects, but also consider the factors that may affect the success of a study. These factors can be derived from learners themselves (internal factors) and external learners (external factor). From the inside of learners, internal factors may be either gender, motivation, interests, attitudes, personality, the manner or style of learning, and others, while external factors may include demands from parents, school factors and teachers, and the surrounding environment.
Among the factors mentioned above, researcher focused this study on internal factors, particularly the manner or learning style. In addition, factors manner or learning style, affect the language development, one of which is the culture of reading. Everyone (including students) can familiarize themselves as good readers. By custom, a person can gain a variety of experience and knowledge to arrive at the present stage of its development is a direct result of reading great books. The statement above is confirmed again by Lin Yut'ang (1937) a famous Chinese philosopher who stated that people who do not have good reading habits, to be imprisoned in his world, both in terms of time and space. This means people can only know the things that happened in a nearby neighborhood and only relates to certain
people only. Thus the more active a person reads, the higher the knowledge gained, not imprisoned in his world.
Most previous studies suggested that individuals who read a lot will have a level of creativity and knowledge than those who do not read much. In fact, as far as the researcher‟s observation both at school and college, it is found that it can be seen that students who do not read a lot, so do not have the creativity and knowledge in students' writing ability level of creativity. Therefore, the level of creativity in the students‟ writing ability can be influenced by many factors such as experience, hears, watch and so on. Bereiter and Scardamalia (1987) (cited in Weigle, 2002, p.29) gives a description of the paradoxes in the writing process. On the one hand, a person who is able to read and write will be able to write fluently in the first language. On the other hand, nobody can be a good writer even though has been mastered the language. This is because a person requires special skills to master the skill of writing.
Based on the exposure above, the researcher conducted research on writing skill, it is done to determine whether there is correlation or not between the level of students‟ writing ability who read a lot and do not read a lot. This study conducted at sixth Semester English Education Study Program Students of IAIN Palangka Raya who programmed Paragraph Writing, Essay Writing and Argumentative Writing.
Therefore, the researcher is interested to know about “The Correlation between Reading Frequency and Writing Ability at English Education Study Program Students of IAIN Palangka Raya.”
From the title above, the researcher has some reasons to conduct research at IAIN Palangka Raya especially on English Education Study Program Students. The firstly, the researcher chosen IAIN Palangka Raya because there is no research about reading frequency on writing ability which is conducted at IAIN Palangka Raya. The second, the researcher chosen the research about reading frequency on writing ability because the researcher want to measure the correlation of reading frequency which the specifiable in writing ability, this study aims to obtain perian on: (1) the level of creativity, literacy rates, and the level of the sixth semester students writing skills; (2) there is a relationship between the level of students' writing ability of read more and not; (3) the presence or absence of interaction correlations of level reading frequency and the ability to write.
B. Research Problem
The problem of the study is:
a. Is there any significant correlation between Reading Frequency and Writing Ability at English Education Study Program Students of IAIN Palangka Raya? C. Objective of the Study
The objective of the study is:
a. To measure the correlation between Reading Frequency and Writing Ability at English Education Study Program Students of IAIN Palangka Raya.
D. Hypothesis of the Study
By paying attention to the formulation of the problem, the writer formulates hypothesis as follows:
1) Ha: There is significant correlation of reading frequency on writing ability. Ho: There is no significant correlation of reading frequency on writing ability. E. Assumption
The researcher assumes that there is a significant correlation between Reading Frequency and Writing Ability at English Education Study Program Students of IAIN Palangka Raya.
F. Scope and Limitation
This study belonged to correlation study (non-experimental) which used quantitative method. It focused on The Correlation between Reading Frequency and Writing Ability at English Education Study Program Students of IAIN Palangka Raya. The researcher used only the questionnaire to determine the students‟ reading frequency which applied in their writing ability and the researcher used the documentation to determined students' writing skills achievement. This research organized at English Education Study Program of IAIN Palangka Raya. The population of this study taken from the sixth semester of English Education Study Program Students who programmed Paragraph Writing, Essay Writing and Argumentative Writing totally about 74 students.
G. Significance of the Study
The benefits expected by the researcher of this study as follows: 1. Theoretically:
The result of this study is to confirm the theories that there is the relation of Reading frequency on writing ability.
2. Practically:
For the lecturer is to increase the completeness of the references and broaden lecturer Writing subjects.
Meanwhile, for students, this study can open the mind of the students towards the importance of reading to improve their writing performance, it is able to help the students to see the difficulties in writing that they do not have the habit to read, and it can motivate them to read more.
For the researcher, this study is expected to be used as an additional references and a guideline for similar research.
H. Definition of Key Terms
There are several definitions of the key terms in this research. There are Correlation, reading frequency, and writing ability.
1) Correlation
Correlation means a connection between two things in which one thing changes as the other does. In other words, correlation attempts to determine the extent and the direction of the relationship between two or more variables (Ary, et al., 2010, p. 639).
In this case, it investigated the interrelation between two variables; they are reading frequency on writing ability of English Education Study Program Students at IAIN Palangka Raya.
2) Reading Frequency
Frequency is the rate at which something happens or is repeated. Reading is a process of association letters, translation, reading and understanding the meaning of the content. Lin Yut'ang (1937) is a famous Chinese philosopher who stated that people who do not have good reading habits, to be imprisoned in his world, both in terms of time and space. This means people can only know the things that happened in a nearby neighborhood and only relates to certain people only.
So it can be concluded that the reading frequency is the rate of people's activity in reading book which could gain a variety of experience and knowledge, morality, civilization, culture, science and technology can come to the level of its development.
Thus, the more active a person reads, the higher the knowledge gained, not imprisoned in his world.
This study is conducted to know the differences between read a lot and do not read a lot in writing ability are taken from questionnaires.
3) Writing Ability
Writing skills are specific abilities which help writers put their thoughts into words in a meaningful form and to mentally interact with the message. Writing ability is the skill to transfer what is in the writer‟s mind. Writing is not just about conveying content but also about the representation of self. According to Klein (1985) said that writing is the ability to put pen and paper to express ideas
through symbols, this way, representations on the paper will have meaning and content that could be communicated to other people by the writer. Writing skills are specific abilities which help writers put their thoughts into words in a meaningful form and to mentally interact with the message (Ivanic, 1998, p181).
Since writing ability is multifaceted in its own right, any approach and accordingly its definition of writing ability cannot be thorough and comprehensive in its own right. Each approach and definition have its own merits and demerits, depending on which facet it mainly focuses on among complex aspects of writing.
Writing is a series of related text-making activities: generating, arranging and developing the idea in sentences: drafting, shaping, rereading the text, editing and revising (Smalley and Ruetten, 2001, p.13). The concepts of ability refer to a general trait of an individual that may facilitate the learning of a variety of specific skills (Skill, 1972, p.38). Based on some definition above, it can be understood that writing ability is the power or skill to do writing and it can be gotten and mastered by practicing. In the present study, writing ability is operationalized as students‟ score of the writing test.
In this study, the result of students‟ writing abilities is taken from the average score of students‟ written product.
CHAPTER II
REVIEW OF RELATED LITERATURE
This part presents the review of the literature review. This chapter discusses: (a) Related Studies, (b) Teaching of Reading, (c) Reading Frequency, (d) Teaching of Writing, (e) The Nature of Writing, (f) Kind of Writing, (g) Writing Process, (h) Writing Ability, (i) Correlation.
A. Related Studies
There are some researches that are related with this study. The first is by Zorbaz (2015) entitled “Effects of Variables about Reading-Writing Frequency on the Education Faculty Freshmen's Writing Apprehension Levels”. This findings of the study revealed that 12.5 % of the students had high writing apprehension, 55.6 % of them had moderate, and 31.9 % of them had low apprehension. The students, who kept diaries or conducted writing activity, had low apprehension. The students, who had taken more writing assignments during their secondary and high school education, had lower levels of writing apprehension. The findings also revealed that those who had read 21 to 50 or 11 to 20 books in the last one year had lower levels of writing apprehension compared to those who had not read any book at all during the same time frame.
Second research related with this study is by Maula (2015) entitled: “The Correlation between Students‟ reading habit and their ability of writing narrative
text”. The findings also revealed that there was a positive correlation between Students‟ reading habit and their ability of writing narrative text.
Third research related with this study is by Ernaria (2012) entitled “The relationship between reading comprehension skills with the ability to write a summary of class VIII Semester II SMP N 1 Gunung Talang”. This findings of the study revealed that there is a relationship between reading comprehension skills by writing a summary of the eighth grade students of SMP N 1 Gunung Talang. In other words, the higher the reading comprehension skills of students so the higher the students' ability to write summaries.
Fourth research related with this study is by Simaremare (2010) entitled “The Correlation of Reading Habit with the ability to write Article Students Majoring in Indonesian Language and Literature State University Medan”. The research found, there was a positive and significant reading habit with students writing articles Indonesian Language and Literature, State University of Medan.
The last related research is by Donaldson (2010) entitled “The Fourth Grade Slump: The Relationship between Reading Attitudes and Frequency of Reading”. The research found, there was a correlation between overall reading attitude, and overall reading frequency.
Based on the previous studies above, the researcher has some different studies as follows:
1. Zorbaz (2015) examined the writing apprehension levels of the faculty of education freshman students based on the relevant variables about
reading-writing frequency. Whereas, this study the researcher measured the relationship of reading frequency on writing ability.
2. Maula (2015) researched students‟ reading habit with asked the student write the narrative text of the eleventh graders at SMAN 1 Kajen in academic year of 2014/2015. Whereas, the present study the researcher measured reading frequency students with only gave the questionnaire to the students and the result of the questionnaires were correlated with students‟ average writing score at IAIN Palangka Raya in academic year of 2014/2015.
3. Ernaria (2012) researched reading comprehension skill with asked the students wrote the summary. Whereas, the present study the researcher measured reading frequency students with gave the questionnaires to the students.
4. Simaremare (2010) described about the correlation of reading habit with the ability to write article students who the research instrument used was a questionnaire form an objective reading ability as much as 40 questions form and test the ability to create articles of 500 words. Whereas, the present study the researcher researched about the correlation of reading frequency on writing ability who researcher took average score of the students‟ writing skill.
5. Donaldson (2010) measured the relationship between reading attitudes and frequency of reading on the fourth grade slump. The results were divided into the categories of academic and recreational reading for attitude and frequency
Whereas, this study the researcher measured the relationship between reading frequency and writing ability on English Education Study Program of IAIN Palangka Raya.
B. Teaching of Reading
As teachers of English as a foreign language, we are often tempted to teach reading in order to improve the student‟s mastery of English, to enable them to develop their reading skill. The teacher should know the rationale of the nature of reading and if implication in teaching techniques. They should also be able to employ certain techniques to improve the student‟s reading ability.
Comprehending a text is an interactive process between the reader‟s background knowledge and the text. As the psycholinguistic views that reading is “a psycholinguistic guessing game” which involves interaction between thought and language. By guessing readers predict the content of the text. This means that their background knowledge is important to help understand the text.
Classroom reading activities, therefore, should be handled in such a way that learners are able to improve their text-based information processing as well as their knowledge-based information processing. The former concerns with the activities which can develop the learner‟s skill on language, whereas the letter provides activities to improve the knowledge background which helps them understand the text. (Fauziaty, 2002, p.144-145).
C. Reading Frequency
Frequency is the rate at which something happens or is repeated (Hornby, 1995, p.539).
Reading is an aspect associated with literacy. However, the reading process is not simple in its nature. It does not merely involve recognizing a single character and pronouncing it correctly or to recognize and pronounce a few characters that are arranged in a particular manner, but more importantly, it is the ability to understand the meaning of these arrangements.
According to Adetunji (2007):
“Reading has been described as the act of translating symbols or letters into words or sentences that have to mean to an individual. It is also the understanding of what is seen in text, which is the ability of the reader to capture incoming visual information, a process that information and obtain meaning from it. Prior to that, Lyman (1976) mentioned that reading is an essential and dynamic means of communication. It is important to awareness, knowledge, and information.”
Reading has a broad sense. Lexical reading means acquiring or reading information from a text that is read. According to Kolker (1983, p.3): “reading is a process of communication between the reader and the author of the written language. The essence of this reading he thinks there are three things, namely affective, cognitive, and language.” Correspondingly Rosenblatt (1991, p.267) argued that “reading is a transactional process that includes steps for reading the reader constructs meaning through interaction with the text reading.”
“Reading is the process undertaken by the reader to get the message intended by the author through the medium of words / written language. A process that has demanded that the word is a unity will be seen in a glimpse and that the meaning of the word will be known.”
Shafi (1999, p.7) also said that “Reading is essentially a process called physical or mechanical process, some form of psychological thinking activities in processing information.” Furthermore, Sutan (2004, p.2) said that “reading is an activity browse through, understand to explore the different symbols. Symbols can be sequences of letters in a writing or read even images such as floor plans, graphs, and maps.”
According to Somadayo (2011, p.4): "Reading is an interactive activity for picking as well as understand the meaning contained in writing material.”
a. Anderson in Tarin suggested a number of purposes, namely reading, Reading to find or know of the discovery made by the hero.
b. Reading to find out why it is good and interesting topics. c. Reading to find or know what happens in each part of the story. d. Reading to find and to know why the characters feel like their way. e. Reading to find and to know what is unusual.
f. Reading to discover whether the hero succeeds or live with a certain size. g. Reading to find out how the figures change (Tarigan, 1993, p.9).
From the above opinion, it can be concluded that reading is a process understand form into something meaningful. Reading is a process that is performed and used by someone to obtain the messages conveyed through the media writer language words. As a process, reading is a part of human life that cannot be
separated, because whoever the person without doing the reading will experience the emptiness of science. To help students understand what they read he can write back. Writing in college requires to the terms of in terms of language, content, and technical writing. So in addition to a process of habituation and training, the student must have knowledge of the material to be written.
D. Teaching of Writing
Fauziati (2002, p.151) stated that there are classroom techniques in teaching writing, such as: instruction should be focused on the writing process. This means that students can initiate into the process, and the teacher should prepare to intervene in the students writing processes with suggestion, and correction to help the students overcome difficulties encountered in each of the stages.
“A simplistic view of writing would assume that written language is simply the graphic representation of spoken language…” (Brown, 2001, p.335). Writing is more complex than this; hence writing pedagogy is important, as Brown (2001, p.335) stated by claiming that writing is “as different from speaking as swimming is from walking”. This is supported and developed by Hedge (2005, p.10), who stated that writing is more than producing accurate and complete sentences and phrases. She states that writing is about guiding students to: “produce whole pieces of communication, to link and develop information, ideas, or arguments for a particular reader or a group of readers…”. Therefore, effective writing requires several things: a high degree of organization regarding the development and structuring of ideas,
information and arguments. Furthermore, Hedge (2005, p.7) mentioned features such as: a high degree of accuracy, complex grammar devices, a careful choice of vocabulary and sentence structures in order to create style, tone and information appropriate for the readers of one‟s written text. All these points make the teaching of writing a complex matter, since all this should be taken into consideration for efficient learning of writing strategies.
Cushing Weigle (2002, p.14) looked at the writing ability from several perspectives. For instance, she views it as a social and cultural phenomenon and as a cognitive activity. These two aspects are briefly presented below.
1) Writing as a Social and Cultural Phenomenon
Our lives involve all kinds of writing. Notes on the fridge, journalistic writing, greeting cards, to mention a few-all fill the purpose of communicating and bringing messages across. This is one of the criteria for writing being a social and cultural phenomenon. Cushing Weigle referred to Hayes (2002, p.19): “Writing is also social because it is a social artifact and is carried out in a social setting. What we write, how we write and who we write to is shaped by social convention and… …social interaction”. Something to bear in mind regarding the cultural aspect of teaching writing in the EFL classroom is that there could be cultural differences when it comes to structure and discourse. As an example of this, Brown (2001, p.338) brought up Kaplan‟s study, which he sums up by claiming that learners of English have predispositions that come from their native languages, when it comes to structuring their writing. Cushing
Weigle (2002, p.20-21) brought up the same study as an example of writing as a cultural phenomenon.
2) The Cognitive Aspect
Throughout the years, many researchers have suggested models for writing as processes of cognitive activities. What is going on mentally when a writer creates a piece of text, a paragraph? What are the thoughts? Cushing Wiegle (2002, p.22) wrote that research has been done in order to "gain insight into the mental activity and decision-making process of the writer as he or she carries out a writing task". Moreover, Cushing Weigle (2002, p.22-23) wrote that this line of research shows that writers spend a lot of time planning and editing their work for both organization and content, as well as taking the audience into consideration.
Stromquist (2007, p.32) referred to “Hayes-Flower model”4 from 1981, "A Cognitive Process Theory of Writing", and writes that different stages that a writer goes through when writing is controlled by an over-arching factor; a component within the writer‟s writing ability, through which the different thought processes in the writing takes place. Brown (2001, p.335) connected writing and thinking in a very basic way: ”Written products are often the result of thinking”. In his chapter on teaching writing (Brown, 2001, p.334-360) it is evident that it is this specific view-point that forms the basis for his principles for designing writing techniques. To mention a few, he brought up that it is important to “balance process and product”, “account for cultural/literary
backgrounds” and “provide as much authentic writing as possible” (Brown, 2001, p. 347).
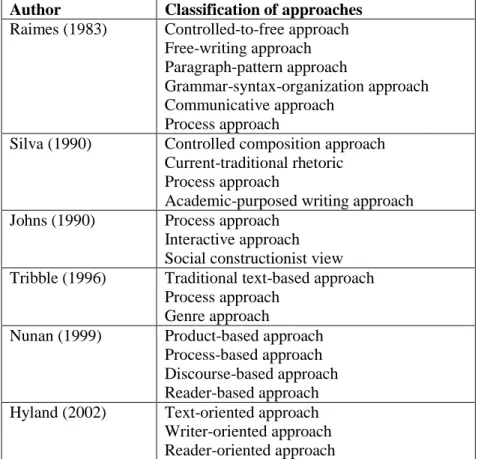
Table 2.1. Pedagogical Approaches to the Teaching of Writing
Author Classification of approaches
Raimes (1983) Controlled-to-free approach Free-writing approach Paragraph-pattern approach
Grammar-syntax-organization approach Communicative approach
Process approach
Silva (1990) Controlled composition approach Current-traditional rhetoric Process approach
Academic-purposed writing approach Johns (1990) Process approach
Interactive approach Social constructionist view Tribble (1996) Traditional text-based approach
Process approach Genre approach
Nunan (1999) Product-based approach Process-based approach Discourse-based approach Reader-based approach Hyland (2002) Text-oriented approach Writer-oriented approach Reader-oriented approach
E. The Nature of Writing
They are some definitions about writing. Writing is only mode in which both linguistics manipulation task and communication task have been given (Dullay, 2003, p.226) .Writing as a process is oriented to words work progress and the development of new skills, rather than merely evaluative task, the classroom practices, therefore, will vary from each other (Fauziati, 2012, p.151). In other words, writing activity as commonly conceived, is a highly sophisticated skill combining a number of diverse
elements, only of which are strictly linguistic (Frase, 2008, p.85). Donn states that writing is culturally specific, learned, behavior. We learn to write if we are members of a literate society and if only someone teaches us (Donn, 2005, p.334). Writing is an activity or occupation of writing (Hornby, 2000, p.516).
Based on the statement, it can be concluded that writing is an active productive more clearly; writing is an act or process to produce some information in their mind that should be expressed into writing from. Writing will be the best if the students guide on the rules defined. It usually refers to contents, organization, grammatical, usage and mechanics, sentence structure, mastery on vocabulary and so on.
There are some definitions of writing that are taken from resources, According to Oxford Advanced Learner's dictionary that writing is the activity or occupation of writing e.g. books, stories or articles Hornby (2000, p.1.383). Brown (2004, p.336) also states that writing is indeed a thinking process.
F. Kind of Writing
1. Essay
Essay defines a certain person, place, or thing, through the duration of the text. Formal definitions contain three parts: 1.) the term to be defined, 2.) the general class to which the term belongs, and 3.) the things that make the term different from all other items in the general class to which the term belongs (Gibson, 2012, p.50).
2. Paragraph
A paragraph is a group of sentences that works together to develop a main idea (Savage, 2007, p.102). A paragraph can be short or long. The number of sentences in a paragraph is unimportant; however, the paragraph should be long enough to develop the main idea clearly (Oshima, 2007, p.61). A paragraph may stand by itself and may also be one part of a longer piece of writing such as an essay (Shafiei, 2007, p.34).
Paragraphs have a very specific organizational pattern. It means that all paragraphs are put together in a similar way. A paragraph has three major structural parts: a topic sentence, supporting sentences, and a concluding sentence (Oshima, 2007, p.75).
Supporting sentences develop the topic sentence. That is, they explain the topic sentence by giving reasons, examples, facts, statistics, quotations, etc (Oshima, 2007, p.112). In terms of organization, there are two types of supporting sentences: major supporting sentences and minor supporting sentences. The major supporting sentences are the main details that tell us about the topic sentence. The minor supporting sentences tell us more about the major supporting sentences.
The concluding sentence of a paragraph signals the end of the paragraph and leaves the reader with important points to remember. A concluding sentence serves three purposes as follows: 1) it signals the end of the paragraph, 2) it summarizes the main points of the paragraph, 3) it gives the final comment on the topic and leaves the reader with the most important ideas to think about (Zemach, 2005, p.40). Good
paragraphs and essays have some characteristics in common. They are coherence, cohesion, unity, completeness (Shafiei, 2007, p.38).
That coherence refers to the way a group of clauses or sentences relate to the context. A text is cohered when one part of a text (a clause, a sentence or a turn at a talk) follows another part of a text (the next clause sentence or turn at a talk). The out come of this is that each part of the text creates the context within which the next bit of the text is interpreted (Halliday, 2010, p.23). That coherence means “to stick together” An essay is coherent if a) the parts of the essay are unified, b) if the essay seems logical to the reader (Reid, 2000, p.116).
The statements above, it is clear that in order to have coherence in writing, the sentences must hold together; that is, the movement from one sentence to the next and in longer essays, from one paragraph to the next) must be logical and smooth. Each sentence should flow smoothly into the next one.When a paragraph has cohesion, all the supporting sentences “stick together” in their support of the topic sentence. The methods of connecting sentences to each other are called cohesive devices (Boardman, 2002, p.36).
Other characteristics of a paragraph are unity and completeness (Shafiei, 2007, p.36). A paragraph has a unity when all the supporting sentences relate to the topic sentence. And a paragraph is complete when it has all the supporting sentences it needs to fully explain the topic sentence and all the minor supporting sentences it needs to explain each major supporting sentence.
G. Writing Process
Writing is never one-step action: it is on going creative act (Hogue, 2007, p.15). When you first write something, you have already been thingking about what to say and how you say it. Then after you have finished writing, you read over what you have written and make changes and correction. You write and revise and write and revise again until you are satified that your writing express exactly what you want to say.
Writing is broad sense as distinct from simply putting words on paper has three steps : thingking about it, doing it, and doing it again (and again, as often as time will allow and patience will endure) (Kane, 2000, p.17).
The first step, “thingking” , Involves choosing a subject, exploring ways of developing it, and devising strategies of organization and style. The second step, “doing” ,is usually called “drafting”. The thrid step, “Revising”.
The writing process provides an opportunity for someone to state and share their thoughts until they have expressed thei selves as clearly as possible. There are four main parts of the process of writing. They are planning, prewriting, drafting , revising and editing (Harmer, 2007, p.18). Teachers can help students to write more effectively through giving motivation or creativy teaching.
Students can be shown the different stages in the production of a piece of writing and be encouraged to discover what works best for them. The writing process is the thinking process that goes on during writing (Donn, 2005, p.250).
1. Planning
Planning gives a chance to think about what to write and how to write.Planning, involves brainstorming for ideas, defining and norrwing the topic by using pre-writing strategies, conducting research if necessary, writing a thesis statement, and writing working outline (Hogue, 2007, p.24). In planning stages, the writer use pre-writing technique to gather idea, and then choose a purpose and an audience.
2. Pre-Writing
In the prewriting stage is a step to think about the topic and generate ideas. Use these techniques, when the first begin to think about the topic are called brainstorming, freewriting, wh-question, and clustering (Brown, 2000, p.343). Brainstorming is a student insight or connection. It is purpose is to free up their mind to make association and connections. Wh-question is a report to answer the following questions in the first sentence of the report. These words are who, what, when, where, why, and how.Meanwile, clustering is making a visual map of ideas.
3. Drafting
A draf is an early version of piece of writing. Most of us cannot compose anything well at the firs try.We must write and rewrite. These initial efforts are called drafts, in distinction from the final version. As a rule, the more you draft, the better the result (Kane, 2000, p.34-35).
Drafting is a procedure for determining whether the information discovered during planning can be shaped into a successful piece of writing. In this part, is learned to assess the potential of each topic by evaluating it according to the guidelines for selecting a subject, analyzing an audience and determining a purppose (Johnson, 2008, p.175).
In drafing, some people aim for perfection when they write a firs draf. They want get everything right word choice to tone to sentence structure to paragraph organization. A first draf involves putting ideas down on paper for the first time. In this stage, the writer wants to get every thing right from word choice to tone sentece to paragraph organization to punctuation and grammar.
4. Revising
Revising is the process of seeing again, of discovering a new vision for the writing e produced during planning and drafting (Johnson, 2008, p.180). In revising stage, The writer can do editing like considering ideas and organization. Then we can do proofreading like correcting errors including sentence structure stage, spelling, punctuation, and grammar.
5. Editing
Editing is the last stages in the process writing. In editing the writer focus on writing students and coherence paragraph written by the students. In teaching writing students to become composers of authentic writing, teach them to approximate the writing process used by real writers (Johnson, 2008, p.184). That is, set up peer
editing gropus and teach student writing produce. In this stage, the writer editing about mechanics at the prewriting, drafting and revising stage, the flow of ideas and the quality of writing suffers.
H. Writing Ability
Writing is the ability to put pen and paper to express ideas through symbols, this way, representations on the paper will have meaning and content that could be communicated to other people by the writer (Klein, 1985). Douglas Brown (2010, p.335) stated that: “Writing is a way to end up thinking something you could not have started out thinking.”
According to Dulay (1982, p.226) writing is only made in which both linguistics manipulation task and communication task have been given. According to Fauziati (2002, p.1) writing as a process is oriented to words work in progress and the development of new skill, rather than merely evaluative ask, the classroom practices, therefore, will vary from each other.
Oxford advanced learner‟s dictionary (as cited in Robinson, 2003, p.36) that writing is the activity or occupation of writing e.g. book, stories or articles. Writing is a representation of language in a textual medium through the use of the sign of symbols. Writing began as a consequence of the burgeoning needs of accounting.
Ability is the publication targeting people who have difficulties using information technology. According to Mr. Echol ability is capability, talent, and skill (cited in Hornoy, Oxford Learners Dictionary, 1995, p.2).
Writing ability is multifaceted in its own right, any approach and accordingly, its definition of writing ability cannot be thorough and comprehensive in its own right. Each approach and definition have its own merits and demerits, depending on which facet it mainly focuses on among complex aspects of writing. As a result, it is valuable to investigate each approach and definition. Therefore, examine various definitions according to the approaches to the teaching of writing one after another.
Some Hedge (1998) argued that approaches to the teaching of writing can be grouped into two groups: the product approach vs. the process approach. It appears, however, appropriate to classify them into three approaches, as in Hyland (2002) on the grounds that since factors such as audience and social context have come to be considered important in writing, approaches involving these elements need to be included in the discussion.
Various definitions of writing ability have been formulated according to the three main approaches to the teaching of writing. The next three sections will investigate the definitions of writing ability according to teaching approaches (Yi, 2009, p.53-69).
I. Correlation
There are some definitions of correlations that are taken from some resources as follows:
Sudijono (2003) stated that “Correlation is a relationship between two or more variable”. Moreover, Indonesia dictionary stated that Correlation is cause and effect relationship.
Correlation study is concerned with determine the extent of correlation between variables. They enable one to measure the extent to which variations in one variable are associated with variations in another the magnitude of the relation determined through the use of the coefficient of correlation (Tony and Maggie, 1998, p.327).
Correlation is a technique for determining the variation between sets of scores; paired scores may vary directly (increase or decrease together) or vary inversely (as one increase, the other decreases, correlation research is research that attempts to determine the extent and the direction of the relationship between two or more variables (Ary, et al., 2010, p.639).
Correlation studies are used to look for a relationship between variables. There are two possible results of a correlation study (Sapsford and Jupp, 2006, p.225) :
a. Positive correlations: Both variables increase or decrease at the same time. A correlation coefficient close to +1.00 indicates a strong positive correlation. b. Negative correlation: Indicates that as a number of one variables increases,
the other decreases (and vice versa). A correlation coefficient close to -1.00 indicates a strong negative correlation.
Positive Coefficient Correlation (+) Negative Coefficient Correlation (-)
Or
Or
One Direction correlation Two Directions correlation
It can be concluded that correlation is to look for about the causal relationship between two or more aspects that be related. This relationship could be in different supporting variables or not. The sign (+ or -) of the coefficient indicates the direction of the relationship. If the coefficient has a positive sign, this means that as one variable increases, the other also increases. For example, the correlation between height and weight is positive because tall people tend to be heavier and short people lighter. A negative coefficient indicates that as one variable increases, the other decreases. The correlation between outdoor air temperature during the winter months and heating bills is negative; as temperature decreases, heating bills rise. The size of the correlation coefficient indicates the strength of the relationship between the variables. The coefficient can range in value from +1.00 (indicating a perfect positive relationship) through 0 (indicating no relationship) to -1.00 (indicating a perfect negative relationship). A perfect positive relationship means that for every z-score unit increase in one variable there is an identical z-score unit increase in the other. A perfect negative relationship indicates that for every unit increase in one variable
there is an identical unit decrease in the other. Few variables ever show perfect correlation, especially in relating human characteristics (Ary, et al., 2010, p. 350).
CHAPTER III
RESEARCH METHOD
This chapter explains about the research method in the present study. It consists of the Research Type, Research Design, Population and Sample, Research Instruments, Data Collection Procedure, and Data Analysis Procedure.
A. Research Type
This study used a quantitative research. Ary (2010, p.648) stated that Quantitative research inquiring employing operational definitions to generate numeric data to answer predetermined hypothesis or questions. The study applied quantitative research because this research appropriates to collect statistical data to answer the problems of the study. The purposes of quantitative research were to explain and to know about the correlation of reading frequency on writing ability at IAIN Palangka Raya.
Correlation research is by nature quantitative that is constructs are measured using a technique that yields numerical research. These numbers, which are assumed to represent to construct, are then analyzed (Johnson, 2009, p.53).
The purpose of correlation studies is to understand relationship among characteristics of people or other entities (Johnson, 2009, p.49). This study used correlation research because this study correlated between two variables. They were
reading frequency on writing ability by the sixth semester students of English Education Study Program of IAIN Palangka Raya.
B. Research Design
In this study, Correlation design (Non-Experimental) had been used. This design used to find out whether there is correlation searched the level of correlation then the clarity obtained from the theory (Muhidin and Abdurahman, 2007, p.105). According to Tony and Maggie (1998, p.327), correlation studies are concerned with determining the extent of correlation between variables. They enable one to measure the extent to which variations in one variable are associated with variations in another the magnitude of the relation determined through the use of the coefficient of correlation. Correlation is simply the association between two variables (Sapsford and Jupp, 2006, p.225). Correlation studies used to look for a relationship between variables.
There are two possible results of a correlation study (Sapsford and Jupp, 2006, p.225):
a. Positive correlation: Both variables increase or decrease at the same time. A correlation coefficient close to +1.00 indicates a strong positive correlation. b. Negative correlation: indicates that as a number of one variables increases,
the other decreases (and vice versa). A correlation coefficient close to -1.00 indicates a strong negative correlation.
C. Population and Sample 1. Population
Target population refers to the people about whom information will be collected (Ary, et al., 2010, p.648). This study was conducted by involving the students in the sixth semester of 2014/2015 academic year of English Education Study Program who programmed Paragraph Writing, Essay Writing and Argumentative Writing Course at IAIN Palangka Raya. Overall, the subject of this study was as follows. The total numbers of this population in this study were about 74 students.
2. Sample
In order to represent the population, sampling techniques in this study used cluster sampling (sampling area). Frankel and Wallen (1993, p.92) asserted for correlation research has minimum 50 subjects. Area sampling technique is used through two phases: the first phase determined the student sample, in this study divided into class A and B. This should be done in order to fulfill the principle of representation. The next stage determined the students that exist in that class. In this study, it took a sample of the sixth-semester students namely A class consisted of 24 students and B class consisted of 21 students. Thus the total numbers of students who became research subjects were 45 students.
Table 3.1. Population
Class Number of Students
A 24
B 26
C 23
Total 74
Note: C class took as instrument try out
Table 3.2. Sample
Class Number of Students
A 24
B 21
Total 45
Note: Actually, B class consisted of 26 students, but the study consisted of only 21 students because 5 students retaken course and did not pass writing 3 (Argumentative Writing).
D. Research Instrument
1. Research Instrument Development
The researcher used some instruments to collect the data needed in this research, they were:
a) Questionnaire
The instrument was used to measure students‟ reading frequency questionnaire used drawn up in accordance with the conceptual underpinnings of researchers (used to collect data to support the implementation of the reading frequency).
This questionnaire gave in the first meeting. In this research, the researcher distributed the questionnaire to the students to know their reading frequency score. In determining students score, the researcher used closed questionnaire in which the respondents ticked the available responses provided in the questionnaire. The questionnaire used five alternatives based on the Likert‟s Scale Types (Wade, 2006). Likert‟s scale was used to measure attitude, opinion, perception based on certain object or phenomenon.
In this research, the items in the questionnaire were written in Indonesian. It was done in order to make easier the respondents to answer the questions. The questionnaire were given to the students consist of four indicators. The indicators are taken from Tampubolon (1990, p.227) theory about reading aspects, they are: willingness to read, reading frequency, reading needed and motivation in reading. The questionnaire consists of 15 items. In this part, the researcher asked the students to choose one option that they want. It means that the answers must reflect their personality or their real life about their frequency of reading in English, when they were reading, and what they were reading. The researcher used four options of the answer in order to the answer more effective reading reflecting the respondents‟ life. To make it easy to determine in interval of the score of the questionnaire sheet, all answers of the questionnaire were changed into score by using Likert‟s Scale (Brown, 2010, p.3), such as Always (Sangat sering/SS), Often
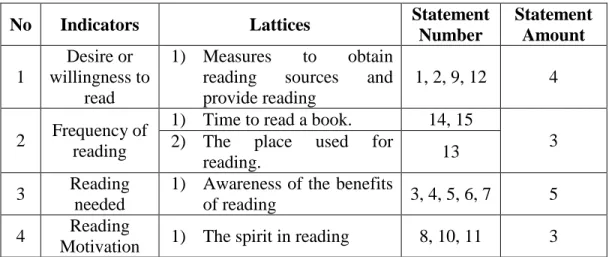
(Sering/SS), Seldom (Kadang-kadang/KD), and Never (Tidak pernah). The questionnaire adapted from Purnamasari‟s thesis (2013). The table of specification of reading frequency questionnaire is summarized below: Tabel 3.3. Specification of Reading Frequency Questionnaire
No Indicators Lattices Statement
Number Statement Amount 1 Desire or willingness to read 1) Measures to obtain reading sources and provide reading
1, 2, 9, 12 4
2 Frequency of reading
1) Time to read a book. 14, 15
3 2) The place used for
reading. 13
3 Reading needed
1) Awareness of the benefits
of reading 3, 4, 5, 6, 7 5
4 Reading
Motivation 1) The spirit in reading 8, 10, 11 3
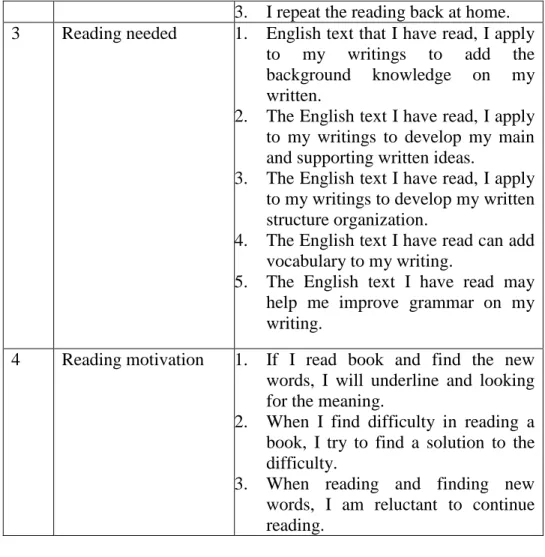
Table 3.4 Aspects and Statements of the Questionnaire
No Aspects Statements of the Questionnaire
1 Willingness to read 1. At the time of the exam, I often read books in the libraries
2. At the time of the exam, I often read books in online libraries (internet sources) and digital libraries.
3. Besides reading books, I also read popular readings such as newspapers, magazines, newsletters, or other readings on a daily basis. 4. I want to increase the number of
reading every reading of English book.
2 Frequency of reading 1. In a week, I provide a special time to read an English book.
3. I repeat the reading back at home. 3 Reading needed 1. English text that I have read, I apply
to my writings to add the background knowledge on my written.
2. The English text I have read, I apply to my writings to develop my main and supporting written ideas.
3. The English text I have read, I apply to my writings to develop my written structure organization.
4. The English text I have read can add vocabulary to my writing.
5. The English text I have read may help me improve grammar on my writing.
4 Reading motivation 1. If I read book and find the new words, I will underline and looking for the meaning.
2. When I find difficulty in reading a book, I try to find a solution to the difficulty.
3. When reading and finding new words, I am reluctant to continue reading.
The indicators and scores of the questionnaire are explained as follows: Table 3.5. Indicators and Scores of Reading Frequency Questionnaire
Indicators Scores
A: Always (Sangat sering/SS) B: Often (Sering/SS)
C: Seldom (Kadang-kadang/KD) D: Never (Tidak pernah/TP)
4 3 2 1
Based on the table above. For the positive question, every choice indicates that if the respondents choose option Selalu (always), the students‟
reading frequency in English was very good, and when the respondents choose option sering (often), the students‟ reading frequency in English was good. If the respondents choose option Kadang-kadang (sometimes), the students‟ reading frequency was fair. If the respondents choose option Tidak pernah (never), the students‟ reading frequency was poor. Finally, the total scores of the student‟s answer in questionnaire represent their motivation in learning English. Based on the standard score above, the highest score of the questionnaire was 100 and the lowest score was 30.
After the scale has been administered, each response option was assigned a number for scoring purposes (e.g., always‟= 4, „never‟= 1). With negatively worded items the scores are usually reversed before analysis. b) Documentation
This technique was used to collect written data, which related to the research. They were:
a. The amount of sixth semester students who programmed Paragraph Writing, Essay Writing and Argumentative Writing Course at IAIN Palangka Raya totally about 45 students (Students‟ name list of A class and B class),
b. Result of reading frequency was taken from students‟ questionnaire, c. Result of students‟ writing abilities was taken from the average
score of students‟ written product, and
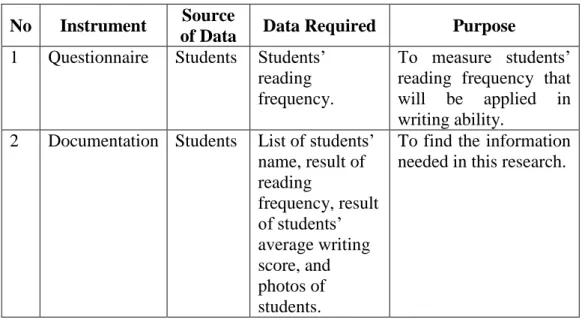
Tabel 3.6. Research Instrument Development
No Instrument Source
of Data Data Required Purpose 1 Questionnaire Students Students‟
reading frequency.
To measure students‟ reading frequency that will be applied in writing ability.
2 Documentation Students List of students‟ name, result of reading frequency, result of students‟ average writing score, and photos of students.
To find the information needed in this research.
2. Research Instrument Try Out
Try out in the present study was conducted to measure the instruments suitable for measuring students‟ reading frequency and writing ability. The aim of instrument try out was to know if the questionnaire instrument relevant to be given to the students or not. The questionnaire has given to the students to be tried out before it given to the real sample. Students try out here was some sixth-semester students that study in English Study Program at IAIN Palangka Raya on May 26th 2017.
The purposes of conducting the try out as follows:
a. To find out whether or not the instrument is acceptable and understandable for the student.
c. To give evidence to support the instruments validity and reliability. Here are the steps in conducting the try out, there are as follows: a. Preparing the instrument.
b. Choosing one class of sixth semester students‟ especially C class of IAIN Palangka Raya.
c. Explaining how to answer the questionnaire.
d. Giving the questionnaire items to the students who would be students try out.
e. Collecting and scoring the students‟ answer.
f. Then analyzing the data obtained to know the instrument Reliability and Validity Use SPSS version 16.0.
3. Research Instrument Validity
Johnson (2009, p.53) said that “a measure is valid if it measures what it is intended to measure”. Every test, whether it is a short, informal classroom test or a public examination, should be valid the constructor can make it. The test must aim to provide a true measure of a particular skill that it is intended to measure, to the extent that measures external knowledge and other skills at the same time, it will not be a valid test.
In this study tested, namely the questionnaire of reading frequency. The feasibility of a reading questionnaire reading instrument is tested using construct validity. To determine whether the instrument has validity, the items of the prepared questions are reviewed and declared good. The review
is done by a competent person in the relevant field or an expert judgment, in this case a validator lecturer. The reading frequency instrument is structured according to four indicators or aspects that will be measured on the basis of theory, namely frequency, desire, motivation, and needs.
Based on the review of the reading habit instrument in the form questionnaire by expert judgment, namely M. Zaini Miftah, M.Pd as a validator lecturer on Wednesday, May 17th 2017, from 15 point statement, there are some items that need to be revised, namely item 2, 3, 4, 5, 6, and 7. After the revision, the instrument is declared eligible to be used to retrieve data. The results of the reading comprehension test instrument test showed that of the 15 items tested there were 13 items that were eligible and 2 items that fell because they did not meet the requirements. Eligible items are used to retrieve data. The items that are eligible and fall can be seen in the Appendix 4.
The validity of this study is distinguished info some kinds as follow (Heaton, 1974, p.153):
a. Face Validity
Face validity is taken to ensure that the questionnaire is valid. Face validity is a term sometimes used in connection with a test‟s content. Face validity refers to the extent to which examinees believe the instrument is measuring what it is supposed to measure (Ary, 2010, p. 237). The face
validity of the test items is questionnaire which was be used in this research, can be suitable to the others at the same level that is IAIN Palangka Raya. b. Content validity
Content validity is obviously related to theoretical knowledge of the area but can be improved by asking experts and respondents about their views on the content of the instrument. That instrument can also theoretically be expected to predict or be related to another measure (Daniel, 2004, p.32).
Content validity in this research is concerned with what goes into the result of the study. A result of the study was being success conducted if the students‟ writing qualities are good.
c. Construct Validity
Construct validity is a slightly more complex issue relating to the internal structure of an instrument and the concept it is measuring (Daniel, 2004, p.68).
In measuring the instrument validity of the questionnaire, the researcher used the formula of Product Moment by Pearson as follows:
r
xy= N ∑XY - ∑X∑Y
Where:
Rxy : index number correlation “r” product moment.
∑ : amount of all X score.
∑ : amount of all Y score.
∑ : amount of Multiplication Result between Score X and Y.
: number of Students.
After the value of coefficient correlation (rxy) has found, then it has been
calculated using the measurement of t (uJi-t) with the formula: tobserve = r√
√
Where:
t = The value of tobserve
r = The coefficient of tobserve
n = Number of students
The distribution of ttable at alpha 5% and the degree of freedom (n-2)
with the measurements of validity using the criteria below (Riduwan, 2004, p.110):
To know the validity level of the Instrument, the result of the test was interpreted to the criteria below:
0.800-1.000 = Very High Valid t0>tt = Valid
0.600-0.799 = High Validity 0.400-0.599 = Fair Validity 0.200-0.399 = Poor Validity 0.000-0.199 = Very Poor Validity
4. Research Instrument Reliability
The reliability of a measure refers to the accuracy or consistency of measurement (Johnson, 2009, p.54).
To know the reliability of the questionnaire, the writer used Spearman-Brown formula, as follow:
r11= 2.rb
1+rb
Where:
r11 : Instrument Reliability
rb : Coefficient Correlation
After getting the instrument reliability of the questionnaire, than the value of reliability test compared with rtable.
E. Data Collection Procedure
The data in this study were the relationship of reading frequency (nominal data), data on writing ability (interval data) of English Education Study Program
r11> rtable= Reliable
Students who programmed Paragraph Writing, Essay Writing and Argumentative Writing Course at IAIN Palangka Raya. The procedures in collecting the data were as follows:
1. Preparation
a. Choosing the place of the study.
b. Asking permission to carry out this study.
c. Creating the research instrument. The instrument used in this study is in form of questionnaire.
2. Implementation
a. Asking the learning outcome (KHS Writing) of sixth semester students who programmed Paragraph Writing, Essay Writing and Argumentative Writing Course to the leader of English Education Study Program.
b. Giving questionnaire to the students at the first meeting to know about students‟ reading frequency.
c. Collecting the questionnaire sheets.
d. Analyzing the result of questionnaire scoring obtained using SPSS Version 16.
e. Collecting the data and analyzing the result of the research used SPSS version 16.0.
F. Data Analysis Procedure
To analyze the data of the research, the writer have some steps to analyzing the data. They are:
1. Collecting the Data
In the first steps, the researcher collected the data to analyze the data. The step is used to collect all of the data from the sample of research.
2. Identifying the Data
After the data is collected, the researcher identified the students‟ score from the result of the questionnaire given.
3. Classifying the Data
In this step, the researcher collected the classification of the result of the questionnaire and the researcher analyzed the correlation among the students‟ reading frequency and writing ability.
4. Explaining
In this step, the researcher explained the result of the classifying of the data. 5. Tabulating
In this step, the data had obtained put in the table, so that students can be clearly seen. The table prepares for the data distribution is the name of the students and the students‟ score of reading frequency and writing ability. 6. Evaluating
The researcher evaluated and analyzed the result of the questionnaire and the students‟ study result from the table.
To analyze the data has obtained, the researcher used the formula as below: 1. Calculated the students‟ score by using formula (Depdikbud:2004):
Where:
S = students‟ score
n = the number of students who got score in a level N = total of students
2. To find out the average score of the students‟ ability, the researcher used the formulas as bellow (Toha, 2003, p.94):
M=∑
Where:
M = mean
X = the sum of score N = number of the students.
3. To find out the correlation coefficient of writing ability and reading frequency, the researcher used the formulas as below:
a. By product moment formula (Sudijono, 2005, p.190):
Where:
Rxy : index number correlation “r” product moment.
∑ : amount of all X score.
r
xy= N ∑XY - ∑X∑Y
∑ : amount of all Y score.
∑ : amount of Multiplication Result between Score X and Y.
: number of Students.
b. By using interpretation orientation
Table 3.7. Interpretation of Orientation (Sudijono, 2007, p.193)
The Amount of “r” Product Moment Interpretation
0,00-0,20 There is correlation between variable X and Y, yet is very low so that it is regarded there is no correlation.
0,20-0,40 There is low correlation between variable X and variable Y.
0,40-0,70 There is average correlation between variable X and variable Y.
0,70-0,90 There is high/strong correlation between variable X and variable Y. 0,90-1,00 There is very high/strong correlation
between variable X and variable Y.
Then, it should be consulted to the result of index correlation number “r” product moment toward the table of “r” product of result with seeking the degree of freedom (df) with the formula as follows (Sudijono, 2007, p.103):
df = N-nr
Where:
df = degrees of freedom N = number of cases nr = the amount of variable.
c. To know contribution variable X to variable Y is used the formula (Riduwan, 2004, p.138):
KP = r
2x100%
Where:
KP = determinant coefficient score. r = correlation coefficient score.
d. To know the value of tvalue is used the formula (Riduwan, 2004, p.38):
Tvalue = r√
√
Where:
T value = value t.
r = the score of coefficient correlation. n = the number of sample.
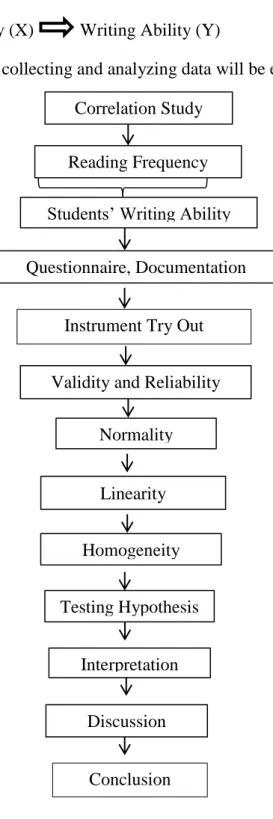
Reading Frequency (X) Writing Ability (Y)
The steps in collecting and analyzing data will be explained in figure 3.1. Correlation Study
Reading Frequency Students‟ Writing Ability Questionnaire, Documentation
Normality
Linearity Homogeneity
Figure 3.1 The Steps in Collecting and Analyzing Data Validity and Reliability
Testing Hypothesis Interpretation
Discussion Instrument Try Out
CHAPTER IV
RESEARCH FINDINGS AND DISCUSSION
In this chapter, the researcher presents the data which had been collected from the research in the field of study which consists of data presentation, research findings, and discussion.
A. Data Presentation
1. Analysis of Reading Frequency
a) The Result of Reading Frequency Questionnaire Score
The questionnaire sheets had been given to English Education Study Program Students in the sixth semester of 2014/2015 academic year at IAIN Palangka Raya. The total numbers of students who became research subjects were 45 students. This instrument conducted on May, 29th – 30rd 2017. The selection questionnaire responded referring to Likert scale, and in questionnaire, the researcher used frequency category (Always (A), Often (O), Seldom (S), Never (N). The number of the questionnaire was 13 items.
After the questionnaire of reading frequency answer sheets were collected, it gave the scores to the students‟ answer. The following table shows about the reading frequency scores.
51
Table 4.1. The Result of Reading Frequency Questionnaire Score
NO CODE Reading Frequency (X) X 2 1 ADP 51.92 2695.686 2 ABM 75 5625 3 AL 65.38 4274.544 4 AP 71.15 5062.323 5 HO 82.69 6837.636 6 LA 76.92 5916.686 7 MU 57.69 3328.136 8 MS 67.31 4530.636 9 MSA 63.46 4027.172 10 NT 59.62 3554.544 11 NN 57.69 3328.136 12 NIV 59.62 3554.544 13 NRL 65.38 4274.544 14 N 84.62 7160.544 15 NH 71.15 5062.323 16 R 78.85 6217.323 17 RR 67.31 4530.636 18 RM 61.52 3784.710 19 RFS 59.62 3554.544 20 SH 67.31 4530.636 21 SK 53.85 2899.823 22 S 50 2500 23 TK 61.52 3784.710 24 W 57.69 3328.136 25 AM 73.08 5340.686 26 APP 65.38 4274.544 27 AP 48.08 2311.686 28 AKU 63.46 4027.172 29 AY 65.38 4274.544
30 DS 53.85 2899.823 31 FDP 71.15 5062.323 32 IL 69.23 4792.793 33 MW 63.46 4027.172 34 NSEP 63.46 4027.172 35 NAFD 59.62 3554.544 36 NO 61.54 3787.172 37 NU 61.54 3787.172 38 NBY 59.62 3554.544 39 NDJ 59.62 3554.544 40 NL 53.85 2899.823 41 RA 69.23 479.793 42 RJ 53.85 2899.823 43 SY 53.85 2899.823 44 WI 67.31 4530.636 45 WMK 84.62 7160.544 Sum 2888.45 188822.306 Lowest Score 48.08 Highest Score 84.62 Mean 64.1878 Standard Deviation 8.81517
Based on the calculation variable X was found ∑X = 2888.45 and ∑X2 = 188822.306. Based on the data above, it is known that the highest score was 84.62 and the lowest score was 48.08.
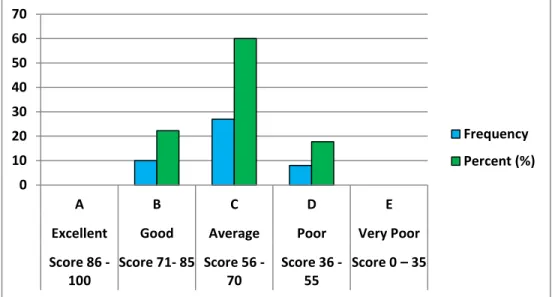
Table 4.2. the Classification of Measuring Questionnaire Score (Harris, 1996, p. 79)
No Level Explanation
1 Score 86 - 100 Excellent
2 Score 71- 85 Good