High School Choice in New York City:
A Report on the School Choices and Placements
of Low-Achieving Students
Lori Nathanson
The Research Alliance for New York City Schools, NYUSean Corcoran
Institute for Education and Social Policy, NYUChristine Baker-Smith
The Research Alliance for New York City Schools, NYULori Nathanson
The Research Alliance for New York City Schools New York University
Sean P. Corcoran
Institute for Education and Social Policy New York University
Christine Baker-Smith
The Research Alliance for New York City Schools New York University
April 2013
© 2013 Research Alliance for New York City Schools. All rights reserved. You may make copies of and distribute this work for non-commercial educational and scholarly purposes. For any other uses, including the making of derivative works, permission must be obtained from the Research Alliance for New York City Schools, unless fair use exceptions to copyright law apply.
Cover image by Emily Canal for Schoolbook.
High School Choice in New York City
A Report on the School Choices and Placements
of Low-Achieving Students
A
CKNOWLEDGMENTSThe authors would like to thank the New York Community Trust for their generous support of this work, and the New York City Department of Education for supplying necessary data. Hee Jin Chung and Grace Pai provided invaluable research assistance throughout the project, and Gretchen Grajo contributed additional GIS expertise and administrative support. We would especially like to thank Jonathan Winters for helping us develop new GIS capabilities for this project, and Jim Kemple and the staff of the Research Alliance for New York City Schools for helpful guidance about the report’s content and structure. Chelsea Farley’s editorial expertise and Shifra Goldenberg’s production assistance worked together to create a polished and accessible report. The report also greatly benefited from a stimulating public discussion with Rob Sanft, Joseph Viteritti, Clara Hemphill, and David Steiner at the CUNY Institute for Education Policy at Roosevelt House on November 29, 2012. Any remaining errors are solely the responsibility of the authors.
C
ONTENTS
Acknowledgments ... ii
Executive Summary... iv
1. Introduction ... 1
2. Who Are New York City’s Lowest-Achieving Students, and Where Do They Live? ... 10
3. Which High Schools Do Low-Achieving Students Rank First?... 17
4. How Do First-Choice Schools Compare With Matched Schools? ... 32
5. Did Students’ Choices and Placements Change Over Time? ... 37
6. Summary and Conclusions ... 40
Endnotes ... 44
E
XECUTIVES
UMMARYEach year in New York City, close to 80,000 middle school students participate in the ritual of choosing and applying to the City’s public high schools. Armed with the 600-page Directory of NYC Public High Schools and help from parents, teachers, guidance counselors, and community groups, these students rank up to 12 high school programs they would like to attend, choosing from nearly 700 programs at more than 400 schools citywide.
School choice policies aim to improve achievement by enabling families to choose a school that they believe will best serve their child’s needs. In New York City, choice and the development of a diverse portfolio of options have played central roles in the Department of Education’s high school reform efforts. These reforms have targeted both the supply and demand sides of the choice system. On the supply side, the DOE closed underperforming schools and opened hundreds of new school options. On the demand side, the DOE centralized the school assignment process and provided students and their families with extensive information about their choices.
The potential for choice to bring about large-scale improvement and narrow achievement gaps between low- and high-performing students depends on the choices students and their families make and on their actual school placements, which balance student preferences and school admissions criteria. Our report, High
School Choice in New York City, takes a close look at the choices and placements of
Key Findings
• Low-achieving students were matched to schools that were lower performing, on average, than
those of all other students.
• These differences in placements were:
- Driven by differences in students’ initial choices—low-achieving students’ first-choice schools were less selective, lower-performing, and more disadvantaged;
- Not a consequence of low-achieving students being less likely to receive their first choice—overall, lower-achievingand higher-achieving students were matched to their top choices at the same rate.
• Both low- and higher-achieving students appear to prefer schools that are close to home. Thus,
differences in students’ choices likely reflect, at least in part, the fact that lower-achieving students are highly concentrated in poor neighborhoods, where options may be more limited.
New York City’s most educationally vulnerable students: those scoring among the bottom 20 percent on the state’s math and English tests. Focusing on data from 2007 to 2011, the report examines the characteristics of these low-achieving students and how their schools choices and placements compared to those of higher-achieving peers. This summary highlights the report’s key findings and their implications for school choice policies and future research.
Though many low-achieving middle school students go on to succeed in high school, the overwhelming majority do not. For example, only 42 percent of low-achieving students (using our 7th grade test score threshold to define “low-achieving”) graduated on time between 2009 and 2011, as compared with 76 percent of all other students. A majority of these low-achieving students were male and black or Hispanic; they were also more likely to be English Language Learners or receiving special education services (or both) than their higher-achieving peers. Importantly, these students were concentrated in some of the City’s poorest communities, with one in four living in just 10 zip codes located in Brooklyn and the Bronx.
Low-Achieving Students’ First-Choice Schools and Placements
Our analysis of students’ choices and placements revealed several noteworthy patterns:
• Low-achieving students were matched to high schools that, on average, performed worse—with lower attendance and graduation rates and lower Progress Report scores—than the schools attended by their higher-achieving peers. Further, low-achieving students were matched to high schools with higher concentrations of achieving and low-income students.
Figure ES-1 on page vi displays Progress Report scores and graduation rates for the lowest-achieving students’ first-choice and matched schools, alongside comparable statistics for all other students. Focusing on matched schools, it shows that graduation rates were lower, on average, in high schools attended by low-achieving students (63 percent vs. 72 percent percent for their higher-achieving peers). Along the same lines, low-higher-achieving students’ matched schools fared worse on the City’s Progress Report than those to which their higher-achieving peers were matched (56 vs. 61 points, out of a possible total of 100).
• Differences in placements reflect differences in students’ choices and the options available to them in their local communities. Like their higher-achieving peers, low-achieving students tended to choose schools close to home. However, on average, the schools they ranked first were less selective, lower-performing, and more disadvantaged than the top choices of their higher-achieving peers.
Figure ES-1 illustrates how differences in the characteristics of matched schools were present in students’ initial choices. For example, the average graduation rate was lower in the first-choice school of low-achieving students (68 percent) than that in the first-choice school of their higher-achieving peers (78 percent). Similarly, Figure ES-2 on page vii shows that the lowest-achieving students were less likely than their higher-achieving peers to select a school that had received an “A” on the Progress Report (29 percent vs. 39 percent) and were more likely to select one that earned a “C,” “D”, or “F” (30 percent vs. 16 percent).
• Overall, lower-achieving and higher-achieving students are
matched to their top choices at the same rate. About 53 percent of both
Figure ES-1: Average Academic Performance of First-Choice and Matched Schools, for Low-Achieving and All Other Students, 2007-2011
60.1 pts 56.4 pts 64.5 pts 60.8 pts 68.0% 62.5% 77.5% 71.8% 0 10 20 30 40 50 60 70 80 90 100
1st choice Matched 1st choice Matched 1st choice Matched 1st choice Matched
Low-achieving All other Low-achieving All other
groups received their first-choice school. The exception to this finding is that low-achieving students were less likely to be matched to a selective (screened or audition) school than their higher-achieving peers, though a smaller share of low-achieving students listed a selective school as their first choice.
• For both groups of students, the school ultimately attended was, on average, lower-performing and more disadvantaged than their first-choice school. This reflects the fact that most students tend to rank relatively higher-performing schools first—an indication that quality matters to students—and not all students get their first choice. The differences between first-choice schools and final placements, however, were comparable for low-achieving and other students. This implies that the gaps between groups in first-choice schools carry forward to final school assignments.
• Although gaps persist between the schools low-achieving students and their higher-achieving peers rank first and attend, the overall performance of high schools in New York City has improved over time. For example, the average graduation rate at low-achieving students’ first-choice schools increased more than 15 points between 2007 and 2011. The
Figure ES-2: Progress Report Grades of First-Choice Schools, 2007-2011
28.8% 41.2% 21.3% 5.2% 3.4% 39.3% 44.9% 12.2% 2.3% 1.3% 0% 10% 20% 30% 40% 50% 60% 70% 80% 90% 100% A B C D F
same was true for schools ranked first by their higher-achieving peers. Thus, while differences remain in the performance of schools attended by these two groups, low-achieving students are choosing and attending schools with better outcomes than in years past.
What Are the Implications of These Findings?
This study was not an evaluation of high school choice in New York City, and cannot tell us to what extent the choice system itself is responsible for low-achieving students attending better schools over time. At this point, we also have little say about why students chose the schools they did. Choice allows families to identify schools they believe are best for them, by whatever criteria they set. Academic performance is a factor, but location, curricular fit, safety, and familiarity all play a role as well. We make no claims here whether students are making the “right” choices or not.
Rather, we view this study as an important first step toward understanding the choices and school assignments of the City’s lowest-achieving students. Our results document systematic, and sometimes large, differences in the performance and composition of schools attended by the lowest-achieving and all other students. Given that, overall, both groups of students were equally likely to be assigned to their top choices, these differences are largely the result of differences in their initial choices. Such findings raise at least two important questions for policymakers, educators and researchers to consider regarding the choice process and, specifically, the choices of low-achieving students:
1. Can school choice policies address the concentration of low-achieving students in disadvantaged communities? School choice policies provide an avenue for students to enroll in schools citywide, but in practice, students are constrained by familiarity with a school and their willingness to travel. All students appear to prefer higher-performing schools and schools that are close to home (selecting first-choice schools that are about a half hour away on average). However, low-achieving students tend to live in disadvantaged communities, where need is concentrated and the supply of high-performing schools is low. The good news is that the supply of schools across the City appears to be improving. Yet, we need to learn more about the distribution of higher-performing schools, particularly the extent to which they
are available in the communities where many of NYC’s low-achieving students live. Likewise, additional research is needed about strategies to help low-achieving students get access to higher-performing schools outside of their communities.
It is worth noting that many high schools give admissions priority to students residing in the same borough or geographic school district. Such priorities make sense, as they ensure students have access to schools in their own neighborhood if they wish to attend them. At the same time, because of the concentration of low-achieving students in certain neighborhoods, this clustering may put them at a disadvantage when applying to schools citywide. These students may, for example, find it more difficult to be admitted to oversubscribed, high-quality schools with geographic priorities outside of their neighborhood or borough. This remains an unstudied issue worthy of attention.
2. To what extent does NYC’s system of selective and non-selective high schools isolate lower-achieving students? Our analysis finds that low-achieving students are less likely to rank selective high schools as their top choice, and those who do (nearly a third) are less likely to be admitted. Choice offers students the opportunity to attend a school that best meets their needs, and very rigorous programs may not be a good match for lower-achieving students, who may be unprepared for such coursework. At the same time, the system has the potential to persistently stratify low- and high-achieving students into different schools—stratification that is driven by both geographic and performance-based admission criteria. Greater attention should be paid to the geographic distribution of selective and non-selective schools, as well as the way admissions methods shape choices and the allocation of students across schools. Expanding access to academically mixed educational option schools may be one viable strategy for reducing the isolation of lower-achieving students in certain schools.
New York City’s lowest-achieving students are, on average, attending higher-quality high schools than in years past, and graduating from NYC high schools in higher numbers. Whether or not these gains are attributable to the City’s policy of universal high school choice, however, is an open—and difficult—question. The Department of Education has made great strides in streamlining the choice process, providing students and their families with more information about their options,
and making school assignments fairer and more transparent. At the same time, there are limitations to what choice alone can accomplish. As evident from this study, students face constraints that shape the set of schools they can and do consider. Any improvements seen here may be driven at least as much by changes in supply—new schools that the district has brought to the neighborhoods that need them most—as by changes in demand.
Given the over-representation of low-achieving students in the poorest sections of the City, it is critical that the district continue efforts to bring targeted improvement to these communities. Helping low-achieving students and their families become fully informed about their options should remain a high priority as well. It is also important that sufficient resources be made available to help students with their choices, including an adequate number of knowledgeable guidance counselors with the time to devote to students needing the most support. Finally, the district should take steps to ensure that low-achieving students are not being concentrated in schools that give them little exposure to higher-achieving students. Promoting more high-quality educational option programs may be one way to accomplish this.
C
HAPTER1:
I
NTRODUCTIONEach year in New York City, close to 80,000 middle school students participate in the ritual of choosing and applying to the City’s public high schools. Armed with the 600-page Directory of NYC Public High Schools and help from parents, teachers, guidance counselors, and community groups, these students rank up to 12 high school programs they would like to attend, choosing from nearly 700 programs at more than 400 schools citywide.
School choice policies aim to improve student outcomes by enabling families to choose, from a portfolio of options, a school that they believe will best meet their child’s needs. In New York City, choice and the development of a diverse portfolio of options have played central roles in the Department of Education’s high school reform efforts. These reforms have targeted both the supply and demand sides of the choice system. On the supply side, the DOE has closed underperforming schools and opened hundreds of new school options. On the demand side, the DOE centralized the school assignment process and provided students and their families with extensive information about their choices. While acknowledging the importance of and interaction between these two sides of NYC’s high school choice reform, this report focuses on the demand side, specifically students’ choices and placements.
The potential for choice to bring about large-scale improvement and narrow gaps between low- and high-performing students depends on the choices students and their families make and on their actual school placements, which balance student preferences and school admissions criteria. In this report, we take a close look at the choices and placements of New York City’s most educationally vulnerable students: those scoring among the bottom 20 percent on math and English state tests. Focusing on data from 2007 to 2011, we first examine who these low-achieving students are (for example, how do their demographics compare to other students in the City, what educational challenges do they face, and where do they live?). We then review their most preferred schools and the schools to which they were ultimately assigned, and assess how these schools compare to those of their higher-achieving peers. While we are particularly interested in academic performance—as measured by schools’ graduation rates and Progress Report results, for instance— we examine contextual factors as well, including schools’ attendance rates, location, racial/ethnic diversity, poverty rates, and the proficiency of incoming students. We
believe the findings presented in this report provide useful guidance for policymakers overseeing school choice, and highlight important factors to consider for students, families and schools as they navigate school choice decisions.
Why Is School Choice Important?
Policies promoting school choice—magnet schools, charter schools, and vouchers, to name a few—are firmly embedded in modern efforts to improve public education. The case for these policies is often made on grounds of both efficiency and equity. In terms of efficiency, a system in which families “vote with their feet” and choose the school that serves them best is thought to reward schools that deliver a quality education. Schools that fail to perform will lose students and be pressured to improve or face potential closure. With respect to equity, school choice is based on the notion that all families have a right to identify the best available school for their children; the policy attempts to level the playing field, and ensure that no student is forced to attend a neighborhood school that is failing to provide a high-quality education.
Evidence on the efficacy of choice, however, is mixed. On the one hand, some studies have found that the ability to choose a school can have large impacts on academic outcomes, particularly when the “chosen” school is of higher quality than the alternative.1 On the other hand, other studies have found large-scale systems of choice have no or uneven effects, with some groups benefiting and others not.2 Furthermore, some choice programs have been found to exacerbate segregation across schools by race/ethnicity, socioeconomic status, and academic ability.3 The success of any choice policy depends on demand- and supply-side factors. On the demand side, the system depends on the choices students and their families make when given the opportunity. School choice relies on families’ ability to make an informed decision, one that is attentive to school quality as well as the “fit” of a given school to a student’s particular needs and interests. Yet students’ choices are shaped and constrained by their familiarity with and proximity to specific schools, concerns about safety, and the influence of friends and family. Parents vary in their knowledge of different schools, and some may lack the information, time, and resources required for a successful search (which, ideally, would involve visits to the schools being considered). In some households, the decision may be left entirely to the child.
On the supply side, the system depends on the availability of high-quality options. In theory, market forces will promote the expansion of high-performing schools, encourage new schools to open, and force under-performing schools to close. In practice, a central authority (the school district) manages the portfolio of school options available to students and their families. In New York City, the Department of Education has devoted considerable attention to supply, closing underperforming schools and opening hundreds of new school options.4 This effort has been particularly focused on neighborhoods that need new options the most—those where fewer high-quality high schools existed.
Careful, ongoing attention to the schools low-achieving students choose to attend is essential, for several reasons. First, because of the sheer number and diversity of options, choosing a school in New York City requires a higher level of sophistication than is required in most school districts. Many families navigate the system successfully, but parents of low-achieving students are at greater risk for lacking the resources needed to make a fully informed choice. Second, NYC graduation rates have improved, but remain low by U.S. standards. And, more importantly, large gaps remain across schools. Choosing a high school is thus a consequential decision, especially for students at risk of dropping out. Third, despite its advantages, a universal choice system with hundreds of options raises the possibility that students will further segregate by socioeconomic status and academic ability. In New York City, high school options include a number of academically selective (that is, screened or audition) schools, which has implications for sorting students by ability. Our report provides a first look at the high school choices of New York City’s lowest-achieving students, and how these choices compare to those of their higher-achieving peers. Importantly, our analysis is not a formal evaluation of high school choice in New York City, and cannot tell us whether low-achieving students are faring better or worse in the choice process than in years past. Additionally, while we have rich information about students’ actual school rankings, we are unable to say why students chose the schools that they did. Choice allows families to identify schools they believe are best for them, by whatever criteria they set. Academic performance is a factor, but many other criteria come into play as well, including proximity to home, safety, curricular focus, and fit to the students’ interests and needs.5 We make no claims about whether students are making the “right” choices for them or not; future reports from the Research Alliance and Institute for
Education and Social Policy will provide a more rigorous analysis of students’ preferences, including how students and their families are making these decisions.
An Overview of High School Choice in New York City
New York City relies on a complex algorithm to pair students with high schools that takes into account students’ preferences, available space, and the schools’ own rankings and priorities. (Alvin Roth, who designed the system with his colleagues, was recently awarded the Nobel Prize in Economics for his work developing assignment mechanisms like this one). In 8th grade, middle school students submit
Figure 1: The High School (HS) Choice Process in New York City
Note: Based on the 2012-2013 high school admissions process. Exact timeline may vary from year to year.
applications listing up to 12 high school programs they would like to attend, ranked in order of preference. Assignments are made by the central enrollment office, using the matching algorithm.
For most students, the process of ranking schools begins much earlier, when they learn about their high school options through fairs, information sessions, assemblies, and the published Directory.6 (Figure 1 on page 4 shows a typical timeline). In the fall of 8th grade, schools that screen based on academic or artistic work conduct interviews and auditions, and students wishing to apply to one of the prestigious exam-based specialized high schools take the Specialized High School Admissions Test (SHSAT). By December, all rising 9th graders are required to submit their choices.7 Most are assigned by March or April in the “main round” of matching, although a number of students remain unmatched. Unassigned students must re-apply in a secondary “supplemental round” for remaining seats. Most, though not all, receive a match by the conclusion of the supplemental round.
Applicants choose from a large portfolio of high schools, including small themed schools, large comprehensive schools, career academies, and performing arts schools.8 Each high school has an admissions method and a set of admissions priorities that determine how students are admitted. Excluding the specialized high schools, there are six admissions methods, including three that are academically non-selective (limited unscreened, unscreened, and zoned), two that are selective (screened and audition), and one that is partially selective with a purposefully balanced test score distribution (educational option). These admissions methods are summarized in the texbox on page 7. Beyond the admissions method, school priorities give preference to students based on geography or demonstrated interest. For example, a school may give priority admission to residents of the same borough or regional school district, and/or to students who have visited the school or attended a school information session.
Figure 2 on the next page shows how the supply of available school programs has grown over time, both in total and by admissions method. In 2012, there were 699 unique programs housed in 407 schools citywide, including the nine specialized schools (eight that require the SHSAT, and the LaGuardia Arts School, which requires an audition or portfolio). The number of options has grown substantially since 2005, when students selected from 657 programs in 325 schools. By far, the greatest growth has been in limited unscreened schools, which nearly doubled from
106 to 210 over this period, as the NYC DOE closed large comprehensive schools and opened smaller, non-selective schools in their place.9 Screened programs experienced modest growth over time, while audition, zoned, and (especially) educational option programs declined in number.
The changing supply of high schools has important implications for school choice. On the one hand, students have considerably more options to choose from, and many of the large comprehensive zoned high schools that were deemed failing—yet were considered students’ “default” school option—have closed. These changes were a conscious effort by the DOE to improve the quantity, quality, and diversity of school offerings, particularly in communities where many students are low achieving. On the other hand, the churn of school closures and openings has arguably made the system more volatile, and increased the knowledge and sophistication required to make an informed choice.
Figure 2: Counts of High School Programs by Admissions Method, 2005-2012
Source: Authors’ calculations using data provided by the NYC DOE. Note: See textbox on page 7 for description of admissions methods. Zoned/Unscreened Limited unscreened Educational option Audition Screened Test 0 100 200 300 400 500 600 700 800 2005 2006 2007 2008 2009 2010 2011 2012
Despite the system’s complexity and scale, most students receive one of their top choices. In 2011, just over half (52 percent) of all students received their first choice, and three quarters of students were matched to one of their top three choices (see Figure 3 on the next page).10 The rates of students matched to their top choices have steadily improved since the new system was implemented in 2004-2005. Still, more than 10 percent of students received none of their top 12 choices during the main round. These students participated in the supplemental round and received one of their 12 supplemental school choices, or in some cases, were assigned to a school other than one that they listed.11
Receiving one’s first choice is desirable, but not an unequivocally positive outcome. For example, consider a hypothetical student, Alex, who designates a chronically underperforming and under-enrolled school as his first choice. He will almost certainly be assigned there, given low demand for the school, and will count among those receiving their first choice. Barbara, on the other hand, ranks competitive,
High School Admission Methods in New York City
High schools in New York City admit students through one of the following methods:
Selective Methods
• Test: Admission based solely on applicants’ score on the Specialized High School Admissions Test (SHSAT).
• Screened: Rank applicants based on their final report card grades from 8th grade, reading and math standardized test scores, attendance, or other criteria.
• Audition: Require applicants to demonstrate proficiency in a specific performing arts/visual arts area. May also review attendance and grades.
Non-Selective Methods
• Limited Unscreened: Prioritize applicants who demonstrate interest in the school by attending a school information session or open house event, or by visiting the school’s exhibit at a High School Fair.
• Unscreened: Randomly select among applicants.
• Zoned: Prioritize applicants who live in the geographic zoned area of the high school. Residency is the sole admission criterion.
Partially Selective
• Educational Option: Meant to serve a wide range of academic performers. Based on standardized test reading scores from the prior school year, applicants are admitted based on the following target distribution: 16 percent high reading level; 68 percent middle reading level; 16 percent low reading level.
Source: Directory of NYC Public High Schools, Retrieved 4/8/13 from
high-quality high schools among her top choices, and is matched to her third choice. Barbara’s school placement may be better than Alex’s from an academic standpoint. Yet Barbara is not counted among those receiving their first choice. While the DOE aims to maximize the number matched to their most desired school—an important goal—a full understanding of the choice policy’s effects requires attention to the quality and suitability of schools students choose in practice.
Finally, it is important to note that a number of students arrive late to the district or otherwise do not participate in the high school admissions process during their 8th grade year. Latecomers visit a borough enrollment office in order to be assigned a school with available seats. (In addition, a limited number of 10th grade seats are reserved for late arrivals and transfers). Many of the City’s low-achieving students are likely to be found among this group. Because late-arriving students fail to submit choices and are typically missing prior academic information, however, we are forced to exclude them from this analysis.
Figure 3: Matched High School, All Participating 8th Graders, 2011
Source: Authors’ calculations using data provided by the NYC DOE based on 74,098 students who were matched in 2011. 1st Choice 52% 2nd Choice 14% 3 rd Choice 8% 4th - 12th Choice 15% Supplemental or other 11%
The Structure of This Report
The following chapter provides a profile of the City’s low-achieving students, including how we defined this group of students and a review of their demographic characteristics and the neighborhoods where they reside. Chapter 3 examines the high schools that low-achieving students ranked first, and how these compare to the first choices of other students. In Chapter 4, we describe how the matched schools for these two groups differed from their first choices, while Chapter 5 considers the extent to which students’ choices and matched schools changed over time. The final chapter discusses the implications of our findings and highlights important questions for policymakers, educators, and researchers to consider as they work to improve the choice process for all students.
Data Sources
This report draws on high school admissions data held by the Research Alliance through an ongoing data sharing agreement with the NYC Department of Education. This data included:
• The high school rankings submitted by five cohorts of students—those entering 9th grade between
2007 and 2011;
• The school to which each of these students was ultimately matched;
• Demographic records, academic history, and 9th grade enrollment status for each student; and
• Information about the schools (both students’ top choices and the matched schools), including
Progress Report results, graduation rates, physical location, and student demographics.* Nearly 80,000 8th graders participated in the high school choice process each year during our study period. Most were enrolled in a public school, but a substantial number applied from a private middle school. Some applicants began the process but opted out at some stage. This might happen, for example, when a student did not receive an offer from a selective school and then decided to attend a private school instead. Others moved out of the district and did not complete the process. Excluding opt-outs, about 74,000 students were ultimately matched to a school, and 67,000 enrolled as 9th graders each year. In this report, we focus only on the population of students that (1) attended a public middle school; (2) completed the choice process; and (3) enrolled in a NYC public high school in 9th grade. Because we defined low-achieving students using state test scores, we also required that included students have state test scores reported in 7th grade. Thus our analytic sample included 317,010 students out of 422,491 who participated in the high school choice process during the study period. We excluded 105,481 students. Of these, 71,546 did not have a 7th grade test score and 33,935 were excluded for other reasons. Many of the students without test scores applied from private schools, or were new to NYC schools. Our analytic sample (317,010) included 90 percent of all students with 7th grade test scores (350,945).
* Graduation rates were not available for some schools that were open for enrollment during this period (ranging from 47 to 109 schools, depending on the year). Because these schools opened after 2007, they did not yet have graduating classes for which these calculations could be made.
C
HAPTER2:
W
HOA
RENYC’
SL
OWEST-A
CHIEVINGS
TUDENTS,
ANDW
HERED
OT
HEYL
IVE?
To understand how low-achieving students are faring in New York City’s high school choice system, the first step was to determine a good way of defining this group of students. We then set out to compare them to other students in the City, on a range of characteristics, including demographics (race, gender, poverty rates, etc.), special education status and English language proficiency. Finally, we looked closely at the neighborhoods where students reside, which—as we discuss below— may be especially important in the context of school choice.
How Were “Low-Achieving” Students Defined?
Our primary interest was in a group of the “lowest-achieving” rising 9th graders. While there were many ways this could be defined, we based our definition on students’ 7th grade performance on the New York State English Language Arts (ELA) and mathematics tests. (These are the last state tests taken before the choice process begins, and the tests that many screened schools use to rank applicants.) Students who scored sufficiently low on both tests were classified as “low-achieving” for this study.12
A common benchmark for low achievement is a test score in the Level 1 or Level 2 category on the New York State assessments—failing to meet or partially meeting state standards. However, scores on these assessments rose sharply during our study period, and as a result, fewer and fewer students were deemed “low achieving” by
this benchmar
became easier over time led the state to re-calibrate the proficiency categories in 2011.13
To keep the study population stable over time, we defined low-achieving students using percentiles rather than proficiency categories. Specifically, we defined “Level 1” students as those below the 20th percentile on a given test (ELA or math), and “Level 2” students as those at or above the 20th percentile, but below the 50th percentile.14 This approach ensures that we used the same criteria to define our focus population each year and kept the composition of this population relatively constant over time.
Using these percentile thresholds, we defined low-achieving students as students who scored below the 20th percentile in either ELA or math, and no higher than the 50th percentile in the other subject. While our exact criteria for inclusion in the “low-achieving” group is necessarily arbitrary, there is little question that students in this category have significantly worse high school outcomes than others. For example, we computed the four-year high school graduation rate for the 2005, 2006, and 2007 cohorts who would have graduated in 2009, 2010, and 2011, respectively. We found that only 42 percent of students classified as “low-achieving” based on their 7th grade test scores graduated on time, as compared with 76 percent of all other students. Close to 22 percent had formally dropped out of school by this point, versus 8 percent of their higher-achieving peers. By the 10th grade, the low-achieving population had, on average, passed fewer than one (0.56) of the required state Regents exams, while those not in this group had passed close to three (2.78).
What Are the Characteristics of Low-Achieving Students?
Combining all cohorts (2007–2011), 24 percent of students in public middle schools participating in high school choice met our definition of low-achieving, based on their 7th grade test scores (see Data Sources textbox on page 9). About half of these (11 percent of all students) scored below the 20th percentile in both ELA and math. Table 1 on the next page offers a look at some characteristics of this population, alongside descriptive statistics for students who were not classified as “low-achieving” (who we often refer to in this report as “all other” students).15 As is clear from Table 1, the low-achieving population differed in a number of important ways from other students. For example, low-achieving students were poorer, with 55 percent eligible for free meals, versus 44 percent of all other students. Low-achieving students were more likely to be black (41 percent vs. 29 percent) and Hispanic (48 percent vs. 38 percent) than other students, and were less likely to be white (5 percent vs. 15 percent) or Asian (5 percent vs. 18 percent). One third of the low-achieving group had been absent 20 or more days in 7th grade (vs. 14 percent of all other students), and nearly a third (27 percent) had been late to school for 30 or more days. Boys were significantly over-represented in the low-achieving group (at 57 percent) compared to their higher-achieving peers (48 percent).
Table 1: Characteristics of Low-Achieving and All Other Students, 2007-2011
Notes: To be included in the above table, students must (1) have at least one test score (ELA or math) reported, (2) have completed the high school choice process in any of the years 2007-2011, and (3) have subsequently
enrolled in a public high school as a 9th grader. Low-achieving students are defined as those who scored below
the 20th percentile on the New York State 7th grade achievement test in either math or English Language Arts
(ELA) and no higher than the 50th percentile in the other subject. UFM refers to universal free meals schools,
which provide free meals to all students, and tend to have a high percentage of students eligible for free or
reduced price meals. Special education is based on 8th grade status and includes students with Individual
Education Plans (IEPs) for learning or behavioral disabilities that can be accommodated in regular education classrooms. In this table, we include students in self-contained special education programs. Students whose IEPs recommend a specialized D75 program do not participate in the high school admission process and therefore are not included in the other analyses presented in this paper.
Percent of low-achieving
students
Percent of all other students Borough of residence Brooklyn 32.3 32.2 Manhattan 11.9 11.3 Queens 19.6 30.4 Staten Island 4.6 6.3 Bronx 31.6 19.8 Demographic characteristics Male 56.6 48.5 Asian 4.6 18.0 Hispanic 48.1 37.7 Black 41.4 29.3 White 5.2 14.5 Immigrant 16.3 17.9 Poverty indicators
Free, reduced-price, or UFM 66.0 56.9
Free meal eligible 55.4 43.5
Reduced-price meal eligible 4.3 6.9
School-related services Special Education 37.4 6.0 ELL 21.4 7.0 Attendance in 7th grade Absent 20+ days 33.0 14.4 Absent 30+ days 17.7 6.1 Late 30+ days 27.4 13.0
Average attendance rate (% of days) 88.0 92.6
NYC’s lowest-achieving students were also significantly more likely to face other educational challenges, including limited English proficiency (classification as an English Language Learner, or ELL) and special education needs. Figure 4 below illustrates the share of the focus population who were ELLs, receiving special education services, or both. Remarkably, more than half of the low-achieving population (51 percent) met one or both of these criteria. Almost one third received special education services only (30 percent), 14 percent were ELLs (but not receiving special education services), and 7 percent were both ELLs and receiving special education services.
Another way to see the overlap between low-achieving students and those with special needs is in the fraction of all ELL and special education students who meet our criteria for low achievement (see Figure 5 on the next page).16 During our study period, 49 percent of ELLs entering the 9th grade met our definition of low-achieving, and a striking 64 percent of students receiving special education services did. An even higher fraction (80 percent) of students categorized as both ELL and receiving special education services were among the low-achieving population. Our analysis of low-achieving students, therefore, encompasses a large share of NYC’s
ELL and special education students. In
those presented in this report that focus exclusively on these two subgroups.
ELL
Figure 4:Representation of ELL and Special Education Students Among the Lowest-Achieving Students, 2007-2011
Neither ELL nor Special Education 49% ELL & Special Ed. 7% ELL 14% Special Education 30%
Where Do Low-Achieving Students Live?
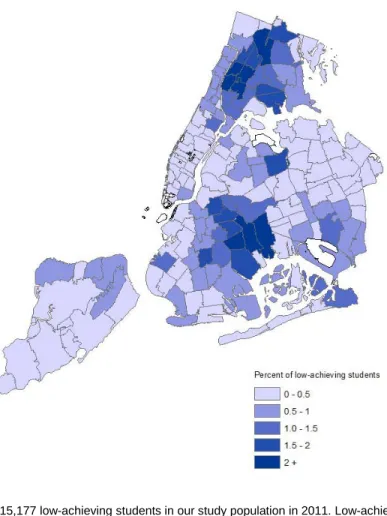
Table 1 showed that low-achieving students were much more likely to reside in the Bronx (32 percent vs. 20 percent) than all other students and were less likely to reside in Queens (20 percent vs. 30 percent). Comparable shares of low-achieving and all other students resided in Brooklyn and Manhattan. A closer look at the data reveals that low-achieving students were even more geographically concentrated in specific neighborhoods of the City, often those with the highest concentrations of poverty. Figure 6 on the next page illustrates where our low-achieving study population lived in 2011, based on their zip code of residence. In this figure, zip codes with darker shading contain a larger proportion of the low-achieving population.
Figure 5: Percent of All Special Education and ELL Students Who Were Low-Achieving, 2007-2011
Note: The figures represent 49,497 special education students and 32,866 ELL students, respectively. All blue
sections represent subsets of low-achieving students. L1 refers to a score below the 20th percentile, and L2
refers to a score between the 20th-50th percentiles.
36%
40% 12%
12% Special Education
Not low achieving
Low-achieving: ELA L1 & math L1 Low-achieving: ELA L1 & math L2 Low-achieving: ELA L2 & math L1
51% 5% 17% 27% ELL 27% Not low-achieving
In 2011, a significant share of the low-achieving study population lived in the Central and South Bronx; East and Central Harlem and Washington Heights in Manhattan; parts of Central Brooklyn, including Brownsville, East New York, Cypress Hills, and Flatbush; and north and southeast sections of Queens, such as North Corona, Rochdale, and Far Rockaway. years, which show comparable patterns). Remarkably, nearly one in four of the low-achieving students in our study resided in one of only ten zip codes in the City, including seven in the Bronx and three in Brooklyn.17
Figure 6: Geographic Distribution of Low-Achieving Students by Residential Zip Code, 2011
Note: There were 15,177 low-achieving students in our study population in 2011. Low-achieving students
are defined as those scoring below the 20th percentile in one subject (ELA or math) and no higher than the
The geographic concentration of low-achieving students is relevant to school choice for several reasons. First, all else equal, students tend to prefer schools closer to home.18 Students are more familiar with these schools, their friends and neighbors may attend there, and their location is convenient. This preference implies that students’ choices may disproportionately reflect proximate schools. Second, one of the underlying principles of choice is that it offers an opportunity to break the link between the neighborhoods where students live and the schools they attend. By examining where low-achieving students live and where they choose to go to school, we can learn the extent to which students apply to and ultimately enroll in schools outside of their neighborhoods. In Chapter 3, we revisit the map presented in Figure 6 to see where low-achieving students’ first-choice schools were located (see Figure 13 on page 27).
Summary of Low-Achieving Student Profile
NYC’s low-achieving students were poorer, more likely to be black or Hispanic, and more likely to be male, compared with other students. As a group, they faced significant educational challenges. One third of low-achieving students had been absent 20 or more days in 7th grade and nearly as many had been late to school for 30 or more days. They were much more apt to have limited English proficiency and special education needs than were other students. Finally, they were highly concentrated in certain neighborhoods, which, as we see in the next chapter, may play a role in the high schools they select.
C
HAPTER3:
W
HICHH
IGHS
CHOOLSD
OL
OW-A
CHIEVINGS
TUDENTSR
ANKF
IRST?
The primary goal of this report is to profile the high school choices of NYC’s lowest-achieving students. We begin this chapter by outlining why students’ first choices matter. We then characterize low-achieving students’ “typical,” or average, first-choice school in four broad areas: (1) admissions method, (2) academic performance, (3) peer composition and school context, and (4) location/distance from home. For comparison, analogous measures are provided for schools ranked first by students not categorized as low-achieving (“all other students”).
Why Look at First Choices?
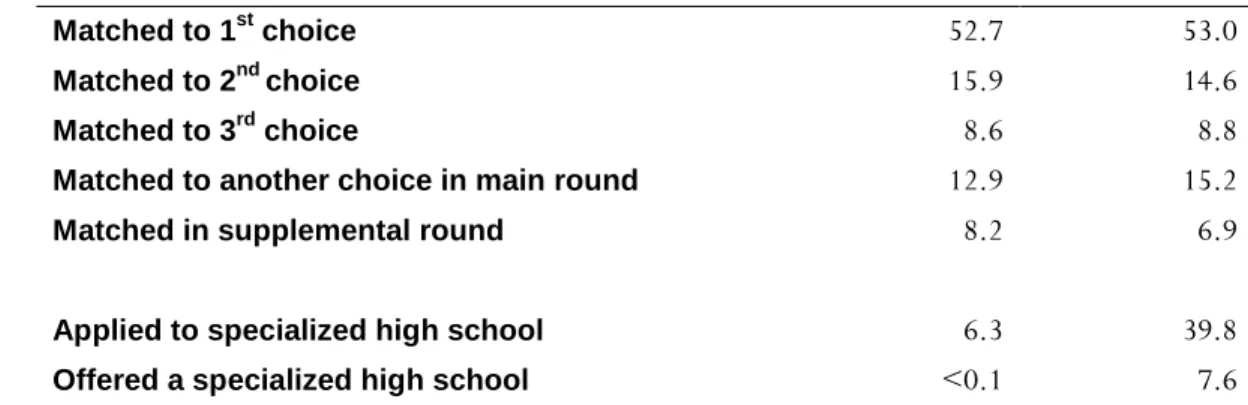
We focus on first choices because they represent students’ most desired high school placement, and because a substantial portion of all students ultimately attend their first-choice school. As shown in Table 2 below, low-achieving students and their higher-achieving peers were matched to their first-choice school at similar rates. In both groups of students, roughly 53 percent received their first choice over this period. Likewise, a comparable percentage in each group (77 percent) was matched to one of their top three choices. The two groups differed slightly when it came to the supplemental round; about 8 percent of low-achieving students were matched in the supplemental round, when the number of available schools is more limited, as compared with about 7 percent of all other students.19
Table 2: Overview of High School Choices and Placements, 2007-2011 Percent of low-achieving students Percent of all other students Matched to 1st choice 52.7 53.0 Matched to 2nd choice 15.9 14.6 Matched to 3rd choice 8.6 8.8
Matched to another choice in main round 12.9 15.2
Matched in supplemental round 8.2 6.9
Applied to specialized high school 6.3 39.8
Offered a specialized high school <0.1 7.6
Notes: Percentages based on the choices of 75,354 low-achieving students and 235,572 other students. Matched to first choice includes students matched to a specialized high school. Supplemental round matches include a small number of students who did not submit any choices in the main round. Excluding these students, the percentages
While low-achieving students were admitted to their first-choice school at similar rates as other students, the schools they ranked first tended to differ in a number of important ways. Below we examine the admissions methods of first-choice schools (for both groups of students), which tells us about the criteria the schools use to admit students, but not necessarily their academic performance. To get at academic performance, we look at several indicators, including the schools’ Progress Report scores, graduation rates, and attendance rates. In addition, we present information about peer composition and school context, as these factors also shape students’ educational experiences. Finally, we describe the school location and distance from home, to understand the geographic distribution of first-choice schools in general and in relation to where students live. Each of these characteristics helps us to understand how low-achieving students’ first-choice schools may differ from those of their higher-achieving peers.
Admissions Method
During our study period, the average applicant ranked between 6 and 7 schools in the main round—that is, fewer than the possible 12. Low-achieving students tended to rank slightly more, between 7 and 8 schools.20 More interesting, however, are differences in the selectivity of low-achieving and other students’ first-choice schools, as shown in Figure 7 on the next page. For this figure, we grouped the six admissions methods into three categories that represent their selectivity: selective (audition and screened), non-selective (limited unscreened, unscreened, and zoned), and mixed (educational option). Among low-achieving students, academically mixed educational option programs were the most popular, representing 36 percent of all first choices, followed by non-selective programs (35 percent) and selective programs (29 percent). More than half of other students listed a selective program as their first choice (56 percent); one quarter (26 percent) listed a non-selective program first; and less than one fifth (18 percent) ranked an educational option program first. It is not surprising that low-achieving students were less likely to apply to an academically selective school. Selective schools frequently use 7th grade math and ELA test scores as admissions criteria—the same test scores we used to define the low-achieving students for this study—and therefore, low-achieving students would be less likely to be competitive for these schools. However, we note that the criteria vary within the group of academically selective schools, and low-achieving students may still be admitted to some schools within this type.
Academic Performance
The academic performance of a school describes the collective performance of all students in the school. For potential students, this information may foreshadow how they and their peers will fare in that particular school environment. Figure 8 on the next page displays several measures of academic performance for the first-choice high schools of low-achieving and all other students. These include overall scores on the Progress Report (the NYC DOE’s most prominent indicator of school quality), four-year graduation rates, and attendance rates. On average, we found low-achieving students’ first-choice schools fared worse by each of these measures than did the first choices of their higher-achieving peers. In other words, low-achieving students tended to select schools performing at or below the citywide average, while their higher-achieving peers were more likely to choose schools performing above average.
The largest gap in performance between the first choices of low-achieving and other students was in graduation rates.21 Four-year graduation rates were lower, on average, in schools ranked first by low-achieving students than in those chosen by their higher-achieving peers (68 percent vs. 78 percent). The former, however, was
Figure 7: First-Choice Programs by Admissions Method, 2007-2011
Source: Authors’ calculations using data provided by the DOE. Academically Selective 29% Non-selective 35% Mixed 36% Low-Achieving Students Academically Selective 56% Non-selective 26% Mixed 18% All Other Students
close to the citywide average (66 percent in 2011).22 A smaller gap was found in average daily attendance at the top choices of low-achieving and all other students (86 percent vs. 89 percent).23 We observed a relatively small difference in Progress Report scores between the average first-choice school of low-achieving and other students (60 points vs. 65, out of a possible total of 100).
While a large gap existed in the graduation rates of schools ranked first by low-achieving and other students, the citywide high school graduation rate in NYC improved over time (from 53 percent in 2007 to 66 percent in 2011).24 Because of this, we were concerned that differences we observed over the course of the entire study period may have obscured important trends. For example, it is possible that schools chosen by low-achieving students improved at a faster pace than schools chosen by their higher-achieving peers. Therefore, we looked at the graduation rates of first-choice schools separately by year. The results, shown in Figure 15 on page 39, show no obvious trend over time other than overall general increase in graduation rates. The difference between low-achieving and other students’ first-choice schools is persistent: Each year, the graduation rate at low-achieving students’ first choice was 9 to 10 percentage points lower than that at all other students’ first-choice school.
Figure 8: Average Academic Performance of First-Choice Schools, 2007-2011 89.4% 86.0% 77.5% 68.0% 64.5 points 60.1 points 0 10 20 30 40 50 60 70 80 90 100 A ll o ther Lo w -ac hi ev ing A ll o ther Lo w -ac hi ev ing A ll o ther Lo w -ac hi ev ing A tt end anc e G rad uat io n r at e P rogr e s s R e por t
Figure 8 showed a modest difference in the average Progress Report scores of low-achieving and all other students’ first-choice schools. However, in this case, looking at the average masks significant differences in the likelihood of ranking first schools with high or low letter grades. As seen in Figure 9 below, low-achieving students were much less likely to rank an “A” school as their first choice than their higher-achieving peers. During this period, 29 percent of the low-higher-achieving population ranked an “A” school first, as compared to 39 percent of all other students. They were more likely to rank a “C” or “D” school first than other students, with 27 percent of low-achieving students listing a “C” or “D” school first (vs. 15 percent of all other students).
The above differences in academic performance between low-achieving and other students’ first-choice schools may simply reflect their differential propensity to rank selective schools first, as was shown in Figure 7. This is certainly an important part of the story: For both low-achieving and other students, first-choice schools that were academically selective (i.e., used a screened or audition admissions method) tended to have better graduation and attendance rates than first-choice schools that were non- or partially-selective. First-choice limited unscreened and educational option schools tended to fare comparably worse by these measures. (Progress Report results, on the other hand, tended to be better in first-choice limited
Figure 9: Progress Report Grades of First-Choice Schools, 2007-2011
28.8% 41.2% 21.3% 5.2% 3.4% 39.3% 44.9% 12.2% 2.3% 1.3% 0% 10% 20% 30% 40% 50% 60% 70% 80% 90% 100% A B C D F
unscreened schools). Thus, a tendency for higher-achieving students to rank more selective schools first can produce the results shown in Figure 8 and 9.
Preferences for selective schools are not the whole explanation, however. In a
separate analysis shown i
performance of low-achieving and all other students’ first-choice schools with the
same admissions method. These figures show that among first choices with the same
admissions method, low-achieving students tended to choose schools with lower four-year graduation rates, Progress Report results, and attendance rates. Put another way, among students who ranked screened schools first (or educational option, or limited unscreened), low-achieving students tended to choose schools that fared worse on each academic performance measure.
Peer Composition and School Context
The composition of first-choice schools is important for at least two reasons. First, the student composition of incoming 9th graders determines the peer group that a rising 9th grader is choosing and will experience if matched to their first choice. Second, racially or economically isolated schools, and schools with high proportions of students with special needs, are likely to face resource, staffing, and other challenges that schools with lower concentrations of need may not.25
Figures 10-12 describe the student population of schools ranked first by low-achieving and all other students, including the average proficiency of incoming 9th graders in ELA and mathematics, the concentration of low-income students and students with unique educational needs (English Language Learners and special education), and the racial and ethnic composition of the school. We also examine the average size of the school that low-achieving and other students ranked first. It is important to point out that many of the differences observed here reflect the spatial distribution of low-achieving students across the City, and the characteristics of proximate schools. If students live in racially, linguistically, or economically isolated neighborhoods and tend to choose schools close to home, they will be more likely to experience schools with these characteristics. On the other hand, high school choice in New York City avails students of the opportunity to choose schools outside their neighborhood if they so desire. Our results reflect the characteristics of schools that low-achieving and other students choose in practice.
To begin, Figure 10 below shows how the average proficiency of incoming 9th graders compared at the first-choice schools of low-achieving and all other students in the year in which students applied to high school. This measure, which was not available until 2008, is used by the NYC DOE to assign schools to peer groups on the high school Progress Report, and ranges from 1 to 4.5. Rather than just reporting the average of students’ first choices, in this figure we show the entire distribution of proficiency rates at first-choice schools. That is, Figure 10 shows the proportion of low-achieving and other students’ first choices with a given average proficiency level in ELA and math.
Proficiency levels at the first choices of low-achieving students were, on average, lower than those at the first-choice schools of other students. (Keep in mind that these proficiency levels characterize the schools chosen, and are not just a reflection of the students themselves. The choosing students are not included in the proficiency measure.) We found that low-achieving students’ first-choice schools
Figure 10: Average 8th Grade Proficiency in ELA and Math of Incoming 9th Graders at First-Choice High Schools, 2008-2011
Note: Average proficiency levels are based on 8th grade ELA and mathematics scores for incoming freshmen, and range from 1
to 4.5. This measure was not available for the 2007 cohort. These proficiency averages reflect the year in which students
applied to high schools, and thus do not reflect the students in the sample. In other words, they capture the school as it looked to the student when he or she applied.
had an average incoming proficiency level of 2.795, as compared with 3.060 for all other students, a relatively large difference of 0.27. Figure 10 makes clear why these averages differ: Low-achieving students were less likely to rank first schools with high average levels of incoming student achievement, and were more likely to choose schools with lower levels of prior achievement.
Figure 11 below shows several other characteristics of students at first-choice high schools: the percent of students who were economically disadvantaged (approximated using the percent eligible for free or reduced price meals), the percent designated English Language Learners and the percent receiving special education services.26 Many NYC students qualify for subsidized meals, so the percent of students who were economically disadvantaged was high in most schools. However, as Figure 11 shows, the concentration of low-income students was higher in schools ranked first by low-achieving students than for those chosen by their higher-achieving peers (73 percent vs. 62 percent).
Figure 11: Average Peer Characteristics in First-Choice High Schools, 2007-2011
27.5 % 49.9 % 9.3 % 12.2 % 5.1 % 7.4 % 61.9 % 72.5 % 0 10 20 30 40 50 60 70 80 90 100 A ll o th e r Lo w -ac h iev ing A ll o th e r Lo w -ac h iev ing A ll o th e r Lo w -ac h iev ing A ll o th e r Lo w -ac h iev ing 90% m o re bl ac k /H is pani c S p ec ial E d uc at ion EL L E c o n o m ic a lly d is adv ant age d
The percentage of students designated as ELL was also somewhat higher, on average, in the first-choice school of low-achieving students (7 percent) than in the first-choice school of all other students (5 percent). The former was relatively close to the median for all schools citywide in 2011 (8 percent). The share of students receiving special education services was roughly 3 points higher at the average school ranked first by low-achieving students (12 percent) than at the average first choice of their higher-achieving peers (9 percent). Again, the former was relatively close to the citywide average during this period (12 percent).
Next, Figure 12 below shows the average racial/ethnic composition of first-choice schools using four categories: black, Hispanic, Asian, and white. There is, of course, considerable heterogeneity within each of these categories with respect to socioeconomic background, nativity and country of origin, as well as academic achievement. We merely use these categories to describe the extent of racial and ethnic diversity in schools preferred by low-achieving and other students.
New York City high schools in general have high shares of black and Hispanic students relative to Asian and white students, as is clear from Figure 12. The first-choice school of low-achieving students, however, had a higher average concentration of black and Hispanic students, and fewer white and Asian students, than those ranked first by their higher-achieving peers. For low-achieving students, the average first-choice school was 35 percent black, 44 percent Hispanic, 10 percent Asian, and 10 percent white. For all other students, the average was 28
Figure 12: Racial/Ethnic Composition of First-Choice High Schools, 2007-2011
Black 34.6 Black 27.9 Hispanic 43.6 Hispanic 33.9 Asian 10.3 Asian 17.7 White 10.2 White 19.1 Other 1.3 Other 0.7 0% 10% 20% 30% 40% 50% 60% 70% 80% 90% 100% Lo w -ac hi ev ing A ll o ther
percent black, 34 percent Hispanic, 18 percent Asian, and 19 percent white. (These are averages across schools; the average first-choice school was not necessarily this internally diverse).
School averages for the percent black, Hispanic, Asian, and white fail to capture cases of significant racial/ethnic isolation, so we looked closer at schools with especially high shares of any one racial or ethnic group. In New York City, there are fortunately few instances of severe racial/ethnic isolation in high schools, which we defined as 90 percent or more of enrollment from one group. (In 2011, only 5 percent, or 23 of 449 high schools, met this condition). We did find low-achieving students were more likely to rank a severely racially isolated school first than other students, but the percent doing so in both groups was very small (3.6 percent and 2.2 percent, respectively).
On the other hand, schools in which 90 percent or more of enrollment is black or Hispanic are much more common. (In 2011, 61 percent, or 274 of 449 high schools, met this condition). There were stark differences between low-achieving and all other students in the propensity to rank first a school with 90 percent or more black and Hispanic students, as seen in Figure 11. Across all years of the study, 50 percent of low-achieving students ranked a school with this profile first, as compared with 28 percent of all other students.
Finally, we examined the percent of low-achieving and other students ranking a
small high school as their top choice (defined as fewer than 500 students). School
size has been a focal point of school reform efforts in New York City, as large high schools have closed and been replaced by smaller themed schools. To the extent that small schools help promote better outcomes—and there is evidence that some do— the choice of a small school may be beneficial.27
We found that low-achieving students were more likely to choose a small school as their first choice, with nearly one third (31 percent) doing so, versus 24 percent of all other students. The propensity to choose a small school steadily increased over the study period, for both groups. However the growth was more rapid for low-achieving students (from 23 percent in 2005 to 39 percent in 2011). It is difficult to discern the extent to which these results reflect increasing demand for small schools or rising supply (and loss of large schools). As the City closed large comprehensive high schools, it replaced them with small schools in the same locations. Many of the
large schools phased out during the study period were in neighborhoods that have a high proportion of low-achieving students.
Location and Distance from Home
Often, characteristics of students’ first-choice schools reflect their geographic preferences and constraints. It may be that low-achieving students tend to choose schools with greater concentrations of other low-achieving and disadvantaged students because they reside near schools with these characteristics. As we saw in Figure 6, the lowest-achieving students are heavily concentrated in the most disadvantaged boroughs and neighborhoods. Perhaps not surprisingly, their choices are often proximate to and reflective of these neighborhoods.
Figure 13: Geographic Distribution of the First-Choice Schools of Low-Achieving Students by Zip Code, 2011