Decision-Making Processes
by
Louis J Botha
Thesis presented in partial fulfilment of the requirements for
the degree of Master of Science in Engineering Management
in the Faculty of Engineering at Stellenbosch University
Department of Industrial Engineering, University of Stellenbosch,
Private Bag X1, Matieland 7602, South Africa.
Supervisor: Dr. J.L. Jooste
Declaration
By submitting this thesis electronically, I declare that the entirety of the work contained therein is my own, original work, that I am the sole author thereof (save to the extent explicitly otherwise stated), that reproduction and pub-lication thereof by Stellenbosch University will not infringe any third party rights and that I have not previously in its entirety or in part submitted it for obtaining any qualification.
Signature: . . . . E.N. Louis J Botha
01/09/2015
Date: . . . .
Copyright © 2015 Stellenbosch University All rights reserved.
Abstract
Identifying Quantitative Relationships between Key
Performance Indicators in Support of Physical Asset
Management Decision-Making Processes
E.N. Louis J Botha
Department of Industrial Engineering, University of Stellenbosch,
Private Bag X1, Matieland 7602, South Africa.
Thesis: MScEng (Engineering Management) September 2015
Physical Asset Management (PAM) is increasingly being acknowledged by industry as an important contributor to the financial success of organisations, especially those who are dependent on their physical assets for organisational value creation. Amongst the PAM improvement opportunities identified by researchers and organisations is the derivation of additional, meaningful and innovative information from Key Performance Indicators (KPIs) for improved PAM decision-making process.
The Quantitative Relationships at the Performance Measurement System (QRPMS) methodology is an existing methodology which objectively identi-fies and quantiidenti-fies the relationships between a set of KPIs, and presents these relationships as additional information for PAM decision-making processes. QRPMS employs two mathematical techniques, Principal Components Anal-ysis and Partial Least Squares regression, to identify and quantify inter-KPI relationships, respectively. The Guttman-Kaiser criteria (K1) is employed by QRPMS to determine the number of principal components (PCs) to retain for further assessment. However, the K1 criterion is found to be one of the least reliable and most inaccurate selection criteria available, with some pub-lications using it without reservation. Therefore, the K1 criterion severely compromises the reliability and mathematical accuracy of the results obtained from QRPMS.
This study proposes an improved methodology for the objective identi-fication and quantiidenti-fication of inter-KPI relationships, called the Quantitative Identification of Inter-Performance Measure Relationships (QIIPMR) method-ology. A comprehensive literature study is conducted, investigating the realms of PAM, Performance Management (PM), Performance Management Systems (PMS) and performance measures. Existing frameworks and methodologies which aim to identify relationships between performance elements are inves-tigated, and their flaws identified. The literature study concludes with an investigation of PCA, PLS and selection criteria. The proposed QIIPMR methodology employs QRPMS as a foundational framework. Accurate and reliable alternatives to the K1 criterion are compared, and the most appropri-ate of these is incorporappropri-ated into QIIPMR.
A case study is conducted, comparing the results of QRPMS and QI-IPMR using real-world KPI data from an open-pit, thermal coal mine in South Africa. The case study results substantiate the improvement made to QRPMS methodology. This study concludes with recommendations for future research.
Uittreksel
Identifiseering van Gekwantifiseerde Verhoudinge tussen
Sleutel Prestasiewysers in Ondersteuning van
Besluit-Maakende Prosesse in Fisiese Bate Bestuur
(“Identifying Quantitative Relationships between Key Performance Indicators in Support of Physical Asset Management Decision-Making Processes”)
E.N. Louis J Botha
Departement Bedryfsingenieurswese, Universiteit van Stellenbosch,
Privaatsak X1, Matieland 7602, Suid Afrika.
Tesis: MScIng (Ingenieurswese Bestuur) September 2015
Fisiese Batebestuur (FB) word toenemend deur die industrie erken as ’n belangrike bydraer tot die finansiële sukses van organisasies, veral diegene wat afhanklik is van hul fisiese bates vir organisatoriese waarde skepping. Van die FB verbetering geleenthede wat geïdentifiseer is deur navorsers en organisa-sies, is die toepassing van bykomende, betekenisvolle en innoverende inligting van Sleutel Prestasieaanwysers (SP) vir verbeterde FB besluitnemingsprosesse. Die Kwantitatiewe Verwantskappe in die Prestasiemeting Sisteem (KVPS) metodologie is ’n bestaande metodologie wat die verhoudinge tussen ’n stel SP objektief identifiseer en kwantifiseer, en bied hierdie verhoudinge aan as bykomende inligting vir FB besluitnemingsprosesse. KVPS gebruik twee wis-kundige tegnieke, Hoof Komponente Analise (HKA) en Parsiële Kleinste Kwa-draat (PKK) regressie, om die identifisering en kwantifisering van SP verhou-dings onderskeidelik the bereken. KVPS neem die Guttman-Kaiser kriteria (K1) in diens om die aantal hoofkomponente (HKe) te bepaal wat behou moet word vir verdere assessering. Die K1 kriteria was egter gevind as een van die minste betroubaarste en mees onakkurate keuringskriteria beskikbaar, met ’n paar publikasies wat dit gebruik sonder voorbehoud. Dus, die K1 kriteria stel die betroubaarheid en wiskundige akkuraatheid van die KVPS metodologie in
groot gevaar.
Hierdie studie stel ’n verbeterde metodologie voor vir die identifisering en kwantifisering van SP verhoudings, genaamd die Kwantitatiewe Identifisering van Tussen-Prestasiemaatstaf Verhoudings (KITPV) metodologie. ’n Omvat-tende literatuurstudie is voltooi, en die areas van FB, Prestasiebestuur (PB), Prestasiebestuurstelsels (PBS) en prestasiemaatreëls is ondersoek. Bestaande raamwerke en metodologieë wat daarop gemik is om die verhoudinge tussen prestasie elemente te identifiseer is ook ondersoek, en hul foute is geïdentifi-seer. Die literatuurstudie word afgesluit met ’n ondersoek van HKA, PKK en seleksie kriteria. Die voorgestelde KITPV metodologie neem KVPS in diens as ’n fundamentele raamwerk. Akkurate en betroubare alternatiewe vir die K1 kriteria word vergelyk, en die mees geskikte van hierdie kriteria is opgeneem in hierdie KITPV.
’n Gevallestudie is onderneem, en die resultate van KITPV en KVPS is vergelyk met die hulp van werklike wêreld SP data van ’n oop-put, termiese steenkool myn in Suid-Afrika. Hierdie gevallestudie resultate staaf die verbe-tering aan die QRPMS metodologie. Hierdie studie sluit af met aanbevelings vir toekomstige navorsing wat geloots kan word.
Acknowledgements
This thesis would not have been completed without the aid, guidance and sup-port of multiple individuals. I would like to express my sincerest gratitude and appreciation to the following people and organisations.
• To my supervisor, Dr JL Jooste of the Department of Industrial Engi-neering at the University of Stellenbosch, for his continuous and dedi-cated support, time and effort expended in this thesis.
• To my good friends, Patrick O’Connell, Luke Potgieter and Genevieve Potgieter, for their effort and time expended in the pursuit of editing this thesis.
• To my fellow Masters colleagues, and good friends, for making the office and Masters experience a positive and entertaining one.
• To my friends outside of the University of Stellenbosch for supporting and encouraging me through the last months of my thesis.
• To my family, especially my parents, for their unwavering support, en-couragement, love and belief in me. Without their continuous motiva-tion, this thesis would not have been completed.
• And finally, my Lord and Saviour, Jesus Christ, for providing me with all the countless blessings I needed to complete this thesis (Joshua 24:15). The Author
September, 2015
Dedications
This thesis is dedicated to my grandfather, Louis J Botha Senior, who passed away on the 4 August, 2015. May you rest in peace, oupa. You will be sorely
missed.
Contents
Declaration i Abstract ii Uittreksel iv Acknowledgements vi Dedications vii Contents viiiList of Figures xii
List of Tables xiv
Nomenclature xv
Acronyms and Abbreviations xvii
1 Introduction 1
1.1 Introduction . . . 2
1.2 Problem Statement And Research Question . . . 5
1.3 Research Objectives . . . 7
1.4 Delimitation . . . 8
1.5 Research Design And Methodology . . . 9
1.6 Document Structure . . . 11
2 Literature Study 14 2.1 Chapter Introduction . . . 15
2.2 Physical Asset Management: A Brief Discussion . . . 16
2.2.1 Introducing Physical Asset Management . . . 16
2.2.2 PAM Standards . . . 19
2.2.3 The Link Between PAM And PM . . . 21
2.3 Performance Measurement and Management . . . 23
2.3.1 The Origin Of Performance Measurement . . . 24 viii
2.3.2 Performance Measurement . . . 26
2.3.2.1 Understanding and defining performance . . . . 27
2.3.3 Performance Measurement Frameworks And Systems . . 30
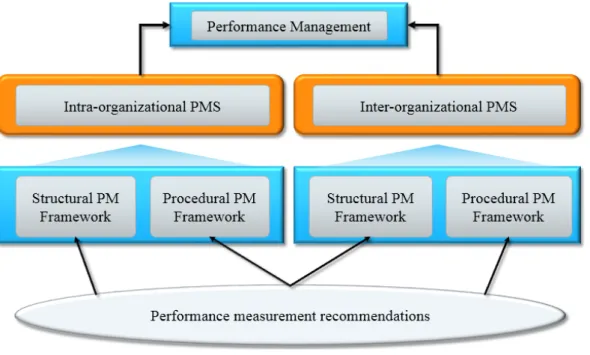
2.3.3.1 Performance Measurement recommendations . . 31
2.3.3.2 Performance Measurement Frameworks . . . 31
2.3.3.3 Performance Measurement Systems . . . 33
2.3.4 Towards Performance Management . . . 35
2.4 Performance Measures . . . 38
2.4.1 Financial Versus Non-financial Measures . . . 38
2.4.2 Key Performance Indicators . . . 40
2.4.3 The Primary Challenge Of KPIs . . . 42
2.4.3.1 The KPI perspective . . . 43
2.4.3.2 The KPI family . . . 44
2.4.3.3 The KPI category . . . 44
2.4.3.4 The KPI focus . . . 45
2.4.4 Errors In Measuring Non-Financial Performance . . . 45
2.4.4.1 Failure to link measures to strategy . . . 46
2.4.4.2 Failure to validate links between measures and strategy . . . 47
2.4.4.3 Setting incorrect performance targets . . . 48
2.4.4.4 Failure to measure correctly . . . 48
2.4.4.5 Claiming the promises of non-financial measures 49 2.4.5 Common Performance Measure Challenges . . . 50
2.4.5.1 Measure selection . . . 51
2.4.5.2 Abusing performance measures . . . 51
2.4.6 Relevant Characteristics Of KPIs . . . 53
2.4.6.1 Decision facilitation and influence of KPIs . . . 53
2.4.6.2 Relationships between performance measures . 54 2.5 Identifying And Quantifying Relationships Between Performance Measures . . . 56
2.5.1 Unsuitable Assessment Methodologies For Objective Iden-tification And QuanIden-tification . . . 57
2.5.1.1 The error in subjective analysis . . . 58
2.5.1.2 The deficiency of pair-wise correlation analysis . 58 2.5.2 Inadequate Frameworks For Identifying Inter-KPI Rela-tionships . . . 59
2.5.3 The Quantitative Model For Performance Measurement System . . . 60
2.5.4 The Quantitative Relationships At Performance Man-agement System Methodology . . . 61
2.6 Principal Components Analysis And Partial Least Squares . . . 65
2.6.1 Multivariate Analysis . . . 65
2.6.2 Principal Component Analysis . . . 66
2.6.4 Partial Least Squares . . . 68
2.7 Selection Criteria For Multivariate Statistics . . . 69
2.7.1 The Guttman-Kaiser Criterion . . . 70
2.7.2 The Scree Plot . . . 72
2.7.3 The Parallel Analysis Criterion . . . 73
2.7.4 The Minimum Average Partial Procedure . . . 75
2.8 Chapter Conclusion . . . 76
3 The Quantitative Identification Of Inter-Performance Mea-sure Relationships Methodology 77 3.1 Chapter Introduction . . . 78
3.2 Approach To Framework Development . . . 79
3.3 The Quantitative Relationships In Performance Measurement System Methodology . . . 79
3.3.1 The QRPMS Methodology Phases . . . 80
3.3.1.1 Phase 1: Design and analysis of the PMS . . . 81
3.3.1.2 Phase 2: Initial data treatment . . . 81
3.3.1.3 Phase 3: Identification and projection of KPI relationships . . . 83
3.3.1.4 Phase 4: Presentation and analysis of results . . 85
3.4 Selection Criteria Comparison And Selection . . . 87
3.5 The Quantitative Identification Of Inter-Performance Measure Relationships Methodology . . . 90
3.5.1 Objectives And Phases Of QIIPMR . . . 90
3.5.2 Execution Of The QIIPMR Phases And Processes . . . . 94
3.6 Chapter Conclusion . . . 94
4 Case Study 96 4.1 Chapter Introduction . . . 97
4.2 Case Study Overview . . . 97
4.2.1 Case Study Objectives And Delimitations . . . 98
4.2.2 QIIPMR And QRPMS Constituent Selection For Exe-cution . . . 99
4.3 Data Collection And Treatment . . . 100
4.3.1 Data Source Approval . . . 100
4.3.2 Data Requirements And Collection . . . 101
4.3.3 Data Treatment . . . 101
4.4 PCA and Selection Criteria . . . 103
4.4.1 Exploratory And Confirmatory PCA . . . 103
4.4.2 SPSS PCA Results . . . 104
4.4.3 Selection Criteria Employment . . . 106
4.4.3.1 Guttman-Kaiser criterion . . . 106
4.4.3.2 Scree Plot criterion . . . 107
4.5 Results Discussion . . . 110
4.5.1 Selection Criteria Results . . . 110
4.5.1.1 Approach to selection criteria results discussion 110 4.5.1.2 Selection criteria results discussion . . . 112
4.5.2 Post-confirmatory PCA Results Discussion . . . 116
4.5.3 Identifying Inter-KPI relationships . . . 119
4.6 Substantiation Of The QIIPMR Methodology . . . 123
4.7 Chapter Conclusion . . . 124
5 Conclusion And Recommendations 125 5.1 Summary And Conclusion . . . 126
5.2 Limitations . . . 128
5.3 Recommendations For Future Research . . . 129
Appendices 131 A The Balanced Scorecard 132 B Overview Of Mathematical Techniques 137 B.1 The PCA Method: A Brief Mathematical Description . . . 137
B.1.1 Mean Normalisation And (Optional) Feature Scaling . . 137
B.1.2 Calculating Original Covariance Matrix . . . 138
B.1.3 Calculating Eigenvectors . . . 138
B.1.4 Obtaining Eigenvector Containing Matrix . . . 139
B.1.5 Computing Principal Components . . . 139
B.1.6 Representing Original Data . . . 140
B.2 Brief Mathematical Description Of PLS Regression . . . 140
C Designation Of Case Study KPIs 143
D Plotted Data Of Selection Criteria 148
List of Figures
1.1 The scope of Physical Asset Management (PAM) . . . 3 1.2 Research design framework . . . 9 1.3 Document structure . . . 12 2.1 The flow between the investigated literature topics in Chapter 2 . . 15 2.2 The asset scope of Publicly Available Specification 55 (PAS 55) . . 19 2.3 The Institute of Asset Management (IAM) conceptual model of PAM 22 2.4 The asset hierarchy within an integrated management system . . . 23 2.5 The development towards total Performance Measurement (PM):
Part 1 . . . 25 2.6 The development towards total Performance Measurement (PM):
Part 2 . . . 25 2.7 Customer satisfaction with influencing performance factors . . . 29 2.8 Performance causal model over multiple organisational levels of
re-sponsibility . . . 29 2.9 Performance management: a simplified process . . . 35 2.10 The evolution of performance measurement to performance
man-agement . . . 37 2.11 The strategic alignment pyramid: steps for transforming
organisa-tionalvision into Key Performance Indicators (KPIs) . . . 43
2.12 Piecewise relationships between pairs of Key Performance Indica-tors (KPIs) . . . 55 2.13 Identification and knowledge flow of inter-KPI relationships . . . . 63 2.14 The scree plot: an example . . . 72 2.15 Parallel Analysis: an example plot . . . 74 2.16 An example of the Minimum Average Partial procedure . . . 76 3.1 The development flow of the Quantitative Identification of
Inter-Performance Measure Relationships (QIIPMR) methodology . . . . 78 3.2 Phases of the Quantitative Relationships at the Performance
Mea-surement System (QRPMS) methodology . . . 80 3.3 Key Performance Indicator (KPI) loadings between two principal
components (PCs) . . . 84
3.4 Graphic of Business Driver Key Performance Indicator (BDKPI)
relationships: an example . . . 86
3.5 Graphic of projections deployment: an example . . . 87
3.6 A comparison of three selection criteria . . . 89
3.7 The QIIPMR methodology . . . 93
3.8 The development flow of the QIIPMR methodology. . . 95
4.1 The development flow of the case study . . . 97
4.2 Plot of the Guttman-Kaiser criterion (K1) principal component (PC) cut-off . . . 106
4.3 Scree plot of the real PCs . . . 107
4.4 Parallel Analysis (PA) plot of the real PCs . . . 109
4.5 Number of KPIs with loading coefficients exceeding the absolute value of 0.4 (for the first 19 PCs) . . . 112
4.6 Number of KPIs with loading coefficients exceeding the absolute value of 0.6 (for the first 19 PCs) . . . 113
4.7 Percentage of original data’s variance explained by each of the first 19 PCs . . . 114
4.8 Individual KPI variance explained by the 4 chosen PCs . . . 117
4.9 KPI variability extracted (in specific percentage ranges) by the 4 chosen PCs . . . 118
4.10 KPI loadings between the first and second PCs . . . 119
4.11 The development flow of the case study . . . 124
A.1 The Balanced Scorecard: strategy from the four perspectives . . . . 133
B.1 A depiction of the general model underlying Partial Least Squares (PLS) . . . 141
D.1 Plot of Guttman-Kaiser criterion (K1) PC cut-off . . . 149
D.2 Parallel Analysis (PA) plot of the real PCs . . . 150
D.3 Scree plot of the real PCs . . . 151
D.4 KPI loadings between the first and second PCs . . . 152
D.5 KPI loadings between the first and third PCs . . . 153
List of Tables
1.1 Study null hypothesis (H0) . . . 7
1.2 Summary of research objectives . . . 7
1.3 Research design constituents . . . 10
1.4 Summary of present study’s research design . . . 11
2.1 Description of the KPI families . . . 44
2.2 Solution to claiming the promises of non-financial performance mea-sures . . . 50
3.1 Comparison ratings of the selection criteria . . . 89
3.2 Description of the QIIPMR phases and their respective constituents 92 4.1 Case study objectives . . . 99
4.2 Data collected from PCA . . . 104
4.3 Data collected from PCA and PA . . . 108
4.4 Case study results: selection criteria . . . 110
4.5 Post Principal Component Analysis (PCA) results: correlations be-tween PCs . . . 118
4.6 QIIPMR results: BDKPIs (computed using PA and the scree plot) 120 4.7 QRPMS results: BDKPIs (computed using K1) . . . 121
4.8 BDKPI comparison results . . . 121
4.9 QIIPMR results: KPI loading coefficients (4 PCs) . . . 122
4.10 QRPMS results: KPI loading coefficients (19 PCs) . . . 122
C.1 KPIs for Operations . . . 144
C.2 KPIs for Engineering - Table 1 . . . 145
C.3 KPIs for Engineering - Table 2 . . . 146
C.4 KPIs for Safety and Human Resources . . . 147
C.5 KPIs for Finance . . . 147
Nomenclature
PCA variablesp Number of original variables used in PCA.
n Number of samples, or observations, of each original variable in PCA. xp pth original variable assessed in PCA.
zp pth principal component, see Equation B.1.8 and Equation B.1.9.
S Covariance matrix used in PCA, see Equation B.1.1. U Orthonormal matrix, see Equation B.1.3.
L Diagonal matrix, see Equation B.1.4. I Identity matrix, see Equation B.1.5. ui ith eigenvector, see Equation B.1.6.
FV Feature vector, see Equation B.1.10 and Equation B.1.11. PLS variables
m Number of predictors variables.
n Number of sample values or observations. p Number of observable variables.
X Matrix containing the predictor variables, see Equation B.2.1. Y Matrix containing the observable variables, see Equation B.2.2. T Projection matrix of X, see Equation B.2.1.
U Projection matrix of Y, see Equation B.2.2. P Orthogonal loading matrix, see Equation B.2.1. Q Orthogonal loading matrix, see Equation B.2.2. E Matrix containing error terms, see Equation B.2.1. F Matrix containing error terms, see Equation B.2.2. KPI variables and units
BCM Basic Cubic Meter . . . [m3]
CV Calorific Value . . . [C]
DOH Direct Operating Hours. . . [hours]
ROM Run of Mine . . . [tons]
Acronyms and Abbreviations
AHP Analytical Hierarchy Process
AM Asset Management
AMDM Asset Management Decision-Making
AMS Asset Management System
ANOVA Analysis of Variance
BCM Basic Cubic Meter
BDKPI Business Driver Key Performance Indicator BDKPIs Business Driver Key Performance Indicators BPR Business Process Re-engineering
BSC Balance Scorecard
BSI British Standards Institute
CBDKPIs Causal Business Driver Key Performance Indicators
CV Calorific Value
DOH Direct Operating Hours
EA Equipment Availability
FA Factor Analysis
FME Total Monthly Employees
GFMAM Global Forum on Maintenance and Asset Management
HPI High Potential Incidents
IAM Institute of Asset Management
ISO International Organisation for Standardisation xvii
K1 Guttman-Kaiser criterion
KPI Key Performance Indicator
KPIs Key Performance Indicators
LTI Lost Time Injury
MAP Minimum Average Partial
MANOVA Multivariate Analysis of Variance MAUT Multi-Attribute Utility Theory MCDA Multi-Criteria Decision Analysis
PA Parallel Analysis
PAM Physical Asset Management
PAS 55 Publicly Available Specification 55
PC principal component
PCs principal components
PCA Principal Component Analysis
PLS Partial Least Squares
PM Performance Measurement
PMa Performance Management
PMaS Performance Management System(s)
PMS Performance Measurement System(s)
PMF Performance Measurement Framework(s)
QIIPMR Quantitative Identification of Inter-Performance Measure Relationships
QMPMS Quantitative Model for Performance Measurement Sys-tem
QRPMS Quantitative Relationships at the Performance Measure-ment System
ROM Run of Mine
SEM Structural Equation Model
SPSS Statistical Package for the Social Sciences
Chapter 1
Introduction
Chapter Aims:
Chapter 1 aims to introduce the reader to this study’s field of research, as well as the fundamental elements it is comprised of. This chapter formulates the research question and accompanying research objectives.
Chapter Outcomes:
⇒ Introduction to the research domain
⇒ Research problem statement
⇒ Research objectives
⇒ Study delimitations
⇒ Research design and methodology
1.1
Introduction
Recent years have proved to be a time of significant progress and develop-ment for Physical Asset Managedevelop-ment (PAM), an Asset Managedevelop-ment (AM) field specifically focused on the optimal management of physical assets. In 2004, a standard specification for PAM was developed through a collabora-tion between the institutes, British Standards Institute (BSI) and Institute of Asset Management (IAM). The standard was called the Publicly Available Specification 55 (PAS 55); this was the first standard published in support of PAM.
In 2008, PAS 55 was revised to reflect the growing international consensus for good practices in PAM. However, even after this review, PAS 55 provided guidelines on what should be done in PAM, but lacked details on how to complete such tasks (van den Honert et al., 2013). In early 2014, the
Interna-tional Organisation for Standardisation (ISO) published the ISO 55000 series of standards; a family of international standards for PAM. van den Honert
et al. (2013) assert that the ISO 55000 series uses the content and primary
concepts of PAS 55 as its foundation with the intent of providing a more user-friendly and instructive standard for PAM.
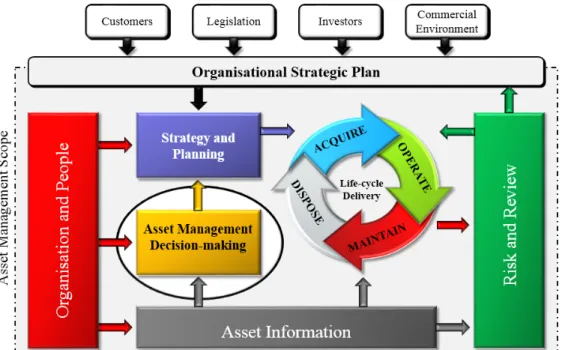
The ISO 55000 series was complimented with an additional document from the Global Forum on Maintenance and Asset Management (GFMAM); a spec-ification called the ISO 55001 Auditor/Assessor Specspec-ification. This specifica-tion aims to help organisaspecifica-tions identify individuals who are able to help the organisation realise the value of PAM. In light of these publications, IAM (2014) published a document that provides an overview of PAM, defines its scope, and describes its fundamental concepts and philosophies. The concep-tual model of PAM used by IAM (2014) is depicted in Figure 1.1.
IAM (2014) created this model to represent the global scope of PAM and its high-level groups of activities. As can be seen in Figure 1.1, a diverse col-lection of elements constitutes the working parts of PAM, each consisting of numerous sub-activities. This clear description of PAM allows researchers and organisations to better identify improvement opportunities in PAM. Of partic-ular interest to this study is the high-level PAM activity: Asset Management Decision-Making.
IAM (2014) states a key contributing factor to effective and good PAM decision-making, is the provision and employment of appropriate information. Arguably the most common type of information involved in the management of physical assets is asset performance information; information that sheds light on how well a physical asset is performing and being utilised by an or-ganisation. The activities enabling organisations to quantify and manage the
Figure 1.1: The scope of PAM Adapted from IAM (2014)
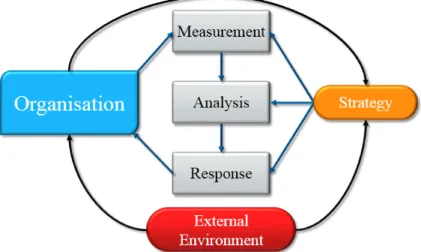
effectiveness and efficiency of their actions and physical assets are Performance Measurement (PM) and Performance Management (PMa). These two activi-ties employ Performance Measurement System(s) (PMS), which according to Amaratunga and Baldry (2002), are systems which monitor and maintain or-ganisational control.
In order to quantify asset performance, PMS employ performance mea-sures; measurements designed to provide specific information of a process,
asset or entity for their effective management. Performance measures can pro-vide a variety of information, from how well an objective is being accomplished by an organisation, to the impact a physical asset has on the profitability of an organisation (Chenhall and Langfield-Smith, 2007). The two prominent classi-fications of performance measures are financial and non-financial performance measures. Financial performance measures were the first to be developed, and emerged during the Industrial Revolution as a method of justifying (in finan-cial terms) the massive finanfinan-cial investments made into physical assets during that time (Jooste and Page, 2004).
However, as the years passed, it became apparent to organisations that financial measures were inadequate to fully represent the performance charac-teristics that were important to financial success (Kaplan et al., 1998; Neely,
1999). Organisations started employing non-financial performance measures to yield information on the performance characteristics that could not be repre-sented in monetary terms, such as customer satisfaction, responsiveness, qual-ity and flexibilqual-ity (Kaplan and Norton, 1992; van Veen-Dirks, 2010). Although the limitations of financial measures were identified by numerous publications, including Ghalayini and Noble (1996), PM consultants still encourage their continued employment (Chenhall and Langfield-Smith, 2007). A mixture of financial and non-financial performance measures overcomes the limitations of employing a single class of performance measure (Stivers et al., 1998; van
Veen-Dirks, 2010).
There are hundreds, possibly thousands, of established performance mea-sures which organisations can choose from. The effective employment and monitoring of all performance measures available to an organisation is not a feasible solution (Atkinsonet al., 1997). As a result, organisations choose
spe-cific performance measures; measures which they believe deliver information on the most critical performance elements or characteristics of the respective organisation. These specifically selected performance measures are referred to as Key Performance Indicators (KPIs). A Key Performance Indicator (KPI) is a quantifiable measure which represents an organisation’s performance in achieving its strategic goals and objectives (Bauer, 2004b; Liu et al., 2015).
Amongst the PAM improvement opportunities identified by researchers and organisations is the derivation of additional, meaningful information from the KPIs employed by an organisation, according to Ittner and Larcker (2003), Jagdev et al. (2004), Merchant (2006), and Harmon and Wolf (2008). This
additional information can be found through investigating the relationships that exist between a set of KPIs (Rodríguez et al., 2010). This information
may thus prove useful to PAM and PM if the knowledge of these inter-KPI relationships are employed in decision-making processes.
The cause-effect relationships between the KPIs found in Supply Chain Management (SCM) were investigated by Cai et al. (2009). Cai et al. (2009)
sought to utilise this source of additional information in order to prioritise KPIs for their iterative accomplishment. The difficulty of identifying these cause-effect relationships was acknowledged, but they also state that it is im-portant for organisations to be able to describe the relationships between its KPIs for improved strategic and managerial decision-making.
To date, very little research has been conducted on the intricate relation-ships which exist between KPIs (Patel et al., 2008). Audits revealed that
inter-KPI relationships in a PMS are not adequately understood, and therefore improperly accounted for (Bititci et al., 2001). The limited research however
few, which aim to uncover and employ the additional information of these inter-KPI relationships.
Suwignjo et al. (2000), Youngblood and Collins (2003), Bauer (2005),
and Cardona Siado and García (2005) developed frameworks and method-ologies employing the concept of relationships between performance elements to achieve their respective objectives. However, it was only the Quantitative Relationships at the Performance Measurement System (QRPMS) methodol-ogy, proposed by Rodriguez et al. (2009), which aimed to objectively identify
and quantify relationships between a set of KPIs, and present these relation-ships as additional information for PM and PMa decision-making processes. Rodriguez et al. (2009) argued that subjective analytical techniques, as well
as piece-wise correlation analysis, were inadequate to complete a truly objec-tive and all-considering analysis of inter-KPI relationships. These analytical techniques were employed by the methodologies and frameworks developed by the aforementioned publications.
The QRPMS methodology is, to the knowledge of this study, the only available methodology that objectively identifies and quantifies inter-KPI re-lationships, as well as actively projects the collected information upstream of a PMS for improved decision-making processes (Rodriguezet al., 2009).
Con-sidering this, and the aforementioned lack of research completed on inter-KPI relationships, it is evident that the QRPMS methodology is of critical impor-tance to PM, and by relation, PAM. It is therefore imperative to investigate opportunities for its improvement or further development.
1.2
Problem Statement And Research Question
Rodriguez et al. (2009) assessed the frameworks and methodologies proposed
by Suwignjo et al. (2000), Youngblood and Collins (2003), Bauer (2005), and
Cardona Siado and García (2005). These frameworks and methodologies pro-posed methods of identifying and quantifying relationships between various performance elements. Rodriguez et al. (2009) found these to be inadequate
for the objective identification and quantification of relationships between a set of KPIs due to the subjective analysis and pair-wise correlation analysis techniques they employed.
In response to the inadequacies identified in the aforementioned frame-works and methodologies, Rodriguez et al. (2009) proposed the Quantitative
Relationships at the Performance Measurement System (QRPMS) methodol-ogy. QRPMS is a methodology which actively avoids the use of any subjec-tive analytical and pair-wise correlation techniques. The QRPMS methodol-ogy employs two mathematical techniques to complete the objective
identi-fication and quantiidenti-fication of inter-KPI relationships. Principal Component Analysis (PCA) is employed to identify the relationships, and Partial Least Squares (PLS) analysis is utilized to quantify these relationships; two tech-niques that, according to Rodriguez et al. (2009), are completely objective
analytical techniques due to the exclusion of biased interference. Further in-vestigation of the constituents of the QRPMS methodology revealed a critical step in the final stages of PCA.
PCA is a multivariate statistical technique through which the important in-formation found in a multivariate dataset can be reproduced, with minimal loss of information, by new and fewer variables called principal components (PCs). Tabachnicket al. (2001) describe principal components (PCs) as linear
combi-nations of the original variables; linear combicombi-nations that are uncorrelated to each other. PCA computes a number of PCs that are equal to the total number of variables (KPIs, within this context) being assessed by PCA (Tabachnick
et al., 2001). The total information captured by all of the PCs is equal to the
total information found in the aforementioned multivariate dataset (the set of KPIs). The critical step is thus how to select the appropriate number of PCs to retain for further analysis, whilst suffering minimum loss of information from the original dataset.
The selection of the appropriate number of PCs in PCA is carried out using rules or techniques referred to as selection criteria. The QRPMS methodology employs the Guttman-Kaiser criterion (K1), which has found to be a very pop-ular selection criterion among researchers (Yeomans and Golder, 1982; Lance and Vandenberg, 2009). However, Yeomans and Golder (1982) and Lance and Vandenberg (2009) found K1 to be one of the least reliable and most inaccurate selection criteria available, with some publications using it without reservation. This claim is supported by Zwick and Velicer (1986), Velicer et al. (2000) and
Cortina (2002), stating in unison that K1 can not be recommended for use in PCA and should be discarded from the list of acceptable selection criteria.
The problem is the employment of Guttman-Kaiser criterion (K1), in the QRPMS methodology, severely compromises the reliability and mathematical accuracy of the results obtained from QRPMS. Considering this, and the critical importance of the QRPMS methodology to PM and PAM as stated in Section 1.1, it is of utmost importance to seek a solution to the research question of this study; a question formulated from the aforementioned problem stated. The research question is stated as follows:
Can the Quantitative Relationships at the Performance Mea-surement System (QRPMS)methodology be modified and improved through the incorporation of a more accurate and reliable selection
criteria to ensure true and dependable information of the relation-ships between Key Performance Indicators (KPIs) is delivered?
This study will aim to disprove the null hypothesis (H0) derived from the
research question stated above, which is specified in Table 1.1.
Table 1.1: Study null hypothesis (H0)
H0:
The Quantitative Relationships at the Performance Measurement System (QRPMS)methodology cannot be improved and modified to yield more accurate and reliable results through the employment of an alternative selection criteria used in the execution of Principal Component Analysis (PCA).
1.3
Research Objectives
This aim of this study is to answer the research question stated in Section 1.2. The answer is systematically developed through completing a sequence of research objectives. The research objectives of this study are listed in Table 1.2.
Table 1.2: Summary of research objectives
Chapter # Research objective
2 1. Establish the fundamentals of PAM, PM, PMS and KPIs.
2. Investigate the academic literature of, and methodologies founded on,
inter-KPI relationships.
3. Investigate the mathematical techniques employed by QRPMS to
identify and quantify inter-KPI relationships.
3 4. Describe the phases of QRPMS.
5. Compare and select an alternative selection criteria to the K1
criterion.
6. Develop an improved methodology founded on the QRPMS
methodology.
4 7. Determine the number of PCs to retain using the QRPMS
methodology, and the methodology developed by this study.
8. Validate the developed methodology through a comparison and
analysis of results.
5 9. Draw conclusions from the results analysis.
The first three research objectives listed in Table 1.2 entail the establish-ment of the fundaestablish-mental key concepts upon which this study is founded, form-ing the research domain of this study. In Chapter 2, these objectives are achieved by completing a thorough literature study on specific literature top-ics. Clear and logical relationships between the literature topics are provided to improve the comprehension and accumulation of the required knowledge to complete the remaining research objectives.
In Chapter 3, the next three research objectives listed in Table 1.2 are completed. Although the QRPMS methodology is introduced in Chapter 2, Chapter 3 carries out the detailing of its executable phases. A comparison of alternative selection criteria is performed, resulting in the selection of an adequate alternative selection criteria. Finally, an improved methodology is developed for the objective identification and quantification of inter-KPI rela-tionships.
In Chapter 4, the seventh and eighth research objectives of this study are completed by means of a case study. The case study employs data collected from a thermal coal mine located in South Africa. The seventh research ob-jective entails the computation of the appropriate number of PCs to retain for further analysis using both QRPMS and the methodology developed in Chap-ter 3. The following research objective constitutes the validation of the new methodology developed in Chapter 3.
The remaining research objectives are completed in Chapter 5. Conclusions are drawn from the results in Chapter 4, determining the applicability and effectiveness of the developed methodology. These conclusions answer the research question stated in Section 1.2, allowing the stated null hypothesis to be either rejected or not.
1.4
Delimitation
Leedy and Ormrod (2005) state it is important to clarify the delimitations of a study prior to its presentation of research. Delimitations enable a study to better remain within the boundaries of its research scope. It also aids the reader in maintaining focus on what the study’s aim is. The focus of this study is on developing an improved methodology for the objective identification and quantification of inter-KPI relationships. The following boundaries apply to this study:
• This study is bound to the field of PM and PMa, contributing to the ongoing research being conducted in the optimisation of the decision-making activity within the scope of PAM.
• This study is bound to the identification and quantification of relation-ships between KPIs only; it does not aim to assess relationrelation-ships between other performance elements.
• This study focuses solely on the improvement of the QRPMS methodol-ogy through the identification and employment of more accurate, alter-native selection criteria.
• The case study conducted will only employ KPI data from a single ther-mal coal mine in South Africa.
• The case study conducted will only focus on the validation of the alter-ations made to the QRPMS methodology. A complete execution of the QIIPMR methodology will not be carried out.
The above listed statements concludes the delimitations for this study.
1.5
Research Design And Methodology
The plan, or guide, of an intended research process is referred to as the research design. Creswell (2002) assert that the research design entails the overlapping and intersection of three elements: specific research methods, philosophical world-views and strategies of enquiry. These three elements and their
interac-tions are depicted in Figure 1.2 and are detailed in Table 1.3.
Figure 1.2: Research design framework Adapted from Creswell (2002)
There exist three categories of research design: qualitative, quantitative
and mixed-methods (Mouton, 2001; Edmonds and Kennedy, 2012).
Table 1.3: Research design constituents
Constituents Description and content
Research Designs: Qualitative, quantitative or mixed methods.
An overlapping of research methods, philosophical world-views and strategies of inquiry.
Research Methods: Data collection and statistical-based analysis.
Instrument-based questions and validation. Interpretation and write-up.
Philosophical World-views: Post-positivism.
Pragmatic. Social construct.
Advocacy / participatory
Strategies of Inquiry: Qualitative strategies.
Quantitative strategies. Mixed-methods strategies.
of research. However, Newman and Benz (1998) and Baum (2012) state that it should not be viewed as two distinct classes of research, but rather two ends of a continuum. According to Newman and Benz (1998) and Mouton (2001), research either leans towards a more qualitative approach than quantitative, or vice versa. Furthermore, the mixed-methods category describes a research design that falls in between the other two categories.
The aforementioned qualitative approach to research, according to Creswell (2002), can be advantageous because of its exploratory nature. It allows many fields of research to be investigated and considered, while carrying out little, in-depth research in each field. Qualitative research includes the collection and assessment of subjective data generated from processes such as interviews and
interpretations, and employs open-ended questions and subjective arguments (Creswell, 2002).
Quantitative research, however, involves the collection and assessment of
objective data generated from methods or techniques that use mathematical
principles or experimental procedures (Welmanet al., 2005). It employs
close-ended questions or hypothesis and numerical and factual information. The mixed-methods approach to research design is therefore a study that involves the characteristics of both qualitative and quantitative approaches.
With regard to this study, the quantitative approach to research is em-ployed due to the objective nature of the mathematical concepts investigated and the respective data delivered from each. Although multiple topics are
in-vestigated in this study, they are studied in-depth and follow a logical progres-sion that leads to a comprehensive, objective answer to the research question stated in Section 1.2.
In addition to the clarification of which research design approach is to be followed by this study, Creswell (2002) states a philosophical world-view is adopted by the researcher, and must therefore be stated as well. The philo-sophical world-views are: post-positivism, pragmatism, social constructivism
and advocacy, as first introduced in Table 1.3. These are fully detailed by
Creswell (2002) and will thus not be repeated here.
The philosophical world-view of post-positivism best characterises the re-search completed in this study. Creswell (2002) states that rere-search carried out in a post-positivism manner entails the sequential completion of the following elements: introductory theory, literature review, methodology development and a results assessment which refutes or does not refute the introductory the-ory.
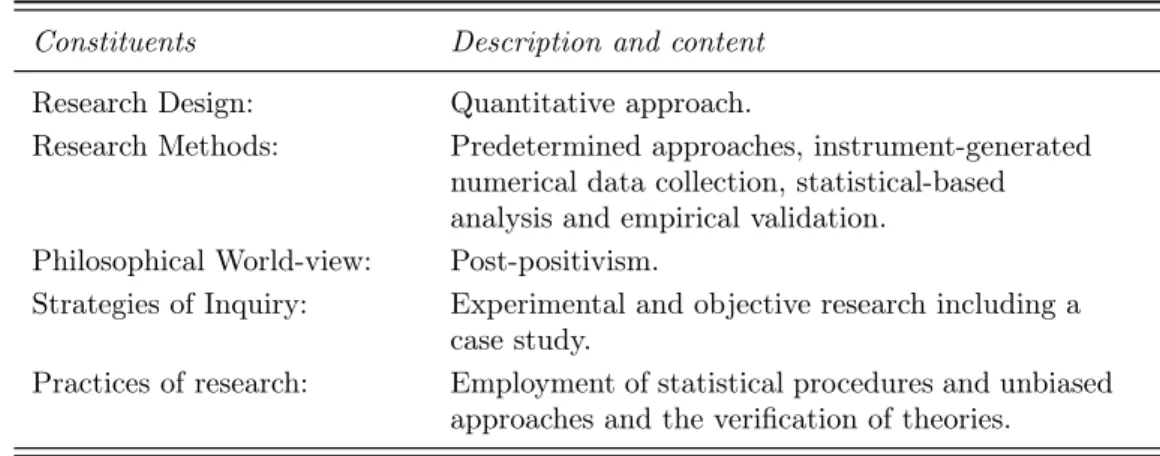
The research design of this study therefore, in conclusion, employs a quan-titative approach that is based on a post-positivism philosophical world-view. This research design is summarised in Table 1.4.
Table 1.4: Summary of present study’s research design
Constituents Description and content
Research Design: Quantitative approach.
Research Methods: Predetermined approaches, instrument-generated
numerical data collection, statistical-based analysis and empirical validation.
Philosophical World-view: Post-positivism.
Strategies of Inquiry: Experimental and objective research including a
case study.
Practices of research: Employment of statistical procedures and unbiased
approaches and the verification of theories.
1.6
Document Structure
This section describes the structural layout of this study; a structure specif-ically aligned with the research objectives listed in Table 1.2. Included in Section 1.3 is a brief discussion of the research objectives to be achieved by
each chapter in this study. This discussion includes information, albeit incom-plete, detailing the content of each chapter. A brief summary of each chapter’s complete content is therefore provided in the following sections. Figure 1.3 de-picts the chapter layout and the core topics of discussion.
Figure 1.3: Document structure
The structural layout depicted by Figure 1.3 corresponds to the research methodology and design stated in Section 1.5. As a result, this structure allows the reader to follow and comprehend the laminated knowledge contained in each chapter.
Chapter 1: Introduction
Chapter 1 introduces the reader to the research undertaken in this study through a description of the research domain and core concepts of this study. A problem statement is presented which is translated piecewise into research objectives. Following the progression of the research objectives, the delimita-tions of this study can be defined, allowing a research design and methodology to be developed. A description of the study structure is finally provided as a conclusion to this chapter.
Chapter 2: Literature Study
Chapter 2 begins the logical progression for finding an answer to the re-search question stated in Section 1.2 by first describing the PAM landscape.
Stemming from this landscape, the literature review covers the concepts of PM, PMa, PMS, KPIs and inter-KPI relationships. Existing frameworks and methodologies that employ the concept of inter-KPI relationships are investi-gated, as well as the mathematical techniques and rules employed. Through the investigation of these topics and concepts, the chapter collates the neces-sary information for the development of the methodology in Chapter 3. Chapter 3: The Quantitative Identification of Inter-Performance Measure Relationships Methodology
Chapter 3 develops an improved methodology for the objective identification and quantification of relationships between a set of KPIs. This methodology, called the Quantitative Identification of Inter-Performance Measure Relation-ships (QIIPMR) methodology, is this study’s proposed solution to the problem stated in Section 1.2. The QIIPMR methodology is discussed and all of its constituents are detailed.
Chapter 4: Case Study
The QIIPMR methodology (which is developed in Chapter 3) is validated as the solution methodology to a real world problem. The deliverables of the QIIPMR methodology are compared to those of its predecessor, the QRPMS methodology. A comparison study is completed and an assessment of the results presented. The validation of the QIIPMR methodology results are provided as the conclusion to this chapter.
Chapter 5: Conclusion and Recommendations
A reflection of the research is presented in Chapter 5, along with a dis-cussion of the limitations of the study. Final conclusions are formulated which provide an answer to the research question presented in Section 1.2. In addi-tion, the null hypothesis is tested and either rejected or not rejected. Chapter 5 concludes the study by providing recommendations and opportunities for future research.
Chapter 2
Literature Study
Chapter Aims:
This chapter aims to introduce and investigate the primary research topics of this study, as well as their accompanying peripherals, in a logical sequence to aid in the conceptualisation and comprehension of this study’s research question. The information gathered through this research is intended to facilitate the laminated development of the knowledge required to answer to the aforementioned research question.
Chapter Outcomes:
⇒ Familiarisation with, and understanding of, the topics relevant to this study.
⇒ Comprehension of the links between the fundamental research topics.
⇒ Comprehension of the elements which constitutes the research question.
2.1
Chapter Introduction
The literature topics required to conceptualise the research question stated in Section 1.2 are described and investigated in this chapter. The aforementioned literature topics are introduced in a sequential manner with relationships link-ing the topics. This flow pattern is depicted in Figure 2.1.
Figure 2.1: The flow between the investigated literature topics in Chapter 2
The concept of Physical Asset Management (PAM) is first introduced, de-scribing it with respect to the common concept of Asset Management (AM). A brief overview of the international standards for PAM is provided, establish-ing the link between PAM and the fields of Performance Measurement (PM) and Performance Management (PMa). Following this is the introduction and description of PM and PMa. Upon completion, the respective systems em-ployed by PM and PMa, Performance Measurement System(s) (PMS) and Performance Management System(s) (PMaS), are investigated as well as the elements employed by these systems, performance measures and Key Perfor-mance Indicators (KPIs).
The Quantitative Relationships at the Performance Measurement System (QRPMS) is the methodology on which this study aims to improve. Phase 1 of the QRPMS methodology requires the basic knowledge of how to design and implement, or adopt, a PMS. Therefore, the discussion of PMS and PMaS is orientated at a general overview of PMS development and includes relevant sources for more, in-depth guidance. Furthermore, performance measures and KPIs are also discussed in a manner similar to that of PMS and PMaS, facili-tating the inclusion of recommendations and discussions of their problems, as well as the challenges met in their development and implementation. It is for this reason why Section 2.3 and Section 2.4 contributes to the majority of the literature in this chapter.
Following the discussion of PMS and KPIs, an investigation is carried out regarding frameworks which aim to identify relationships between per-formance elements. Following the guidance of Rodriguez et al. (2009),
exist-ing frameworks are introduced and their individual inadequacies are briefly discussed with respect to the assessment techniques they employ. The afore-mentioned QRPMS methodology is among these frameworks, and is singled out and described in more detail. The mathematical procedures employed by the QRPMS methodology, Principal Component Analysis (PCA) and Partial Least Squares (PLS) analysis, are briefly described. This description leads to the origin of the research question stated in Section 1.2.
The crux of the research problem this study aims to address constitutes the last topic discussed in this chapter. The selection criteria chosen by the QRPMS methodology for employment in PCA, the Guttman-Kaiser criterion (K1), is discussed. Multiple literature sources are consulted for the criterion analysis, and multiple alternative selection criteria to K1 are investigated; a task which concludes the literature review of this study.
2.2
Physical Asset Management: A Brief
Discussion
Asset Management (AM) is a widely practised term in multiple industries. There are many adjectives to the term asset management, such as Strategy
Asset Management, Integrated Asset Management and Enterprise Asset Man-agement (IAM, 2014). Due to the synonymic use of AM, some ambiguous terminology joins it. Therefore, it is necessary to explain which understand-ing of AM this thesis will be built upon to avoid confusion between the other available terminologies.
The following section introduces the basic concept of AM with regard to the assets dealt with. Building on this concept, the specific understanding of AM which this thesis is based on, Physical Asset Management (PAM), is explained and defined. In conclusion, this section provides a discussion of PAM in sufficient depth to link PAM with the other topics introduced and investigated in this literature study.
2.2.1
Introducing Physical Asset Management
Arguably the most popular understanding of the term asset management
would be the management of either financial or real estate investment port-folios. But apart from the financial and real estate industries, the term asset management is also used in the corporate management and information
tech-nology industries, amongst others (Woodhouse, 2006; Mitchell et al., 2007).
AM has different definitions due to the various understandings of it; some of which are provided, with their respective supporting literature, by Mitchell
et al.(2007), Hastings (2009) and Schneideret al.(2006). Although these
defi-nitions share similarities, it is best to first define AM in a broad and unspecific manner. Tywoniak et al.(2008) provides such a definition:
“Asset Management is the process or cycle in which assets are “put through” in order to create a product or provide a service at optimum level.” - (Tywoniaket al., 2008)
AM generally refers to the actions taken by organisations to monitor and maintain their assets, ensuring that overall, value is created for the organisa-tion and not destroyed. The type of asset dealt with in each industry is at the core of the respective industry’s understanding of AM, and thus plays a critical role in their definition of AM. In the financial industries, the most common definitions of assets are fixed assets and current assets.
A fixed asset is defined as a physical item which retains value for a time period greater than one year (machinery and property), whereas current assets (inventory and cash) are assets that are to be turned into cash within a year (Hastings, 2009). It is more convenient, however, to define assets as either
intangible assets or tangible assets.
AM may be applied to intangible assets, such as data, cash and intellectual property, and tangible assets, such as machinery, buildings and inventory. In-clusive to other industry specific contexts, AM has been increasingly used to describe the comprehensive management of tangible, or rather, physical assets, over their entire life cycle. Physical Asset Management (PAM) is based on this understanding of AM, which is more accurately defined by PAS (2008) as:
“(the) systematic and coordinated activities and practices through which an organisation optimally and sustainably manages its assets and asset systems, their associated performance, risks and expen-ditures over their life cycles for the purpose of achieving its organ-isational strategic plan...” - (PAS, 2008)
where an organisational strategic plan is also defined by PAS (2008) as:
“(the) overall long-term plan for the organisation that is derived from, and embodies, its vision, mission, values, business policies, stakeholder requirements, objectives and management of its risks.”
- (PAS, 2008)
A decision was made to use the above definition of AM for this thesis, and from henceforth to consistently use the term PAM when referring to AM to mitigate confusion between all its possible adjectives. PAM is, as mentioned above, the management of physical assets. Its primary objective is to increase
the value of, and return from, physical assets over their life cycles (Mitchell
et al., 2007). More specifically, PAM focuses on the physical assets of an
or-ganisation that generates income within the different oror-ganisational silos. PAM, however, accomplishes more than just its primary objective. PAM also incorporates the organisation’s strategic plans and objectives into the acquisition, operation, management and decommissioning processes of physical assets in order to achieve the organisation’s said plans and objectives. IAM (2014) provides the following characteristics of good PAM:
• Multi-disciplinary: PAM creates or increases assetvalue by crossing
dis-ciplinary or departmental boundaries.
• Systematic: employs an effective management system for consistent and sustainable application.
• Systems-orientated: views assets in their respective system environment to realise value.
• Risk-based: decision-making includes risk and liability consideration. • Optimal: best compromise between conflicting objectives for the
short-and long-term.
• Sustainable: strive for the optimal asset value delivery over the complete asset life-cycle.
• Integrated: PAM requires to be linked up with other components to operate effectively.
The above shows PAM to be an important and integral part of an organ-isation; successful PAM is a pillar of organisational success, rather than just good maintenance (Mitchellet al., 2007). This is arguably the most innovative
contribution of a PAM framework to an organisation.
Some organisations still view PAM as identical to maintenance, not realis-ing the organisational benefits that it offers. PAM was not well defined in the past, as Hastings (2009) notes. This can be partially attributed to the lack of cross-functional integration between the disciplines encompassing PAM, and the difficulties involved in systems integration. Hastings (2009) states this “undefined era” of PAM may be one of the reasons why PAM was, and still is, equated to maintenance by some. Frolovet al. (2010) suggest this is changing;
the recognition of PAM and its importance is increasing rapidly world wide. With the growing acknowledgement of PAM internationally, a need from industry for a standard in PAM originated; a guideline to effectively construct
and employ a PAM framework that will incorporate all the necessary organi-sational facets to meet the aforementioned PAM objectives. From this need, the Publicly Available Specification 55 (PAS 55) and the ISO 55000 series of standards were born.
2.2.2
PAM Standards
The British Standards Institute (BSI) and Institute of Asset Management (IAM), with the help of other multiple assisting organisations, published an international standard for the improved management of physical assets in 2004; a standard specification for PAM, called the PAS 55. It originated from the industry’s request for an internationally accepted framework outlining good PAM practises. This standard is especially applicable to any organisation whose strategic plan’s success is dependent on the organisation’s physical as-sets.
Figure 2.2: The asset scope of PAS 55 Adapted from PAS (2008)
Within a few short years since its introduction to industry, PAS 55 was revised to mirror the growing international consensus for required good prac-tices in PAM. Even though the revision of PAS 55 only took place four years after its introduction, van den Honert et al. (2013) report that PAS 55 has
been successfully implemented by organisations during its entire period of em-ployment by industry. PAS 55 defines five asset classes, which if successfully incorporated into PAM according to the PAS 55 framework, would completely align an organisation’s PAM with its strategic plan (PAS, 2008). These five asset classes are human assets, information assets, financial assets, intangible
assets andphysical assets. The asset scope of PAS 55 is depicted in Figure 2.2.
Although PAS 55 and PAM are primarily focused on physical assets, PAS (2008) acknowledges that the management of physical assets are coupled to the other four asset classes depicted in Figure 2.2. PAS 55 considers these asset classes when they have a direct impact on the optimised management of the physical assets (PAS, 2008). It is important to note that even though PAS 55 does not directly address human factors such as motivation and leadership, they play a crucial role in successful and sustainable PAM. It is for this reason why human assets are considered in the PAS 55 framework.
In addition to the aforementioned, Woodhouse (2006) states that PAS 55 encourages change from within the organisation through implementing a bot-tom up approach. This is specifically the case with individual activities re-garding cost, risk and performance evaluation. According to Hastings (2009), PAS 55 can provide:
• Effective relationships between top management, asset management, as-set maintenance, and cross-functional communications.
• Improvements in asset management organisations. • Safety and regulatory benefits.
• Improvements in training and development.
PAS 55 provides a flexible, yet robust, PAM framework that encourages a continuous improvement attitude (Botha and Vlok, 2014). However, PAS 55 lacks details according to van den Honert et al. (2013); it provides guidelines
on what needs to be done, but does not address how it should be done. In January 2014, the International Organisation for Standardisation (ISO) produced the ISO 55000 series; a family of international standards for PAM. The ISO 55000 series bases its content on the primary concepts of PAS 55, and aims to make this PAM standard more applicable and user friendly than PAS 55 (van den Honert et al., 2013). Furthermore, ISO 55000 is aligned with
other major ISO management specifications, such as the ISO 14001 and ISO 9001 standards, improving the benefit of its employment.
The ISO 14001 standard deals with the multiple aspects of environmental management, and the alignment of this standard and ISO 55000 is crucial as an important overlap between these two standards; the decommissioning of physical assets in an environmentally friendly manner. In addition, the ISO 9001 standard addresses quality management through specifying the require-ments of a quality management system and, similarly with ISO 14001, there
exists overlapping components between ISO 9001 and ISO 55000.
Despite this newly developed PAM standard, van den Honertet al.(2013)
state it is not without flaws. The ISO 55000 series does indeed better describe how tasks are to be completed when compared to the PAS 55, but fails to provide detailed guidelines on what should be done as PAS 55 does (van den Honert et al., 2013). IAM (2014) also claims the ISO 55000 series does not
direct an organisation as to how well it needs to perform PAM.
However, organisations can find relief in the continued work being com-pleted to rectify and improve the ISO 55000 series. Within a couple of weeks of its publication, the ISO 55000 series was complimented with a specification called the ISO 55001 Auditor/Assessor Specification. This specification aims to help organisations identify individuals who are able to help the organisa-tion realise the value of PAM, and is an example of the continued improvement work being completed.
2.2.3
The Link Between PAM And PM
In light of the PAM standards listed in Section 2.2.2, the Institute of As-set Management (IAM) saw it fit to produce IAM (2014); a document that provides an overview of PAM, defining the scope of PAM and describing its fundamental concepts and philosophies. IAM (2014) proposes a conceptual model of PAM which, according to IAM, is created to represent the global scope of PAM and its high-level groups of activities. This model is depicted in Figure 2.3, and as can be seen, a diverse collection of elements constitute the working parts of PAM.
Amongst the high-level activities depicted in Figure 2.3 is Asset Manage-ment Decision-Making (AMDM). This activity involves the making of deci-sions regarding issues such as capital investment, operations and maintenance, optimised maintenance and life cycle value realisation (IAM, 2014). It is a pro-cess of finding the optimum compromise or balance between competing factors such as capital expenditure versus asset operating costs, asset utilisation ver-sus asset care, and so forth (IAM, 2014).
IAM (2014) notes that, when making the aforementioned decisions, it is necessary to consider the multitude of PAM elements and drivers affected. The full range of an asset’s impact throughout its life-cycle should be considered in the formulation of the organisation’s asset management strategy; a strat-egy through which asset performance is translated to stakeholder satisfaction. This process is depicted in Figure 2.4.
Figure 2.3: The IAM conceptual model of PAM Adapted from IAM (2014)
This suggests then that the activity of AMDM is more than just finding the optimum compromise between factors inherent with an asset’s life-cycle. It plays a critical role in the success of an organisation as a result of good PAM (IAM, 2014). AMDM is at the heart of a system used for PAM direction and control; a system which IAM (2014) refers to as an Asset Management System (AMS) and PAS (2008) defines as:
“An Asset Management System is an organisation’s physical as-set management policy, physical asas-set management strategy, physi-cal asset management objectives, physiphysi-cal asset management plan(s) and the activities, processes and organisational structures neces-sary for their development, implementation and continual improve-ment.” - (PAS, 2008)
The improvement of AMDM will thus possibly have a positive affect on the overall success of an AMS, and indeed the success of an organisation. As can be seen in Figure 2.3, AMDM employs deliverables from the Asset Infor-mation element; an element which IAM (2014) states is key to making good
PAM decisions. This then suggests that the improvement of Asset Information will improve the decision-making capability of an organisation with regard to PAM, leading the literature review to investigate the realm of Performance Measurement (PM) and Performance Management (PMa).
Figure 2.4: The asset hierarchy within an integrated management system Adapted from IAM (2014)
2.3
Performance Measurement and
Management
“Measurement is complex, frustrating, difficult, challenging, im-portant, abused and misused.” - (Sink, 1991)
The above quote adequately describes the attitude measurement is often
ap-proached with. However complex and challenging it is, measurement is still a critical part of many industries today (Cai et al., 2009). The perception of
what measurement is, differs from individual to individual, and from organi-sation to organiorgani-sation. This increases the difficulty of defining measurement in universal terms.
In addition, people’s and organisations’ perceptions and understandings of
performance varies arguably more than that of measurement. According to
Otley (1999), performance itself is an equivocal term, incapable of being
de-fined simply. Thus, this literature review aims to answer the following question: how do we define measurement and performance in this study to ultimately de-scribe Performance Measurement (PM) and Performance Management (PMa)? Neelyet al.(1995) describe PM as the process of quantifying the
effective-ness and efficiency of an action, and that a performance measure is the metric used to complete the quantification. However, on a grander scale, Amaratunga and Baldry (2002) write that measurement allows an organisation to assess how
well it progresses in achieving its organisational objectives and milestones. Measurement helps identify areas of strength and weakness, and aids in improving organisational performance. Measurement is not a means to an end in itself, but a critical tool for effective and efficient management, according to Amaratunga and Baldry (2002). For an organisation to effectively use its performance measurement deliverables, it must make the conversion from PM to PMa (Amaratunga and Baldry, 2002).
This section provides a short historic overview of the evolution of PM within organisations. This is followed by a discussion on measurement and performance that will answer the aforementioned question. In conclusion, a brief description of current PM and PMa literature is presented, leading to the introduction of the systems belonging to each.
2.3.1
The Origin Of Performance Measurement
PM originated at the same time performance started to play an important role in industry. Jooste and Page (2004) observed that performance entered the playing field during the 1800’s because of the industrial revolution. There were a few different phases of manufacturing ideologies that led to the development of PM and performance measures as they are known today. These phases, Rolstadås (1995) writes, followed the industrial revolution era that occurred between the 1700’s and 1800’s, and are depicted in Figure 2.5.
The first phase was the English System of Manufacture, and occurred from roughly 1800 to 1850. It was concerned with the perfect manufacture of a single part, one at a time, indicating the quality of craftsmanship (Rolstadås, 1995). The second phase, the American System of Manufacture, saw a com-plete change in manufacturing philosophy. From 1850 till 1900, perfect man-ufacture was replaced with the robust manman-ufacture. The focus was placed on manufacturing differing components in a robust manner, without any com-promise the end product’s capability to operate properly. These two phases comprised the era of craftsmanship (Jooste and Page, 2004).
The Industrial Productivity era followed, and its introduction was as a re-sult of work completed by individuals such as Frederick W. Taylor (Jooste and Page, 2004). Maier (1970) writes that Taylor popularised a new perspective on manufacturing, called Taylorism or the Taylor System. This system was built on apparent scientific studies of employee efficiency and reward systems. Jooste and Page (2004) suggest this was the turning point between the era of craftsmanship and the era of industrial productivity. Machine utilisation and employee efficiency became forever linked to industrial productivity henceforth
Figure 2.5: The development towards total Performance Measurement (PM): Part 1
Adapted from Jooste and Page (2004) (Jooste and Page, 2004).
The industrial revolution was an era that saw massive investments being made into factory and machine installations. The performance of these in-vestments had to be evaluated to justify their financial investment, thus the large scale adoption of performance measures took place. Due to the well-implemented accounting systems available at that time, it was a logical place to look for means of measuring performance in financial terms for evaluating purposes. It also provided a rudimentary means of managing performance based on the influence it had on the financial bottom-line. Rolstadås (1995) provides additional information regarding the early methods of productivity. Section 2.4 provides more information on performance measures.
Figure 2.6: The development towards total Performance Measurement (PM): Part 2
Adapted from Jooste and Page (2004)
Figure 2.6 depicts the progression from productivity focused industry to that of complete performance focus; the era of PM. The 20th century saw the world being plunged into two conflicts of unimaginable grandeur. Many coun-tries involved in the two World Wars suffered heavy damages to their industrial capabilities and took many years to rebuild their industrial capacities. Skilled