HAL Id: pasteur-02083187
https://hal-pasteur.archives-ouvertes.fr/pasteur-02083187
Submitted on 28 Mar 2019
HAL
is a multi-disciplinary open access
archive for the deposit and dissemination of
sci-entific research documents, whether they are
pub-lished or not. The documents may come from
teaching and research institutions in France or
abroad, or from public or private research centers.
L’archive ouverte pluridisciplinaire
HAL
, est
destinée au dépôt et à la diffusion de documents
scientifiques de niveau recherche, publiés ou non,
émanant des établissements d’enseignement et de
recherche français ou étrangers, des laboratoires
publics ou privés.
Distributed under a Creative Commons
Attribution| 4.0 International License
mouse embryonic stem cells
Victor Heurtier, Nick Owens, Inma González, Florian Mueller, Caroline
Proux, Damien Mornico, Philippe Clerc, Agnès Dubois, Pablo Navarro Gil
To cite this version:
Victor Heurtier, Nick Owens, Inma González, Florian Mueller, Caroline Proux, et al.. The molecular
logic of Nanog-induced self-renewal in mouse embryonic stem cells. Nature Communications, Nature
Publishing Group, 2019, 10 (1), pp.1109. �10.1038/s41467-019-09041-z�. �pasteur-02083187�
The molecular logic of Nanog-induced self-renewal
in mouse embryonic stem cells
Victor Heurtier
1,2
, Nick Owens
1
, Inma Gonzalez
1
, Florian Mueller
3
, Caroline Proux
4
, Damien Mornico
5
,
Philippe Clerc
1
, Agnes Dubois
1
& Pablo Navarro
1
Transcription factor networks, together with histone modifications and signalling pathways,
underlie the establishment and maintenance of gene regulatory architectures associated with
the molecular identity of each cell type. However, how master transcription factors
indivi-dually impact the epigenomic landscape and orchestrate the behaviour of regulatory
net-works under different environmental constraints is only partially understood. Here, we show
that the transcription factor Nanog deploys multiple distinct mechanisms to enhance
embryonic stem cell self-renewal. In the presence of LIF, which fosters self-renewal, Nanog
rewires the pluripotency network by promoting chromatin accessibility and binding of other
pluripotency factors to thousands of enhancers. In the absence of LIF, Nanog blocks
differ-entiation by sustaining H3K27me3, a repressive histone mark, at developmental regulators.
Among those, we show that the repression of
Otx2
plays a preponderant role. Our results
underscore the versatility of master transcription factors, such as Nanog, to globally in
fl
uence
gene regulation during developmental processes.
https://doi.org/10.1038/s41467-019-09041-z
OPEN
1Epigenetics of Stem Cells, Department of Developmental and Stem Cell Biology, Equipe Labellisée LIGUE Contre le Cancer, Institut Pasteur, CNRS
UMR3738, 25 rue du Docteur Roux, 75015 Paris, France.2Sorbonne Université Collège Doctoral, F-75005 Paris, France.3Imaging and Modelling,
Department of Cell Biology and Infections, Institut Pasteur, CNRS UMR 3691, 25 rue du docteur Roux, Paris 75015, France.4Transcriptome and EpiGenome,
BioMics, Center for Innovation and Technological Research, Institut Pasteur, 28 rue du docteur Roux, 75015 Paris, France.5Bioinformatics and Biostatistics
Hub–C3BI, Institut Pasteur, CNRS USR 3756, 28 rue du docteur Roux, Paris 75015, France. These authors contributed equally: Victor Heurtier, Nick Owens.
Correspondence and requests for materials should be addressed to P.N. (email:pnavarro@pasteur.fr)
123456789
G
ene regulatory networks driven by master transcription
factors (TFs) play pivotal roles over a large spectrum of
biological processes, from adaptive cell responses
1to cell
fate speci
fi
cation during development
2. The key properties of TF
networks, shared among cell types, developmental contexts and
organisms
3, are exempli
fi
ed by the pluripotency network, which
plays a dominant role during early mammalian embryogenesis
4.
The robustness of this network allows to capture the ex vivo of
transient biological identity of the pluripotent epiblast through
the derivation of self-renewing Embryonic Stem (ES) cells
5, which
have enabled identi
fi
cation of key TFs (e.g., Oct4, Sox2, Nanog
and Esrrb). The study of processes driving the balance between ES
cell self-renewal and differentiation has provided us with a
canonical picture of how TF networks operate, establishing
self-sustaining regulatory loops and acting together through multiple
promoters and enhancers
6–9. For instance, Oct4, without which
pluripotent cells cannot be maintained
10, acts with the TF Sox2 to
recognise and bind chimeric motifs
11found at a large number of
regulatory elements driving ES cell-speci
fi
c transcription. Oct4
and Sox2 also tend to bind with other TFs, including Nanog and
Esrrb, at multiple enhancers across the genome, to
combinato-rially coregulate a large number of targets. This simultaneous and
concerted action over hundreds of common targets ensures
extensive redundancy, and, therefore, robust genome-wide
responses. How these TFs synergise at or compete for common
regulatory elements, and how by these means they individually
contribute to the network
’
s activity, is however not well
under-stood. Moreover, several TFs of the pluripotency network are
directly connected to cell signalling, enabling ES cells to establish
appropriate responses that are instructed extrinsically. A
promi-nent example is provided by the LIF cytokine, which promotes
self-renewal by activating several pluripotency TFs such as
Esrrb
12,13. Hence, a key function of the pluripotency network is to
integrate signalling cues to appropriately respond to changes in
the environment, conferring the responsiveness of ES cells and
their capacity to readily differentiate. In this regard, it is
note-worthy that
Nanog
was
fi
rst identi
fi
ed as a factor capable of
bypassing the requirements for LIF: in the presence of ectopic
Nanog expression, ES cell self-renewal is strongly enhanced and
completely independent of LIF
14. In the current model, Nanog
achieves LIF-independent
self-renewal by activating
LIF-responsive genes, in particular
Esrrb
. Hence, the Nanog-Esrrb
axis and its intersection with LIF signalling represents a major
mechanism by which intrinsic and extrinsic cues
fi
ne-tune
self-renewal and avoid differentiation
15. Yet, the precise mechanisms
by which Nanog, and more generally the pluripotency network,
controls differentiation genes are not fully understood. It is
known, however, that differentiation genes adopt a particular
chromatin state known as
“
bivalent
”
16,17: while their promoters
are enriched for H3K4me3, a mark of gene activity, they are
simultaneously embedded within larger domains of H3K27me3, a
repressive mark. During differentiation, this state is resolved in
either H3K27 or K4me3 in a lineage-speci
fi
c manner
18. In
agreement, Polycomb Group proteins triggering H3K27me3
ensure appropriate cell fate changes
19–21. This underscores the
importance of H3K27me3 as cells dismantle the pluripotency
network, inhibit self-renewal and exit from pluripotency.
Whe-ther bivalent chromatin marks are governed by pluripotency TFs
remains to be thoroughly addressed.
In this study, we explore the function of Nanog in mouse ES
cells using inducible approaches of gain-of-function and
loss-of-function. We show that Nanog drives the recruitment of Oct4,
Sox2 and Esrrb at thousands of regulatory regions, from where it
mainly activates transcription. At these sites, Nanog also recruits
Brg1 and promotes chromatin accessibility. On the contrary, to
repress transcription Nanog does not recruit these TFs; rather, it
frequently inhibits Oct4 or Sox2 binding. Nanog also binds at
other enhancers where it acts redundantly with other TFs.
However, in the absence of LIF the action of Nanog over these
regulatory elements becomes dominant, particularly to promote
transcription. This results in Nanog having an expanded action in
the absence of LIF. Yet, its expanded repressive activity is not
associated with ES cell enhancers. Rather, Nanog is required to
maintain H3K27me3 at differentiation-associated genes. This is
the case of the TF Otx2, whose downregulation by Nanog leads to
LIF-independent self-renewal even when Esrrb is not expressed.
Hence, Nanog deploys distinct molecular means to promote
self-renewal and counteract differentiation: when the network is fully
operative (in the presence of LIF), Nanog rewires its activity;
when it is partially dismantled (in the absence of LIF), Nanog
represses differentiation genes via H3K27me3. Overall, we reveal
different modes and the varied logic employed by Nanog to
orchestrate the three main features associated with self-renewal:
the inter-dependencies between pluripotency TFs, LIF signalling,
and bivalent chromatin domains.
Results
Inducible CRISPR-ON ES cells to activate
Nanog
transcription
.
The SunTag system was developed as a versatile tool to either
visualise speci
fi
c molecules in live cells or to perform epigenome
editing of endogenous loci when coupled to an enzymatically
inert dCas9
22. It involves the expression of diffusible antibodies
(scFv) that interact with high af
fi
nity with 10 copies of the GCN4
epitope linked to an enzymatically inert Cas9 (dCas9). These scFv
antibodies are fused to GFP and the potent activator VP64, such
that upon expression of a gRNA targeting a given genomic region,
several VP64 molecules are brought about with high ef
fi
ciency
and speci
fi
city. To provide increased
fl
exibility to the system, and
facilitate the generation of cell lines carrying an inducible
CRISPR-ON system, we engineered a single vector expressing the
two SunTag moieties under the control of a Tetracycline
Responsive Element. Moreover, dCas9 is linked to BFP and HpH
through P2A and IRES sequences, respectively (Supplementary
Fig. 1A). Hence, upon induction of the system with Doxycycline
(Dox), the cells are expected to become green, blue and
Hygro-mycin-resistant, providing a high tractability. This vector was
introduced in ES cells together with the rtTA activator: two clones
(C1 and C2) showing a high percentage of green/blue cells upon
Dox treatment and a strong induction of dCas9 and VP64
(Supplementary Fig. 1B, C), were selected. They both self-renew
normally and differentiate in the absence of LIF; their karyotypes
are also normal (Supplementary Fig. 1D). Next, we introduced to
C1 and C2 a vector expressing a gRNA targeting the minimal
Nanog
promoter and validated binding of dCas9/VP64 with good
speci
fi
city and inducibility (Supplementary Fig. 1E). This was
accompanied by increased histone H3 acetylation around the
promoter (Fig.
1
a, b), as expected given the ability of VP64 to
recruit histone acetyl-transferases
23, in the context of presumably
unaltered nucleosomal organisation as evaluated by total H3
analysis (Fig.
1
b). Upon Dox induction, we observed ef
fi
cient
Nanog
induction from 12 h of treatment onwards
(Supplemen-tary Fig. 1F, Fig.
1
c), leading to an increase of Nanog protein
levels (Supplementary Fig. 1C, G). We also found that the
increase of
Nanog
expression was due to both stronger and more
frequent transcriptional bursts (Fig.
1
d and Supplementary
Fig. 1H, I). Finally, we analysed the effects of Dox administration
at the proximal
−
5 kb enhancer of
Nanog
: upon induction, we
found both sense and anti-sense enhancer transcription to be
increased (Fig.
1
e). Whether this is due to the proximity of these
two regulatory elements or to a functional in
fl
uence of the
we have generated Dox-inducible SunTag ES cells to activate
endogenous promoters and dissect the subsequent consequences.
De
fi
nition of Nanog responsive genes
. Upon Dox induction of
Nanog
in our SunTag cells we observed a 2-fold increase of
Nanog binding to a panel of regulatory elements displaying a
wide range of enrichment levels (Fig.
2
a). This suggests that Dox
induction may lead to functional consequences. However, the two
main targets of Nanog that have been previously identi
fi
ed,
Esrrb
and
Klf4
15, showed minimal variation in expression levels, if any,
over the course of 6 days of endogenous
Nanog
induction
(Fig.
2
b). Prompted by this unexpected observation, we
per-formed RNA-seq to comprehensively study the global response to
Dox treatment. We found a small number (163) of transcripts
that were either upregulated or downregulated (Fig.
2
c top);
neither
Klf4
nor
Esrrb
were among the induced genes (Source
Data, sheet 1; and Supplementary Fig. 2A, B). Nevertheless, the
vast majority of genes that have been previously identi
fi
ed as
responding to Nanog levels
15,24, do exhibit the appropriate
expression changes in our SunTag cells (Supplementary Fig. 2C).
To further validate our list of Nanog-responsive genes, we
0 4 2 6 8 10 0 4 2 6 8 –5 –2.5 TSS 2.5 Genomic distance to TSS (kb) %IP normalised to actin promoter Histone H3 Histone H3 pan-acetyl –Dox +Dox gRNA Nanog –5 kb enhancer mRNA qPCR pre-mRNA qPCR smFISH probe eRNA qPCR ChIP amplicons
a
1c
d6 d3 d2 d1 d1 d2 d3 d6 Days of culture –Dox +DoxRNA levels normalised to
Tbp Nanog mRNA Nanog pre-mRNA 5 15 25 0.5 1 1.5 2 2.5
d
–Doxe
–Dox +DoxRNA levels normalised to
Tbp eRNA1 0 0.01 0.002 0 0.03 0.06 0.09 0.12 0.003 No oligo – strand + strand eRNA2 +Dox 20 µm 2
b
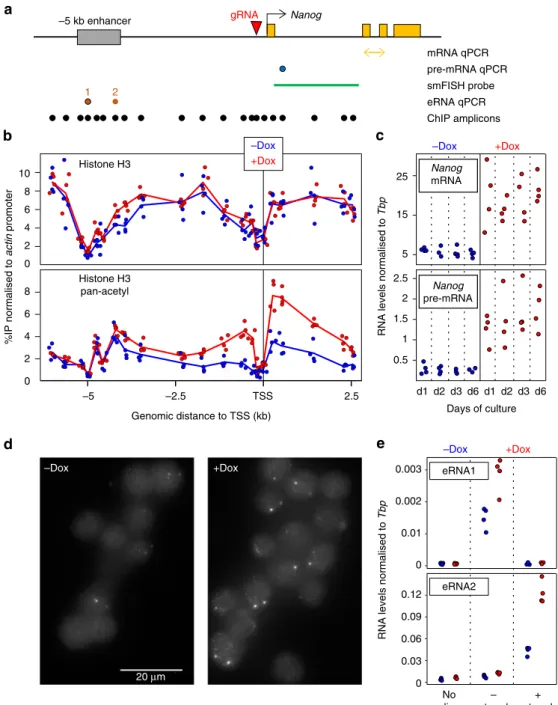
Fig. 1CRISPR-ON ES cells for Dox-inducible activation of endogenous Nanog.aSchematic representation of theNanoglocus (black arrow: promoter; yellow
boxes: exons; grey box: Nanog enhancer; red arrowhead: gRNA). Below, the position of the amplicons and probe used for the assays indicated on the right is shown.bChIP across the Nanog locus monitoring total histone H3 (top) and pan-acetyl H3 (bottom) in the absence (blue) and after 72 h of Dox treatment (red). Each dot represents normalised %IP measured in individual replicates and lines the averages.cNormalised levels ofNanogmRNA (top) and pre-mRNA (bottom) after the indicated number of days in the absence (blue) and the presence (red) of Dox. Each dot represents measurements in individual replicates as inb.dRepresentative smFISH image using intronicNanogprobes before and after 72 h of Dox induction.eNormalised levels of eRNA production from the−5 kb enhancer presented as inc. In all panels,n=4; 2 with each independent SunTag clone
performed a complementary analysis using previously established
Nanog
-null cells (44iN) expressing a Dox-inducible
Nanog
transgene
15. The cells were grown in the continuous presence of
Dox, which was then removed for 24 h leading to a nearly
complete loss of
Nanog
expression (Fig.
2
c bottom). The number
of responsive genes observed with this strategy was also small
(141; Fig.
2
c and Source Data, sheet 1); they intersected with
excellent statistical signi
fi
cance with the genes identi
fi
ed in the
SunTag cells (Fisher
p
< 1e-53). Moreover, we found the
expres-sion of genes signi
fi
cantly regulated in only one system, to
nevertheless display highly coherent expression changes in the
other system (Fig.
2
d). Hence, to improve statistical power and
expand on Nanog targets we combined the SunTag and 44iN
datasets to test for those genes with coherent Nanog response
across both systems (Fig.
2
e and Supplementary Fig. 2D).
Com-bining with those genes already identi
fi
ed, this resulted in 457
genes, which generally display extremes of expression differences
between Dox-treated SunTag (high
Nanog
) and untreated 44iN
cells (low/absent
Nanog
; Fig.
2
e and Supplementary Fig. 2D); they
globally behave in a concordant way when long-term
Nanog
-null
cells are compared to wild-type cells (Supplementary Fig. 2D), or
when their expression is analysed in published data sets
(Sup-plementary Fig. 2E). Genes activated by Nanog are enriched in
regulators of stem cell maintenance (FDR < 2.99e
−
16), while
repressed genes are enriched in differentiation processes such as
nervous system development (FDR < 6.89e
−
10).
Nanog rewires the pluripotency network to control its targets
.
Having established a list of Nanog-responsive genes, we aimed at
exploring the mechanisms by which Nanog in
fl
uences their
expression, focusing on a potential role of Nanog in modulating
binding of other regulators such as pluripotency TFs (Oct4, Sox2
and Esrrb) and the chromatin remodeller Brg1 that is functionally
associated with self-renewal
25,26. To do this, we
fi
rst established a
list of 27,782 regulatory elements bound by Nanog using six data
sets derived from four independent published studies (Source
Data, sheet 2) and used 44iN cells to address how Nanog impacts
TF binding and chromatin accessibility at these sites. We noticed
that at some Nanog binding regions, Esrrb, Oct4, Sox2, and Brg1,
display a strong reduction of binding and decreased chromatin
accessibility, after 24 h of Dox withdrawal (Fig.
3
a). This
obser-vation can be generalised to a large proportion of regions and is
particularly prominent in the case of Esrrb (Fig.
3
b). We then
divided Nanog binding regions in two major groups (Fig.
3
b and
Supplementary Fig. 3), based on the presence of other TFs
(regions of co-binding) or not (solo regions). In
Nanog-solo regions, which display lower levels of Nanog binding, the
chromatin is less accessible irrespective of Nanog (Fig.
3
b and
Supplementary Fig. 3), indicating that additional factors may be
recruited. Strikingly, when we computed the number of
Nanog-responsive genes as a function of the distance to Nanog binding
regions, we observed that the both activated and downregulated
genes are particularly enriched in the vicinity of co-binding
regions and not of Nanog-solos (Fig.
3
c). Moreover, while
acti-vated genes tend to be located distally (within 10 to 100 kb),
downregulated genes also show a signi
fi
cant enrichment over
closer distances (<10 kb). To further explore the relationships
between Nanog and other TFs, we used k-means clustering to
identify 8 subgroups of Nanog binding sites (Fig.
3
d and
c
a
b
e
d
Esrrb *Nanog Nanog Ctgf Rex1 Otx2 Xist Foxd3 Tbx3 d6 d3 d2 d1 d1 d2 d3 d6 Days of culture Esrrb Klf4 Log2 %IP 0 –2 –4 2 4 –Dox +Dox –Dox +Dox Nanog ChIP RNA levels normalised to Tbp 0 2 4 6 0 2 4 6 RNA-seq SunTag Downregulated (FDR<0.05) Upregulated (FDR<0.05) 0 3 6 –3 –6 Log2 FC +Dox /–Dox Downregulated (FDR<0.05) Upregulated (FDR<0.05) RNA-seq 44iN 0 3 6 –3 –6 Log2 FC +Dox /–Dox 3 2 4 5Log10 mean +/– Dox SunTag Responsive genes 44iN Responsive genes Log2 FC +Dox /–Dox 2.5 0 5 7.5 Log2 FC +Dox /–Dox
SunTag 44iN SunTag 44iN
Upregulated 285 genes Downregulated 172 genes –1.5 2 Z score + – WT SunTag 44iN + – 44iN (LT) –2.5 2.5 0 5 7.5 –2.5 Nanog Nanog 1
Fig. 2Identification of Nanog-responsive genes.aChIP analysis of Nanog binding across a set of targets, as indicated on theX-axis. Each dot represents
measurements in individual replicates (n=4; 2 for each independent SunTag clone).bNormalised levels ofEsrrb(top) andKlf4(bottom) mRNA after the indicated number of days in the absence/presence of Dox. Each dot represents measurements in individual replicates as ina.cMA Plots displaying log2 fold changes as indicated on theY-axis as a function of average expression. RNA-seq was performed in both SunTag (72 h Dox induction) and 44iN cells (24 h Dox withdrawal). Red and blue represent differentially expressed genes (FDR < 0.05).dBoxplot of the log2 fold change for the genes identified in
cas upregulated (red) or downregulated (blue) by Nanog, in either SunTag (left) or 44iN cells (right), measured in both inducible systems as indicated on theX-axis. For each boxplot, the central line represents the median, the limits the lower/upper quartiles, and the whiskers the most extreme data-point within 1.5 times the interquartile range in excess of the lower and upper quartile.eHeat map representing gene expression z-scores of all transcripts identified by combining SunTag (FDR < 0.05), 44iN (FDR < 0.05) and SunTag/44iN likelihood ratio test (FDR < 0.05) datasets
Supplementary Fig. 3). In the
fi
rst 4 clusters, the depletion of
Nanog leads to an acute loss of TF binding; collectively these
regions are strongly associated with the activation of Nanog
targets (Fig.
3
c). In contrast, clusters 5
–
8 are signi
fi
cantly
asso-ciated with genes repressed by Nanog and the effects of its
depletion are more nuanced (Fig.
3
c, d). More speci
fi
cally,
clus-ters 1 to 3 display a nearly total loss of TF binding in the absence
of Nanog, along with a marked decrease in chromatin
accessi-bility (Fig.
3
d and Supplementary Fig. 3). These 3 clusters, in
particular clusters 1 and 2, are associated with genes activated by
Nanog (Fig.
3
c). At cluster 4, however, chromatin accessibility
shows minimal variations and, while very strong Oct4 binding is
nearly completely lost upon Nanog depletion, Sox2 is not
affec-ted. Since Brg1 is particularly low across this cluster, Sox2 may
recruit other chromatin remodellers to render the chromatin
accessible at these regions, in a Nanog-independent manner.
Accordingly, the correlation with Nanog-responsive genes of
cluster 4 is weaker (Fig.
3
c). Overall, at more than 6000 regions
(clusters 1 to 3), Nanog plays a chief role in establishing
func-tional and accessible regulatory regions capable of recruiting
different combinations of TFs to activate its targets. Conversely,
at clusters 5 to 8, the effects of the loss of Nanog are rather small
both at the level of TF binding and of chromatin accessibility
(Fig.
3
d and Supplementary Fig. 3). This suggests that
Nanog-mediated repression uses radically different mechanisms, which
are not based on the increased recruitment of Esrrb, Oct4 and
Sox2. Rather, clusters 7 and 8 display increased Oct4 and Sox2
binding in the absence of Nanog, respectively, suggesting that
Nanog downregulates the genes functionally linked to these two
clusters by blocking Oct4 or Sox2 recruitment (Fig.
3
d and
Supplementary Fig. 3). At other enhancers associated with genes
repressed by Nanog, showing no alteration of Oct4 and Sox2
occupancy (clusters 5 and 6), Nanog may block the otherwise
activatory function of other TFs. In conclusion, Nanog wires the
pluripotency network by fostering TF recruitment and chromatin
accessibility at distal regulatory elements to act as an activator,
and uses different mechanisms, including the impairment of
Oct4/Sox2 recruitment, both at promoter
–
proximal and distal
regulatory elements of the genes it represses.
Nanog-SunTag cells display LIF-independent self-renewal
. The
strong in
fl
uence of Nanog on the ef
fi
ciency of self-renewal has
been proposed to be largely mediated by Esrrb
15. Therefore, we
were not expecting our SunTag cells endogenously activating
Nanog
to exhibit increased self-renewal capacity, given that
Esrrb
and other genes involved in self-renewal, such as
Klf4
12, are not
strongly induced (Fig.
2
b). To test this, we initially plated our
– 1 10 100 1000 1 10 100 1000 Peak distance (kb) 0 10 20 30 0 10 20 30 0 10 20 30 0 10 20 30 Fisher p -value (–log10)
Nanog responsive genes
Up Down Nanog Oct4 Esrrb Sox2 ATAC
+ DOX – DOX + DOX – DOX
Esrrb Oct4 Brg1
Nanog + – + – + – + – +
Co-binding
Solos
All Nanog peaks
Co-binding 1 2 3 4 5 6 7 8 Co-binding Solos # 1–4 # 5–8 # 1 # 2 # 3 # 4 # 5 # 6 # 7 # 8 0 0 7 7 0 7 0 13 0 13 0 17 0 17 0 3 0 3 0 2 0 2 44iN
d
Brg1 Sox2 ATACa
b
c
Fig. 3Nanog rewires the pluripotency network.aRepresentative enrichment profiles (reads per million) of the indicated TFs (ChIP-seq) and chromatin
accessibility (ATAC-seq) across an 8 kb-long genomic region (mm9: chr10:33,952,000–33,960,000). In black, average signal from 6 publicly available Nanog datasets. In blue and red, average signal of 44iN cells cultured in the presence or absence of Dox, respectively. The peak highlighted by a green box shows reduced signal in the absence of Dox; note an upstream peak displays increased Sox2 binding.bHeat map of average enrichment levels in each indicated condition (+/−Dox) across 0.5 kb centred on the Nanog peak summit at all Nanog sites (27,782), ranked from high to low Nanog. The regions were split in two groups depending on the presence (co-binding) or absence (Solos) of other TFs.cPlots displaying the -log10 Fisherp-value (Y-axis) of the enrichment of genes upregulated (left) or downregulated (right), at a given distance (X-axis) from specific groups of Nanog binding sites identified inb, d, as indicated in the colour-coded insets.dHeat map corresponding to 8 clusters identified on the basis of TF co-binding and the effects of Dox withdrawal, presented as inbwithout ranking for Nanog binding levels
SunTag lines at clonal density together with the parental controls
lacking the
Nanog
gRNA, and cultured them in the presence or
absence of Dox for 6 days (Fig.
4
a). In the presence of LIF, we
could not observe any major change in the ef
fi
ciency of
self-renewal. In contrast, in the absence of LIF, when virtually all the
colonies display complete or partial signs of differentiation in all
controls, cells with enhanced endogenous
Nanog
expression
generated a substantial proportion of undifferentiated colonies
(Fig.
4
a, b). To further validate that these cells are bona-
fi
de ES
cells, we harvested them at the end of the clonal assay and
per-formed two complementary assays. First, we re-plated them in 2i
medium lacking serum
27, where only truly undifferentiated cells
proliferate: both clones gave rise to typical spherical and
undif-ferentiated colonies (Fig.
4
c). Second, we re-plated them at clonal
1 10 100 1000 Peak distance (kb) 0 15 30 45 Fisher p -value (–log10) 0 15 30 450 15 30 45 0 15 30 45 # 5–8 # 1–4 1 0 –1 Z score
Down & rescued
Down & not rescued Up & rescued Up & not rescued
Down & rescued
Down & not rescued Up & rescued Up & not rescued LIF DOX 0 60 80 100 20 40 % of colonies Undiff Mixt Diff LIF + + – – + + – – + + + – + – – – + + – + – + – + + – – – – + + + gNanog DOX LIF – – + + – + – + DOX Nanog Esrrb Klf4 H3 c1 c2 –LIF –DOX –LIF +DOX
Stem cell maintenance 3.6e–6 Examples: Prdm14, Klf4, Tbx3, Esrrrb, Sox2, Dppa2
Oxidation-reduction 7.5e–19 Examples: Acad, Ndufa, Ndufb families
Multicellular development 1.6e–6 Nervous system development 2.6e–5 Examples: Otx2, Id1, Sox11, Fzd receptor family Multicellular development 1.9e–6 Nervous system development 1.0e–9 Examples: Bdnf, Tbx4, Wnt ligands, Sema family
684 528 2790 2648 37 kDa 37 kDa 50 kDa 15 kDa
a
b
c
d
e
f
g
Fig. 4Endogenous induction ofNanogmediates LIF-independent self-renewal by non-canonical mechanisms.aHistogram representing the percentage of
undifferentiated (red), mixt (blue) and differentiated (white) colonies (Y-axis) counted after 6 days of clonal growth in the indicated conditions (X-axis). Error bars represent std. dev. (n=4).bRepresentative image of Alkaline Phosphatase stained colonies after 6 days of clonal growth in the presence/ absence of Dox.cRepresentative image of the two SunTag clones after culturing them in 2i for 3 days following a 6-day clonal assay in the absence of LIF and the presence of Dox. The scale bar represents 50µm.dRepresentative Western-Blot of Nanog, Esrrb and Klf4 after 3 days of culture in the indicated conditions.eHeat map representing gene expression z-scores across 4 groups of transcripts, as indicated in the left. UP/DOWN refers to their expression changes after 3 days of LIF deprivation (FDR < 0.05); rescued versus not rescued indicates whether Nanog significantly alleviates their misregulation (FDR < 0.05).fPlots displaying the -log10 Fisherp-value (Y-axis) of the enrichment of genes belonging to the groups identified ineat a given distance (X-axis) from Nanog binding clusters 1 to 4 (red) and 5 to 8 (blue), as established in Fig.3.gRepresentative Gene Ontology terms enriched in each group of genes. The FDR is indicated together with selected examples
density in the absence of LIF and the presence/absence of Dox:
only in the presence of Dox we did recover undifferentiated
colonies; in the absence, all the cells differentiated (see below).
This demonstrates that the exposure to Dox does not alter the
differentiation capacity of our cell lines upon its withdrawal. We
conclude, therefore, that Dox-induction of
Nanog
confers to our
SunTag lines and the ability to self-renew in the absence of LIF, a
de
fi
nitive proof of the ef
fi
ciency of our CRISPR-ON strategy to
study Nanog function. Strikingly, LIF-independent self-renewal
was attained in the absence of any apparent induction of
Klf4
and
Esrrb
mRNAs (Supplementary Fig. 4A) or proteins (Fig.
4
d).
Therefore, to explore both the magnitude of the differentiation
blockade at the molecular level, and to identify potential Klf4/
Esrrb-independent mechanisms underlying Nanog-mediated
self-renewal, we performed transcriptomic analyses. In control cells
that were not stimulated by Dox, a large number of genes
responded to LIF withdrawal (>5000) and exhibited important
quantitative differences (Supplementary Fig. 4B, C, D). In the
presence of Dox, the magnitude of the expression changes of
these LIF-responsive genes was globally diminished
(Supple-mentary Fig. 4B), even though the vast majority of pluripotency
genes remained strongly downregulated (Supplementary Fig. 4C,
D). In fact, not all genes that respond to LIF withdrawal were
rescued by
Nanog
induction to the same extent, with only around
20% being ef
fi
ciently rescued (Fig.
4
e, Supplementary Fig. 4E and
Source Data, sheet 1). This argues against the idea that the
pre-sence of substantial numbers of undifferentiated cells may explain
all the expression changes measured upon Dox induction in the
absence of LIF.
Increased regulatory potential of Nanog in the absence of LIF
.
In the absence of LIF, the effects of endogenous
Nanog
induction
are largely maximised: if in the presence of LIF we identi
fi
ed 285
upregulated and 172 downregulated genes, in its absence these
numbers raised to 856 and 589, respectively (Source Data, sheet
1). It appears, therefore, that LIF signalling attenuates the relative
impact of Nanog on the ES cell transcriptome. To explore this
further, we established the associations between the clusters of
Nanog binding regions we have identi
fi
ed (Fig.
3
), with four
groups of genes: genes downregulated or upregulated upon LIF
withdrawal and, among these two categories, those that Nanog
can or cannot partially rescue by activating or repressing them,
respectively (Fig.
4
e). We observe that only one group,
con-stituted of genes repressed by Nanog in the absence of LIF, is not
enriched in any Nanog binding region that we have studied
(Fig.
4
f and Supplementary Fig. 4F). In contrast, the group of
genes downregulated upon LIF withdrawal, and rescued by
Nanog, is similarly enriched for Nanog binding regions where
Nanog leads the recruitment of other TFs (clusters 1 to 4) than
for those where it does not (clusters 5 to 8; Fig.
4
f and
Supple-mentary Fig. 4F). The activatory potential of Nanog through
clusters 1 to 4 was already established from the previous analysis.
However, the vast majority of genes upregulated by Nanog in the
absence of LIF were not activated in LIF containing medium
(>700 genes; Source Data, sheet 1). This suggests that in the
presence of LIF, these genes were redundantly controlled by other
LIF-dependent TFs, either through regions belonging to clusters 5
to 8 or through other regulatory elements where Nanog does not
bind. Since clusters 5 to 8 were previously associated with genes
repressed by Nanog in the presence of LIF, their enrichment in
the vicinity of genes activated by Nanog in the absence of LIF
implies that they are constituted by at least two functional
cate-gories: enhancers that are blocked by Nanog in the presence of
LIF, leading to the downregulation of Nanog targets, and
enhancers where Nanog also acts as an activator but redundantly
to other LIF-dependent factors, most likely Esrrb. In agreement,
this group is strongly enriched in genes of the pluripotency
net-work (Fig.
4
g), which are known to be controlled by several
pluripotency TFs and from multiple distinct enhancers. The level
of upregulation of these Nanog-activated genes is, however,
relatively minor and the rescue of pluripotent TFs, including
Esrrb
and
Klf4
, marginal (Fig.
4
d and Supplementary Fig. 4A, C).
Finally, LIF-responsive genes that are not rescued by Nanog are
associated with clusters 5 to 8 (Fig.
4
f). This indicates that a large
number of regulatory regions of the pluripotency network for
which Nanog has a modest functional impact are present within
these clusters. These regions activate or repress genes prior to
differentiation in a Nanog-independent manner; upon
LIF-withdrawal, their activity is likely invalidated with the ensuing
consequences on gene expression even when
Nanog
is induced.
These Nanog-independent, LIF-responsive genes, are closely
associated with cluster 6 (Supplementary Fig. 4F), which is
dominated by Esrrb (Fig.
3
d and Supplementary Fig. 3), a
pro-minent LIF target. This is particularly true for genes
down-regulated upon LIF withdrawal; satisfactorily, given the known
role of Esrrb as a general regulator of metabolism and energy
production
28, these genes are enriched for related terms such as
oxidation-reduction (Fig.
4
g). Notably, the inability of Nanog to
rescue these genes further supports the notion that our SunTag
cells have acquired LIF-independent self-renewal in the absence
of functional Esrrb. In conclusion, these analyses underscore the
complexity of the pluripotency network: whilst Nanog activates
genes both in the presence and absence of LIF through regulatory
regions belonging to clusters 1 to 4, at other enhancers the
acti-vation of Nanog can only be unmasked in the absence of LIF,
when other pluripotency TFs are downregulated and their
func-tional redundancy with Nanog is abolished. Unexpectedly,
how-ever, the genes repressed by Nanog in the absence of LIF, which
exhibit a robust rescue of higher magnitude than that observed
for the genes that Nanog activates (Supplementary Fig. 4E),
appear largely disconnected from the Nanog binding regions that
we have studied here (Fig.
4
f and Supplementary Fig. 4F). These
genes are associated, among other categories, with signalling and
molecular pathways linked to differentiation (Fig.
4
g). Hence, the
probably indirect repression mediated by Nanog over these genes
may underlie LIF-independent self-renewal in Dox-treated
Sun-Tag cells, despite the lack of Esrrb and Klf4.
Nanog sustains H3K27me3 upon LIF withdrawal
. Gene set
enrichment analysis indicated that Nanog-rescued genes that are
normally upregulated upon LIF withdrawal are enriched for
targets of Polycomb Group proteins and for one of the marks
they deposit to trigger facultative heterochromatin, H3K27me3
(FDR < 6e-43; Supplementary Fig. 5A). Hence, we pro
fi
led
H3K27me3 in SunTag cells grown in the presence/absence of LIF
and Dox. Overall, the patterns of H3K27me3 were found similar
among all conditions, with notable exceptions (Fig.
5
a). We
identi
fi
ed three broad classes of H3K27me3 domains: those with
high levels across all conditions and those that show either a loss
or a gain of H3K27me3 upon LIF withdrawal (Fig.
5
b and Source
Data, sheet 3). Strikingly, the regions losing H3K27me3 in the
absence of LIF maintained signi
fi
cant levels when endogenous
Nanog
expression was induced with Dox (Fig.
5
b). In the
pre-sence of LIF, however, the induction of Nanog had minor
con-sequences on H3K27me3, if any. This indicates that Nanog and
LIF use parallel pathways to maintain H3K27me3 at a subset of
H3K27me3 domains, and suggests that Nanog may confer
LIF-independent self-renewal by sustaining H3K27me3 at these
regions. Notably, the genes upregulated upon LIF withdrawal
display differential enrichment among these three classes of
H3K27me3 Bmp4 Otx2 0 1 0 1 0 1 0 1 +LIF –DOX +LIF +DOX –LIF –DOX –LIF +DOX +LIF –DOX +LIF +DOX –LIF –DOX –LIF +DOX 0.3 0.6 0 H3K27me3 (RPKM) Up & rescued Up & not rescued 0 60 80 100 20 40 % of colonies Undiff Mixt Diff – – – LIF gNanog – + DOX + – + + + gOtx2 + + Passage 1 1 1 – – + + 2 – + + + 2 TSS +5 kb –5`kb –5 kb TSS +5 kb Down & rescued Otx2 compensation Up & rescued
Nanog Nanog +Otx2
FC Log2 in –LIF
–1 +1 H3K27me3 +LIF –DOX +LIF +DOX –LIF –DOX –LIF +DOX 0 0.5 1 Up in –LIF Down in –LIF 0% 30% Genes –3 0 3 Stable 3140 Loss 1406 Gain 1694 LIF + DOX + – + – – + – Up & rescued Up & not rescued Z score
Down & rescued
Down & not rescued Proportion of genes
a
b
c
d
e
f
Fig. 5A Nanog/H3K27me3/Otx2 axis controls LIF-independent self-renewal.aH3K27me3 average levels (reads per million) across 5.15 Mb (mm9:
chr14:45346123–50415313, red and blue boxes represent genes on the+and−strands) encompassing theBmp4andOtx2genes that display the two stereotypical behaviours observed in SunTag cells cultured in the presence/absence of LIF/Dox for 3 days.bHeat map of H3K27me3z-scores of 6,240 H3K27me3 domains identified in SunTag cells cultured as indicated.cAverage H3K27me3 (reads per million) across promoter regions of genes upregulated in the absence of LIF and either rescued (left) or not (right) by Nanog.dCorrelative analysis of ranked H3K27me3 (left) with gene expression changes (arbitrary units; middle) for transcripts upregulated (top) or downregulated (bottom) in SunTag cells cultured in the presence/absence of LIF/Dox for 3 days. The percentage of genes belonging to rescued (red line) versus non-rescued genes (blue line) in a 500 gene sliding window across the regions of the heat map is shown on the right.eHistogram representing the percentage of undifferentiated (red), mixt (blue) and differentiated (white) colonies (Y-axis) counted after 6 (Passage 1) or 12 (Passage 2) days of clonal growth in the indicated conditions (X-axis). Error bars represent std. dev. (n=4).
fHeat map of the average log2 fold change+Dox/−Dox in gene expression between SunTag cells activating eitherNanogorNanogandOtx2, grown in the absence of LIF and the presence/absence of Dox for 3 days. Genes for which the simultaneous activation ofOtx2compensates the changes observed when
H3K27me3 domains, depending on their Nanog-responsiveness:
while nearly 70% of Nanog-rescued genes are marked by
H3K27me3, which tends to decrease upon LIF-withdrawal except
when Nanog is induced, only 30% of genes that are not rescued
by Nanog show a similar pattern (Supplementary Fig. 5B). This
con
fi
rms that Nanog-rescued genes are particularly enriched in
LIF-dependent H3K27me3. More speci
fi
cally, H3K27me3
con-centrates around the promoters of these genes, and displays a
reduction in levels upon LIF withdrawal, exclusively in the
absence of
Nanog
induction (Fig.
5
c). Hence, Nanog stimulates
the maintenance of H3K27me3 at a large subset of the promoters
it represses in the absence of LIF. Nevertheless, a third of the
genes repressed by Nanog in the absence of LIF are not embedded
within H3K27me3; conversely, a third of the genes that are
upregulated upon LIF withdrawal regardless of Nanog expression
are enriched in H3K27me3 (Supplementary Fig. 5B) and
main-tain higher levels around their promoters in the presence of
Nanog (Fig.
5
c). Thus, we determined whether quantitative
dif-ferences regarding the effect of Nanog over these groups could be
measured. Among the genes repressed by Nanog, the higher
magnitude of rescue is observed for those genes that are
embedded in H3K27me3 (Supplementary Fig. 5C). Similarly,
even though their gene expression changes upon Dox induction
were not statistically signi
fi
cant, within the group of genes not
rescued by Nanog, those enriched in H3K27me3 show a clear
tendency to be downregulated (Supplementary Fig. 5C). A clear,
global pattern can be inferred from these analyses: the ability of
Nanog to rescue genes that are upregulated upon LIF withdrawal
is directly correlated with H3K27me3 levels. Accordingly,
ordering the heatmap of genes upregulated upon LIF withdrawal
(regardless of the ability of Nanog to rescue them) by their
enrichment levels for H3K27me3 in the presence of LIF and the
absence of Dox, naturally orders the genes from ef
fi
cient to poor
rescue (Fig.
5
d). Hence, H3K27me3 levels before LIF withdrawal
are highly predictive of the ef
fi
ciency of Nanog to block gene
upregulation during differentiation. Overall, these analyses
indi-cate that in the absence of LIF, Nanog mediates its repressive
function by other means than those described in its presence
(Fig.
3
): by maintaining high levels of H3K27me3. Since Nanog
binding regions were not strongly associated with these genes
(Fig.
4
f), it seems likely that this effect is indirect and possibly
mediated by the upregulation of the Polycomb protein Phf19
29,
which is upregulated upon
Nanog
induction (Supplementary
Fig. 6).
Nanog represses
Otx2
to confer LIF independency
. Among the
genes downregulated by Nanog in the absence of LIF are several
developmental TFs such as
Sox11
,
Id1
and
Pou3f1
, among others
(Source Data, sheet 1). Therefore, it may be possible that
LIF-independent self-renewal is attained by the simultaneous
inhibi-tion of several developmental pathways. However, within the list
of Nanog-repressed genes characterised by Nanog-dependent
H3K27me3, we could also identify
Otx2
(Fig.
5
a and Source Data,
sheet 3), a key regulator of the earliest stages of ES cell
differentiation
30,31. Several lines of evidence point to
Otx2
downregulation being an important mediator of Nanog function.
First,
Otx2
has been already identi
fi
ed as an important negative
target of Nanog
15,32; accordingly, we observe its downregulation
at the mRNA and protein levels upon
Nanog
induction
(Sup-plementary Fig. 5D, E). Moreover, further expression analyses
indicate
Otx2
expression which is closely controlled by Nanog
levels (Supplementary Fig. 5F). Second, the genes that are
upre-gulated in the absence of LIF and that are rescued by Nanog, are
enriched in genes activated by Otx2, while non-rescued genes are
not (Supplementary Fig. 5A). Third, the ectopic expression of
Otx2 drives ES cells into differentiation
31,32, even in the presence
of LIF, as we show here using our SunTag system targeted to the
Otx2
promoter (Supplementary Fig. 5E and G). Therefore, it may
be possible that its Nanog-mediated downregulation contributes
to LIF-independent self-renewal in the context of our endogenous
Nanog
activation, despite the lack of strong upregulation of
Klf4
and
Esrrb
. To test this, we exploited the
fl
exibility of the SunTag
system to simultaneously activate
Nanog
and
Otx2
and perform
clonal assays. Upon the additional induction of
Otx2
, the
pro-portion of undifferentiated colonies decreased in the absence of
LIF, compared to cells activating
Nanog
only, in particular after
two successive rounds of clonal growth (Fig.
5
e). These results
clearly place Otx2 as a key factor that needs to be repressed by
Nanog in order to obtain ef
fi
cient LIF-independent self-renewal.
Next, we performed transcriptomic analyses upon
Nanog
/
Otx2
induction in the absence of LIF to identify the set of genes that
were effectively compensated by the action of Otx2. We observed
that around 40% of the genes repressed by Nanog, and 70% of the
genes activated by Nanog, displayed similar levels to control cells
grown in the absence of LIF and Dox, when both
Otx2
and
Nanog
were induced (Fig.
5
f). Hence, at the molecular level,
Otx2
induction partially compensates the gene expression changes
induced by Nanog overexpression in the absence of LIF,
under-scoring the antagonistic effect of Nanog and Otx2 over a large set
of common genes
32, including developmental TFs such as
Sox3
,
Sox11
,
Id1
and
Pou3f1
, among others (Source Data, sheet 1),
which tend to be expressed in somatic cells and more particularly
in neuroectodermal derivatives. In combination with the previous
section, these results indicate strongly that Nanog controls
H3K27me3 at key nodes in the differentiation network, such as
Otx2
, to indirectly repress a large set of genes involved with
differentiation.
Discussion
Gene regulatory networks constituted of master TFs are
char-acterised by the capacity of individual factors to act over the same
sets of regulatory elements, which together de
fi
ne and specify the
molecular and transcriptional identity of each cell type
33,34.
However, we still have a relatively poor understanding of how
single TFs impact globally on the recruitment of other members
of a given network to impact its activity. Recently, the role of Oct4
has been suggested to rely on its ability to recruit Brg1 to render
the chromatin accessible for other TFs to bind
35, matching a
subset of the mechanisms we propose here for Nanog (Fig.
6
).
However, it is unclear how much the initiation of differentiation
that follows Oct4 depletion
10in
fl
uenced the interpretations
regarding how Oct4 directly impinges upon the pluripotency
network. In our case, we have focused on Nanog, a factor that can
be depleted from ES cells while preserving pluripotency
36. Hence,
it is likely that the rewiring of the network that we observe shortly
after depleting Nanog, is due to primary and direct effects.
Strikingly, our analyses suggest that the simpli
fi
ed view positing
that pluripotency TFs bind cooperatively at regulatory elements
to collectively control transcription, may need to be partially
revisited: at least from the perspective of Nanog, the
combina-tions of binding, their dependencies on Nanog, and their
asso-ciation to responsive genes, are more complex than we had
previously anticipated.
Although we observe, as expected, that Nanog-bound regions
where other pluripotency TFs that are also recruited are more
strongly associated with Nanog-responsive genes compared to
regions where Nanog binds alone, we also
fi
nd that only a small
subset displays similarly high binding levels of all three
plur-ipotency TFs that we tested (Esrrb, Oct4 and Sox2). Indeed, the
binding of one or two factors, in addition to Nanog, tends to
dominate the others. This is valid even for Oct4/Sox2, which are
believed to bind together at Oct4/Sox2 chimeric motifs
11.
Therefore, different stoichiometries and/or residence times of
individual factors seem to apply at distinct sets of regions. This
produces a level of complexity that surpasses a simple model in
which all factors bind together at key enhancers. Moreover, the
effect of Nanog over these factors is also highly variable, with two
clear groups of regions being easily identi
fi
able: those in which
Nanog plays a leading role; those where it does not (Fig.
6
).
Strikingly, these two groups of regions display sharp distinctions
regarding their association to Nanog-responsive genes. Regions
where Nanog preserves chromatin accessibility and drives the
recruitment of other pluripotency TFs and Brg1, are strongly
biased to genes activated by Nanog. Conversely, the regions where
Nanog does not promote TF binding or accessibility are
asso-ciated either with genes repressed by Nanog in the presence of
LIF, or with genes where Nanog acts as a redundant activator
with LIF-stimulated TFs.
To activate its targets, Nanog seems to use an expected
mechanism essentially based on establishing a permissive
chro-matin architecture associated with the recruitment of other TFs
and the formation of functional regulatory complexes. In
con-trast, while some precedents pointed in the direction of Oct4/
Sox2-independent Nanog repression
37,38, it is remarkable that
Nanog-mediated repression is so strongly associated with
reg-ulatory elements where Nanog does not facilitate Esrrb, Oct4 and
Sox2 binding and the chromatin remains equally accessible
irrespectively of Nanog. This differential association between gene
activation/repression and the role of Nanog as a nucleation factor
of functional complexes, suggests that Nanog displays cooperative
binding primarily to promote gene expression. At repressive sites,
Nanog may either render the whole complex repressive or inhibit
its otherwise transactivation potential. Additionally, at a large
number of regions, the loss of Nanog leads to increased binding
of either Oct4 or Sox2. It is therefore questionable that Nanog/
Oct4 and Nanog/Sox2 bind at the same time on the same DNA
molecules, at least over these regions. Thus, caution must be
taken when extrapolating molecular functions from generic
binding pro
fi
les: even though Nanog/Oct4 and Nanog/Sox2
appear to bind together, the binding of Nanog is in fact
detri-mental to that of the other two factors. Remarkably, these regions
are closely associated with genes repressed by Nanog, indicating
that to repress its targets Nanog interferes with the binding or the
activity of other pluripotency TFs (Fig.
6
). Whether the alternate
behaviours of Nanog is to activate or repress transcription
represents a general rule or a speci
fi
c property of Nanog, which
should be thoroughly investigated.
The ability of Nanog to block differentiation and promote
LIF-independent self-renewal, something that not every pluripotent
TF, including Oct4 and Sox2, is capable of doing, represents a
de
fi
ning property of Nanog
14. However, this is not a unique
characteristic of Nanog: a plethora of additional TFs, exempli
fi
ed
by Klf4 and Esrrb, have been progressively identi
fi
ed and
demonstrated to provide LIF-independent self-renewal
12,15.
Hence, over the years, the importance of Nanog has been
somehow equilibrated with that of other TFs, most notably Esrrb,
which can replace Nanog in several contexts
15,39. More strikingly,
Esrrb has been proposed to be an obligatory mediator of the
promotion of LIF-independent self-renewal by Nanog
15.
There-fore, our observation of LIF-independent self-renewal in the
absence of strong Esrrb upregulation, and of many other
plur-ipotency TFs, is particularly enthraling. This is not the
fi
rst time,
however, that the role of a TF within the pluripotency network
needs to be nuanced. Nanog itself was initially thought to be
essential for germ cell development
36and for the induction of
pluripotency via somatic cell reprogramming
40, conclusions that
were subsequently attenuated by the demonstration that Nanog
can ultimately be bypassed
39,41–43. Moreover, major experimental
differences between our and previous studies may underlie the
different conclusions regarding the mandatory requirement for
Esrrb. Indeed, while others ectopically expressed Nanog
con-stitutively and at high levels in
Esrrb
knock-out cells
15, we have
used an inducible CRISPR-ON system to activate endogenous
Nanog
concomitantly with LIF withdrawal and the ensuing
Accessibility Nanog Oct4 Sox2 Esrrb Brg1 Nanog Oct4 Sox2 Nanog Oct4 Sox2 Esrrb Brg1 Nanog Nanog builds activatoryenhanceosomes Nanog is redundant to LIF-stimulated TFs Nanog denies enhancer activity LIF Nanog sustains H3K27me3 Nanog LIF Regulatory elements clusters 1 to 4 Regulatory elements clusters 5 to 8 Regulatory elements clusters 5 to 8 Activation IN +/– LIF Activation IN – LIF Repression IN + LIF Repression IN – LIF Nanog rewires
the pluripotency network
Nanog is redundant to LIF-regulated processes
Differentiation genes e.g. Otx2
Fig. 6Nanog is a versatile TF impacting the pluripotency network and epigenome. The function of Nanog at stereotypical clusters of regulatory elements
targeted by the pluripotency network, as well as at differentiation genes, is shown. Briefly, Nanog displays four major behaviours (left to right): 1/ recruitment of other factors (Oct4, Sox2 and Esrrb, together with Brg1) to promote chromatin accessibility and activate gene transcription; 2/ inhibiting enhancer activity, leading to gene repression either by blocking Oct4/Sox2 recruitment (shown) or by other mechanisms (not shown for simplicity; see text for details); 3/ complementing enhancer activity redundantly with other factors which are controlled by LIF (such as Esrrb)—in this case, its activatory role can only be appreciated in the absence of LIF; 4/ Nanog and LIF act in parallel to sustain H3K27me3 at differentiation genes such asOtx2. This latter role of Nanog is particularly important in the context of Nanog-mediated, LIF-independent self-renewal
progressive downregulation of
Esrrb
. Therefore, the dynamic
aspects of the two experimental setups are drastically different: it
is possible that
Esrrb
is downregulated after Nanog has already
impacted on other genes, which may independently block
dif-ferentiation even when
Esrrb
is subsequently silenced. Besides
this, however, our
fi
ndings in the context of previous conclusions
underscore that different factors and mechanisms can potentially
lead to similar phenotypic outcomes
44.
Identifying the genes that mediate LIF-independent
self-renewal in the absence of Esrrb may be particularly challenging
because several prominent developmental regulators, from TFs to
signalling molecules, are enriched among the genes that normally
respond to LIF withdrawal but that endogenous
Nanog
induction
is able to block. However, the genes that are upregulated when
LIF is removed, and that Nanog is able to keep in check, display a
blatant property: they tend to be targets of Polycomb PRC2
complexes and are embedded within H3K27me3 domains
16,17,19.
At these genes, either LIF or Nanog are required to maintain
H3K27me3 (Fig.
6
). Therefore, this study identi
fi
es at least two
modes of gene regulatory redundancy between Nanog and the
LIF pathway: one directly based on LIF-stimulated TFs, such as
Esrrb and Klf4, and another one based on the activity of
Poly-comb Group proteins. We anticipate that identifying the exact
molecular mechanisms used by Nanog to modulate H3K27me3
will be of great interest, and propose here that they may be
mediated, at least in part, by Phf19. Overall, our observations
argue for the existence of an alternative pathway to promote
LIF-independent self-renewal through a previously unanticipated role
of Nanog in the maintenance of H3K27me3 at
differentiation-associated genes, thereby inhibiting the capacity of the cells to
readily differentiate. This type of compensatory, chromatin-based
mechanism, enables individual TFs to have broad impact by
targeting key chromatin regulators with a more generic and
systemic function. This remains so even when a regulatory
net-work is largely dismantled, as is the case of the pluripotency
network in the absence of LIF. This mechanism that we have
unveiled may have the potential to dramatically increase the
robustness and temporal integration of complex gene regulatory
systems.
Whether the promotion of LIF-independent self-renewal
associated with the inappropriate maintenance of H3K27me3 at
differentiation genes results from the sum of many partial effects
or, conversely, is based on speci
fi
c and potent effects mediated by
one or a few regulators, needs now speci
fi
c attention. Given that
the genes repressed by Nanog in the absence of LIF are strongly
enriched for targets of Otx2, a driver of differentiation
30,31that
belongs to the category of bivalent genes in ES cells, we explored
the possibility that
Otx2
downregulation may be the sole
expla-nation for LIF-independent self-renewal in the absence of
induced expression of other pluripotency TFs than Nanog itself.
Using our SunTag cells to simultaneously activate both
Nanog
and
Otx2
, we could indeed observe that the ef
fi
ciency of
self-renewal was lower compared to the exclusive induction of
Nanog
.
However, the effects became robust after two continuous phases
of clonal growth, indicating that, for this level of upregulation of
Otx2
, the functional compensation takes time to be fully
estab-lished. Nevertheless, our transcriptomic studies after three days of
induction show that a large fraction of the genes normally
mis-regulated upon
Nanog
induction have expression levels similar to
control cells. In accord with the developmental role of Otx2
45,
this seems to be particularly true for neuroectodermal genes. It
should now be investigated whether a relationship similar to
Nanog-Otx2 exists between Nanog and other lineage speci
fi
c
determinants targeted by H3K27me3. Similarly, whether the
Nanog-Otx2 functional interactions that we have studied also
apply to additional TFs driving LIF-independent self-renewal
requires additional work: the inducible SunTag system presented
here will provide a
fl
exible toolbox to address these and similar
questions in mouse ES cells. Overall, this work underlines the
ability of
Nanog
to convey its function through remarkably
dis-tinct molecular mechanisms in different environmental
condi-tions (Fig.
6
). Extrapolating our work to other TFs of the
pluripotency network and more generally to other gene
reg-ulatory systems, would be of great interest.
Methods
Cell culture.Regular cultures:ES cells (E14Tg2a and derivatives) were cultured at
37 °C in 7% CO2 on 0.1% gelatine (SIGMA, G1890–100G) in DMEM+ GlutaMax-I (Gibco 31966–021), 10% FCS (Sigma F7524), 100μM 2-mercaptoethanol (Gibco 31350–010), 1× MEM non-essential amino acids (Gibco 1140–035) and 10 ng/ml recombinant LIF (MILTENYI BIOTEC, 130–099–895). Cells were passaged 1:10 every 2–3 days with 1× trypsin-EDTA 0.05% (Thermo 25300062). Only when mentioned cells were cultured in 2i medium containing 0.5× DMEM/F12 (Gibco 31331093), 0.5× Neurobasal (Gibco 21103049), 0.5% N2 supplement 100× (Gibco 17502048), 1% B27 supplement 50× (Gibco 17504044), 10 μg/mL Insulin (Sigma I1882–100MG), 2 mM L-Glutamine (Invitrogen 91139), 0.05% BSA (Sigma A3311–10G), 100μM 2-mercaptoethanol (Gibco, 31350–010), 10 ng/ml recombi-nant LIF (MILTENYI BIOTEC, 130–099–895), 1 μM PD0325901 (Axon Medchem Bv Axon-1408), 3 μM CHIR99021 (Axon Medchem Bv Axon-1386). When spe-cified cells were treated with 1 μg/mL of Doxycycline (Sigma D3072–1ML), 1 μg/ mL Puromycin (Sigma P9620–10ML), 400 μg/mL Hygromycin B (Sigma H3274–50MG), 0.2 mg/mL G418 (Sigma G8168–10ML), 1 μM Tamoxifen (Sigma H7904–5MG).
Nanog loss-of-function and gain-of-function:For all SunTag induction experiments, 30,000 cells per cm2were plated in presence or absence of
Doxycycline/LIF. Medium was changed every day after one wash with the same medium. At day 3, cells were either lysed on the plate for RNA extraction or harvested for Western blot lysates, microscopy slides and chromatin preparation. For induction kinetics over 6 days, cells were passaged at day 3 at the same density. 44iN cells15were kept in culture with Doxycycline for at least 3 passages, except when explicitly stated. Subsequently, 30,000 cells per cm2were plated in presence
or absence of Doxycycline for the indicated times. To culture 44iN cells in the absence of Nanog long-term, the cells were maintained under G418 selection, as previously described15. Finally, 44NERT38cells were cultured under G418 selection and plated at 30,000 cells per cm2to perform Tamoxifen induction kinetics for the
indicated times.
Clonal assays:Clonal assays were performed by plating 600 cells/P6 well in+/− LIF and+/−Dox, in parallel. Medium was changed every day after one wash with the same medium. After 6 days, colonies werefixed (25% Citrate solution, Sigma 854: 67% Acetone, Sigma 270725; 8% Formaldehyde, Sigma F8775) for 1 min and stained for 20 min with Alkaline Phosphatase staining kit (Sigma, 86 R). Number of undifferentiated, mixt and differentiated colonies was then assessed on a stereo-microscope (NIKON-SMZ1500). For serial cloning assay, all cells from−LIF +Dox condition were harvested at day 6, counted and plated again at clonal density for 6 additional days, as indicated, and processed as above. Raw colony counts can be found as Source Data (sheet 4). Finally, to assess the pluripotent state of Nanog SunTag cells cultured in−LIF+Dox, all cells were harvested at day 6 and passaged 1:4 in FCS/LIF for 1 day to ensure correct cell adhesion. The next day medium was replaced by 2i/LIF.
Generation of SunTag ES cells.Cloning of the SunTag and gRNA expressing
vectors:The SunTag vectors were obtained from Addgene (#60903, #60904). The PiggyBac vectors containing the rtTA trans-activator (PB-CAG-rtTA) and a TRE-driven expression cassette (A-ND2), as well as the PBase vector were kindly pro-vided by Dr. Pentao Liu46. To generate the PB-TRE-SunTag-dual-Hygro vector (see Sup. Fig1) expressing the two moieties of the SunTag system, wefirst modified #60903 as follows. The TRE promoter was PCR-amplified and inserted upstream of dCas9. Next, we excised the lentiviral part of the vector downstream of the WPRE element and ensured its integrity by ligating a short WPRE amplicon. Both 5′and 3′LTRs were PCR-amplified from PB-CAG-rtTA and sequentially inserted on both sides of the TRE-dCas9-GCN4-BFP cassette, and a bGH polyA signal was PCR amplified and inserted downstream of the BFP sequence. Finally, an IRES-Hph (Hygromycin resistance) cassette was amplified by PCR and inserted in frame with the dCas9-GCN4-BFP cassette upstream of the bGH polyA signal, generating the PB-TRE-dCas9-GCN4-P2A-BFP-IRES-Hph-pA vector. To modify #60904 wefirst PCR-amplified the scFv-GCN4-sfGFP-VP64-GB1-NLS cassette and inserted it in A-ND2 vector downstream of the TRE promoter. After a subsequent PCR amplification of the resulting cassette, it wasfinally inserted in the modified #60903 vector, generating ourfinal Dox-inducible SunTag construct. To generate the gRNA expression vector, we used the #51133 plasmid (Addgene) to introduce the U6-gRNA-PGK-PuroR-pA cassette in the PiggyBac backbone of the PB-CAG-rtTA. The resulting plasmid is referred to as PB-gRNA-Puro. This vector was used to clone annealed oligos corresponding to the 20 bp of the sgRNA sequence pre-ceded by specific overhangs (5′-CACC and 5′TTTG).