Middlesex University Research Repository
An open access repository of
Middlesex University research
http://eprints.mdx.ac.uk
Senthilnath, J. and Kulkarni, Sushant and Benediktsson, J. A. and
Yang, Xin-She (2016) A novel approach for multispectral satellite image
classification based on the bat algorithm. IEEE Geoscience and
Remote Sensing Letters, 13 (4). pp. 599-603. ISSN 1545-598X
http://dx.doi.org/10.1109/LGRS.2016.2530724
Final accepted version (with author's formatting)
Available from Middlesex University’s Research Repository at
http://eprints.mdx.ac.uk/19322/
Copyright:
Middlesex University Research Repository makes the University’s research available electronically.
Copyright and moral rights to this thesis/research project are retained by the author and/or
other copyright owners. The work is supplied on the understanding that any use for
commercial gain is strictly forbidden. A copy may be downloaded for personal,
non-commercial, research or study without prior permission and without charge. Any use of
the thesis/research project for private study or research must be properly acknowledged with
reference to the work’s full bibliographic details.
This thesis/research project may not be reproduced in any format or medium, or extensive
quotations taken from it, or its content changed in any way, without first obtaining permission
in writing from the copyright holder(s).
If you believe that any material held in the repository infringes copyright law, please contact
the Repository Team at Middlesex University via the following email address:
[email protected]
Abstract— Amongst the multiple advantages and applications
of remote sensing, one of the most important use is to solve the problem of crop classification, i.e., differentiating between various crop types. Satellite images are a reliable source for investigating the temporal changes in crop cultivated areas. In this work, we propose a novel Bat Algorithm (BA) based clustering approach for solving crop type classification problems using a multi-spectral satellite image. The proposed partitional clustering algorithm is used to extract information in the form of optimal cluster centers from training samples. The extracted cluster centers are then validated on test samples. A real-time multi-spectral satellite image and one benchmark dataset from the UCI repository are used to demonstrate robustness of the proposed algorithm. The performance of the Bat Algorithm is compared with the traditional K-means and two other nature-inspired metaheuristic techniques, namely, Genetic Algorithm and Particle Swarm Optimization. From the results obtained, we can conclude that BA can be successfully applied to solve crop type classification problems.
Index Terms – Multi-spectral satellite image, Clustering, Genetic Algorithm, Particle Swarm Optimization, Bat Algorithm
I. INTRODUCTION
GRICULTURE is the science or practice of producing and harvesting crops in a systematic manner. Increment in agricultural yield is now a necessity due to constrictions in the expansion of acreage and constantly increasing demand for food. The agricultural productivity is defined as the product of crop yield and planting area and hence production estimation consists of area prediction and yield estimation. Therefore, there is a strong need to make the optimum use of available resources for cultivation. The use of remote sensing has multiple advantages and applications, and one of the key applications amongst them is the crop classification; i.e. differentiating between different varieties of crops [1].
Satellite images can also be a viable source for investigating the temporal changes in the agricultural activities of a particular area [2]. The crop growth, from sowing through to harvesting, can be monitored using these satellite images. The orthorectified and georeferenced satellite images can be used J. Senthilnath is with the Department of Aerospace Engineering, Indian Institute of Science, Bangalore 560012, India (e-mail: [email protected])
Sushant Kulkarni is with the Department of Aerospace Engineering, Indian Institute of Science, Bangalore 560012, India (e-mail: [email protected]) J.A. Benediktsson is with the Faculty of Electrical and Computer Engineering, University of Iceland, Reykjavik, Iceland. (e-mail: [email protected])
Xin-She Yang is with the School of Science and Technology, Middlesex University, London, NW4 4BT, UK (e-mail: [email protected]).
to identify problematic areas and the size of the area affected. Seasonal changes and abnormalities in vegetation can also be determined. Additionally, they can also be used to make an early estimate of the crop yield. Further, based on the available information, activities like – deciding type of crop and its acreage [3], determining the growth stage of crop [4], delineating their extent [1] can be planned in advance. All such information can be used in the overall improvement of the agricultural yield.
Multi-spectral satellite images facilitate identification and classification of crops, since they take into consideration the changes in reflectance as a function of the particular crop type. Crop classification finds applications in auditing land usage, soil and water quality studies, and planning efficient crop cultivation. But due to the variability in cultivation of crops within a geographical area, the process of classification is a major challenge [5].
Clustering of satellite images can be put into two categories, namely, hierarchical clustering and partitional clustering [6], [7]. Clustering is a method of grouping a particular set of data points in such a way that data points in the same group are nearly similar. It aims to minimize the intra-cluster distance and maximize the inter-cluster distance. The information extracted from data points is in the form of optimal cluster centers. For the hierarchical approach, a hierarchy of clusters is created initially and clustering is formed by splitting and merging of the clusters, based on a certain similarity measure [8]. Recently, many researchers have applied hierarchical techniques for clustering satellite images [9-12]. Most commonly used hierarchical technique is Iterative Self Organizing Data Analysis Technique Clustering Algorithm (ISODATA), but it suffers from the drawback of converging to local optima [13].
Partitional clustering is carried out by dividing the data into a fixed number of clusters (which is known a priori), using a similarity measure [14]. K-means is one of the popularly used the partitional clustering method. However, the K-means method also suffers from a major drawback of converging to initial local optima instead of the global optima [15]. To overcome this problem, many researchers have used nature-inspired metaheuristic algorithms [16-19]. Furthermore, hybrid evolutionary optimization algorithms based on combining evolutionary methods and K-means to overcome local optima problems have also been applied [20].
The Bat Algorithm (BA) is a relatively new nature-inspired algorithm, which is based on the echolocation behavior of microbats [21]. The algorithm was successfully applied in [22]. In [23] and [24], BA and other nature-inspired metaheuristic methods were used with K-means to overcome
A Novel Approach for Multi-Spectral Satellite Image
Classification Based on the Bat Algorithm
J. Senthilnath, Sushant Kulkarni, J.A. Benediktsson, and X-S. Yang
the local optima problem and it was demonstrated that BA had the best performance. It has been observed from the literature that the approach of using BA as a standalone approach to clustering has not been explored.
In this paper, we propose a novel BA based clustering approach for solving crop type classification problems. The data sets used were divided into training and test samples. The proposed algorithm is a partitional supervised clustering where training samples are used to extract knowledge in the form of optimal cluster centers. The extracted cluster centers are validated on the test samples. Clustering techniques commonly use objective functions and the objective function used in the paper is the same as the one in [18]. This objective function when applied on the training data with a population-based algorithm can converge to the globally optimal cluster centers [18]. The performance of the proposed approach is analyzed and compared with other three algorithms, which are widely used in the literature, i.e., K-means clustering, Genetic Algorithm (GA), and Particle Swarm Optimization (PSO). The performance of the different approaches is analyzed using three different performance measures.
This paper is organized as follows. In Section 2 and 3, we discuss BA and its implementation to solve clustering problems with an illustrative example. Results are presented and discussed in Section 4. We conclude our work in Section 5 by summarizing the results.
II. METHODOLOGY
In this section, Bat Algorithm (BA) and its application to clustering problem is explained. The BA is a new powerful nature-inspired metaheuristic optimization algorithm developed by Xin-She Yang in 2010 [21]. The BA is based on the echolocation capability of the microbats. During the search process, BA uses a frequency tuning procedure to intensify the diversity of the solutions in the population. At the same instance, it uses automatic zooming to balance exploration and exploitation by mimicking the variations in the pulse emission rate and loudness of bats when searching for the pray [25].
The BA has been developed with the following assumptions [21]: (i) All the bats make use of their echolocation ability to measure distance and they are able to differentiate between their prey and the background. (ii) Bats fly arbitrarily with velocity vi at position xi, fixed frequency f and loudness A0 to
detect their targets. Bats automatically adjust the wavelength (or frequency) of the pulses and its rate of pulse emission, depending on the vicinity of the target. (iii) The loudness is assumed to vary from a very large positive value A0 to a
minimum constant value Amin.
The position xi and velocity vi should be defined in a d
-dimensional search space and is subsequently updated in successive iterations. The new solutions xit and vit are
calculated for every iteration t as follows:
(1) (2) (3)
where β is an uniform random number between [0, 1], x*is the
current global best solution which is obtained after comparing all the solutions among all the n bats. The velocity increment is given by a product of 𝜆ifi. Hence depending on the domain
of interest, one can use fi(or 𝜆i) to adjust the velocity change
while keeping other factor 𝜆i (or fi) constant. For
implementation f∈ [0, 100] can be used depending on domain size of the interested problem.
After updating the positions of the bats, a random number is generated. If the random number generated is greater than the pulse emission rate ri,a new solution is generated around the current global best solution using a local random walk.
(4)
where 𝜀∈ [-1, 1] is a random number, At=<Ait> is the average
loudness of all the bats in iteration t. The loudness Aiand rate of pulse emission riare updated as the iterations proceed. The
loudness decreases and rate of the pulse emission increases as the bat moves towards its prey (optimal solution). For easy implementation, A0 = 1 and Amin = 0 can be used. Here A=0
indicates bat has found its prey and has temporarily stopped emitting the pulses. The rate of pulse emission is taken as r∈
[0, 1], where 0 indicates no pulse emission and 1 indicates maximum rate of pulse emission. The loudness Ai and rate of
pulse emission ri are updated, and the new solution will be
accepted if the random number is less than Aiand f(xi)<f(x*).
The loudness Aiand rate of pulse emission ri are updated as:
(5) (6)
where α and γ are constants. Here α is similar to the cooling factor of a cooling schedule in the simulated annealing [26].
For any 0<α<1 and 0<γ, we have
, , as (7)
For the ease of implementation, we use α=γ=0.9 in our simulations [21]. The update of velocities and position in BA may share some similarity with Particle Swarm Optimization (PSO) as ficontrols range and pace of movement of solutions.
The pseudo code for BA is shown below in next section.
A. Bat Algorithm for Clustering
The aim of clustering is to minimize the objective function, when given N patterns [27].
(8)
where K is the number of clusters, ck (k=1,2,..,K) is the kth
cluster center, and xi (i=1,2,..N) is the pattern belonging to the kth cluster. Clustering is the assignment of patterns in the data into clusters, such that patterns in one cluster are similar, based on a certain similarity measure. The most commonly used measure is the distance measure.
In our work, cluster centers are the decision variables which are obtained by minimizing the objective function for all the training set patterns in the d-dimensional search space. The objective function being minimized is given by (9) [18].
max min
minf
f
f
f
i
i t i t i t iv
x
x
f
v
* 1 1
t i t i t ix
v
x
1
t old newx
A
x
t i t iA
A
1
t
r
r
it1
i0
1
exp
0
t iA
i0 t ir
r
t
K k i c k i kc
x
k
M
1)
(
(9)
where i=1…K, DTRAIN is the number of samples in training
dataset, CLKNOWN represents the instance to which xj belongs
to, p is the data matrix for cluster i.
In this work, BA is used to minimize the objective function, given by (9), in order to obtain the optimal cluster centers (decision variables). The BA is applied on training samples of two datasets. The number of samples used for training is described in the next section. On the application of BA to training samples, knowledge in the form of optimal cluster centers are extracted. These obtained cluster centers are then validated on corresponding testing samples of both datasets.
Fig. 1. Pseudo code for Bat Algorithm.
III. RESULTSANDDISCUSSION
A. Data Set Description
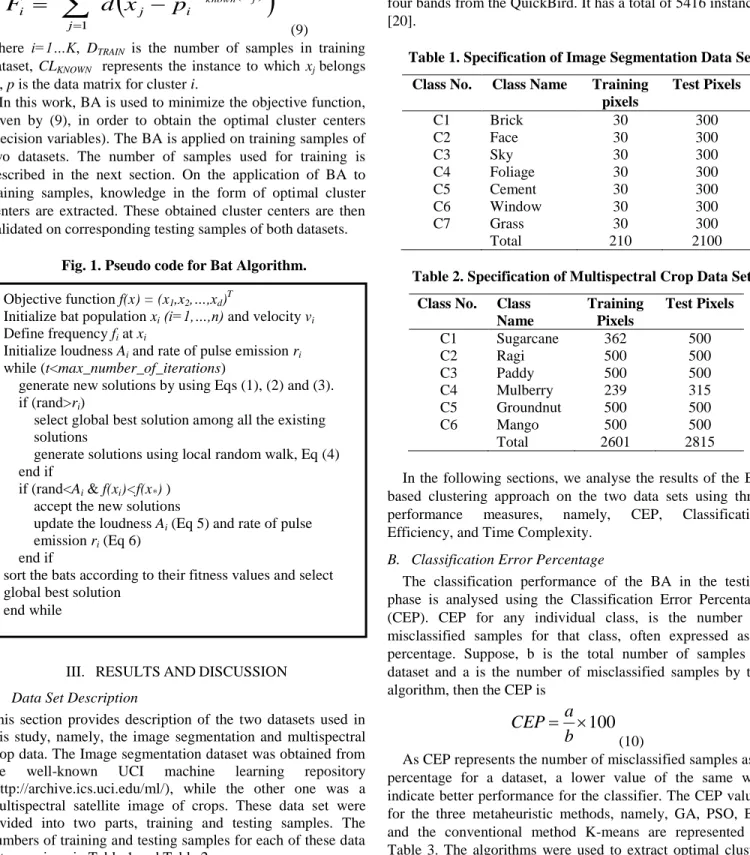
This section provides description of the two datasets used in this study, namely, the image segmentation and multispectral crop data. The Image segmentation dataset was obtained from the well-known UCI machine learning repository (http://archive.ics.uci.edu/ml/), while the other one was a multispectral satellite image of crops. These data set were divided into two parts, training and testing samples. The numbers of training and testing samples for each of these data sets are given in Table 1 and Table 2.
Data set 1 – Image Segmentation: The data set contains instances which were randomly derived from seven outdoor images. It has 2310 instances, 19 attributes and 7 classes. This data set from the UCI repository has been included here to demonstrate robustness of the proposed method.
Data set 2 - Crop: It has 6 classes, which signifies the different types of crops grown in Mysore district, Karnataka, India. The six crops are sugarcane, ragi, paddy, mulberry,
groundnut and mango. It is multispectral satellite image with four bands from the QuickBird. It has a total of 5416 instances [20].
Table 1. Specification of Image Segmentation Data Set. Class No. Class Name Training
pixels Test Pixels C1 Brick 30 300 C2 Face 30 300 C3 Sky 30 300 C4 Foliage 30 300 C5 Cement 30 300 C6 Window 30 300 C7 Grass 30 300 Total 210 2100
Table 2. Specification of Multispectral Crop Data Set. Class No. Class
Name Training Pixels Test Pixels C1 Sugarcane 362 500 C2 Ragi 500 500 C3 Paddy 500 500 C4 Mulberry 239 315 C5 Groundnut 500 500 C6 Mango 500 500 Total 2601 2815
In the following sections, we analyse the results of the BA based clustering approach on the two data sets using three performance measures, namely, CEP, Classification Efficiency, and Time Complexity.
B. Classification Error Percentage
The classification performance of the BA in the testing phase is analysed using the Classification Error Percentage (CEP). CEP for any individual class, is the number of misclassified samples for that class, often expressed as a percentage. Suppose, b is the total number of samples in dataset and a is the number of misclassified samples by the algorithm, then the CEP is
(10)
As CEP represents the number of misclassified samples as a percentage for a dataset, a lower value of the same will indicate better performance for the classifier. The CEP values for the three metaheuristic methods, namely, GA, PSO, BA and the conventional method K-means are represented in Table 3. The algorithms were used to extract optimal cluster centers in the training phase and these optimal clusters were evaluated on the testing dataset. The performance of classifiers is then analyzed by calculating the CEP values for BA and the three other algorithms (GA, PSO and K-means).
From Table 3, for the image segmentation dataset we can observe that BA gives the best performance among all the classifiers with a least CEP of 25.90%. This is followed by PSO and GA, which have a marginal difference amongst
TRAIN k nown j D j x CL i j id
x
p
F
1 ) (100
b
a
CEP
Objective function f(x) = (x1,x2,…,xd)TInitialize bat population xi (i=1,…,n) and velocity vi
Define frequency fi at xi
Initialize loudness Ai and rate of pulse emission ri
while (t<max_number_of_iterations)
generate new solutions by using Eqs (1), (2) and (3). if (rand>ri)
select global best solution among all the existing solutions
generate solutions using local random walk, Eq (4) end if
if (rand<Ai & f(xi)<f(x*) )
accept the new solutions
update the loudness Ai (Eq 5) and rate of pulse emission ri (Eq 6)
end if
sort the bats according to their fitness values and select global best solution
them. Here it is observed that the conventional method K-means fails by a considerable margin and has a higher CEP value as compared to the metaheuristic methods.
Table 3. Classification Error Percentages for Various Algorithms for the Two Data Sets.
Data Set K-means GA PSO BA
Image 41.38 32.68 32.45 25.90
Crop 25.68 19.36 20.07 16.12 Furthermore, we observe from Table 3 that BA has the best CEP value of 16.12% for the crop dataset. This is followed by GA and PSO with 19.36% and 20.07%, respectively. The K-means method significantly lags behind with a CEP of 25.68%. The high values of CEP for K-means indicate its inability to pick up global optimal cluster centers.
Observing the CEP values for both the datasets, from Table 3 it is evident that BA has the least values among all the four classifiers. For both the image and crop datasets, the differences between BA and other methods are significant. Further, we also observe that the performance of GA and PSO are very similar.
C. Classification Efficiency
To classify and evaluate the performance based on individual, average and overall classification accuracies for a given data set, we use partitional clustering technique – (namely K-means, GA, PSO and BA). Initially, the dataset is used to obtain the classification matrix which is of size n * n, where n is the number of classes. A typical entry qij in the classification
matrix shows how many samples belonging to class i have been classified into class j. For a perfect classifier, the classification matrix is diagonal. However, due to misclassification, we get off-diagonal elements. The individual, average and overall efficiency of class i is defined as for all j [9].
(11)
where qii is the number of correctly classified samples and n is
the number of samples for class ci in the data set. The global
performance measures are the individual (ηi), average (ηa) and overall (ηo) classification, nc is the total number of classes and N is the number of samples.
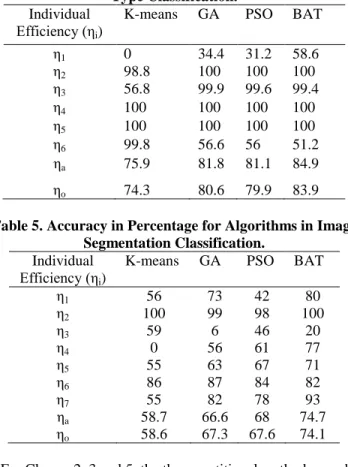
Tables 4 and 5 show the accuracy of the four algorithms for both the datasets. The numbers of samples in the training and test phases for each class are shown in Tables 2 and 1, respectively. Table 4 shows the individual accuracies of the crop data set for the conventional clustering method, K-means and the three nature-inspired meta-heuristic algorithms, namely GA, PSO and BA.
For the crop data set, the K-means algorithm picked nearly the same cluster centers for class one (sugarcane) and class six (mango). Hence, all the pixels belonging to class one (C1) were misclassified as class six (C6), resulting in a zero accuracy for class one. The three nature-inspired population based methods perform better than K-means by converging to
the globally optimum cluster centers for these two classes. Of the three meta-heuristic methods, the BA is able to perform better for Class one with an accuracy of 58.6%, compared to 34.4% and 31.2% achieved by GA and PSO, respectively.
Table 4. Accuracy in Percentage for Algorithms in Crop Type Classification.
Individual Efficiency (ηi)
K-means GA PSO BAT η1 0 34.4 31.2 58.6 η2 98.8 100 100 100 η3 56.8 99.9 99.6 99.4 η4 100 100 100 100 η5 100 100 100 100 η6 99.8 56.6 56 51.2 ηa 75.9 81.8 81.1 84.9 ηo 74.3 80.6 79.9 83.9 Table 5. Accuracy in Percentage for Algorithms in Image
Segmentation Classification.
Individual Efficiency (ηi)
K-means GA PSO BAT η1 56 73 42 80 η2 100 99 98 100 η3 59 6 46 20 η4 0 56 61 77 η5 55 63 67 71 η6 86 87 84 82 η7 55 82 78 93 ηa 58.7 66.6 68 74.7 ηo 58.6 67.3 67.6 74.1
For Classes 2, 3 and 5, the three partitional methods are able to classify all pixels with a good accuracy. In case of Class 3, the K-means method has an individual accuracy of 56.8%, while the other three meta-heuristic methods have been able to perform much better with nearly cent percent accuracy. The low accuracy for the K-means method is due to the fact that the cluster center of class three is overlapping with the cluster center of class one. Hence, many pixels belonging to class three were misclassified as class one, thus bringing down the accuracy. From Table 4, we also observe that the BA has a better average and overall accuracies of 84.9% and 83.9%, respectively.
Further from Table 5, we can again observe the drawback of K-means in converging to local minima, i.e. same cluster centers for class four and class six. This has been overcome by using population-based methods. The BA has the best performance among these methods with 77% accuracy. The BA also exhibits similar performance for classes 1, 2, 5 and 7. The average and overall accuracy is 74.7% and 74.1% respectively, which is the best result among all the four methods.
Hence from Table 4 and Table 5, we can say that the BA is more successful in converging to optimal and global cluster centers as compared to conventional K-means and even popular partitional methods like GA and PSO.
nc i i c an
11
nc i ii oq
N
11
n j ji ii iq
q
1
D. Time complexity
All the algorithms used in this study were executed in Matlab 7.12.0.635, on a system having an i-7 processor and 6GB RAM. The run time for the Crop dataset to converge to the optimal solution (cluster centers) for all the algorithms in ten trials was recorded and averaged. The GA required 78.97s, PSO required 60.85s and BA took 58.19s seconds. K-means converges to cluster centres in just about 0.2 seconds whereas the other metaheuristic algorithms require much more time. This is due to K-means using only an individual point for each class to extract the cluster centers. In contrast, the other metaheuristic methods are n-population based and hence they require additional time for converging to the optimal solution. Among the metaheuristic methods, BA converges fastest and GA takes the maximum time. Based on the performance measures discussed above, we can observe that the BA is computationally quickest of the metaheuristic while still being able to provide the best results (optimal cluster centers).
IV. CONCLUSION
In this work, the BA based clustering algorithm is proposed for solving crop type classification problems based on multi-spectral satellite imagery. An additional data set from the UCI machine learning repository is used to demonstrate the robustness of the proposed approach. The performance of the proposed approach is compared with three other techniques, i.e., K-means clustering, GA and PSO. The results are evaluated using three performance measures, namely, CEP, Classification Efficiency and Time Complexity.
The CEP for BA is significantly lower for both data sets as compared to GA and PSO. In the case of K-means, CEP was highest due to its inability to converge to global optima. The classification efficiency illustrated the performance of the classifiers for each class individually and overall, for all algorithms. The conventional K-means inability to converge to global optima resulted in it picking up nearly same centers for different classes and thereby bringing down both class and overall efficiency. This was overcome by using metaheuristic methods, GA, PSO and BA. The BA converged to much more distinct centers and gave a better performance as compared to GA and PSO. The BA is also computationally efficient and has the ability to converge to solutions more quickly when compared to other two metaheuristic techniques. Hence, from the results obtained, we conclude that BA successfully converges to optimal cluster centers.
The obtained results may indicate that BA can also be used to classify other types of data sets. Therefore, it may be useful to extend the proposed approach to solve a diverse range of classification problems, which can form a topic for further research.
REFERENCES
[1] S. Panigrahy, S.A. Sharma, “Mapping of crop rotation using multidate Indian Remote Sensing satellite digital data,” J. Photogrammetry and
Remote Sensing, vol. 52, no. 2, pp. 95-91, 1997.
[2] F. Li, G. Tian, “Research on Remote sensing Meteorological model for wheat yield estimation,” GISdevelopment.net, AARS, ACRS, 1991.
[3] S.N. Omkar, J. Senthilnath, D. Mudigere, M.M. Kumar, “Crop classification using biologically inspired techniques and high resolution satellite image,” J. Indian Soc. Remote Sens., vol. 36, pp. 175-182, 2008. [4] S.N. Omkar, V. Sivaranjani, J. Senthilnath, M. Suman, “Dimensionality Reduction and Classification of Hyperspectral Data,” Int. J. Aerospace Innovations, vol. 2, no. 3, pp. 157-163, 2010.
[5] G.M. Foody, P.J. Curran, G.B. Groom, D.C. Munro, “Crop Classification with Multi-Temporal X-Band SAR data,” Proc. IGARSS
‘88 Symposium, Edinburgh, Scotland, 1988.
[6] H. Frigui, R. Krishnapuram, “A robust competitive clustering algorithm with applications in computer vision,” IEEE Trans. Pattern Anal. Mach. Intell., vol. 21, 450–465
[7] Y. Leung, J.S. Zhang, Z.B Xu "Clustering by scale-space filtering,"
IEEE Transactions onPattern Analysis and Machine Intelligence, vol.
22, no. 12, pp. 1396-1410, 2000.
[8] A.K. Jain, M.N. Murty, P.J. Flynn “Data Clustering: A Review,” ACM
Comput Surv, vol. 31, pp. 264–323, 1999.
[9] J. Senthilnath, S.N. Omkar, V. Mani, N. Karnwal, P.B. Shreyas “Crop stage classification of Hyperspectral Data Using Unsupervised Techniques,” IEEE J. Select. Topics. Applied Earth Observations and Remote Sensing, vol. 6, no. 2, 2013.
[10] J. Senthilnath, Deepak Kumar, J.A. Benediktsson, Xiaoyang Zhang “A novel hierarchical clustering technique based on splitting and merging,”
International Journal of Image and Data Fusion, 2015, DOI:
10.1080/19479832.2015.1053995
[11] A.K. Jain and R.C. Dubes, “Algorithms for Clustering Data,” Prentice Hall Advanced Reference Series. Upper Saddle River, NJ: Prentice-Hall, 1988.
[12] C. Yunhao, S. Wei, L. Jing, S. Zhongping “Hierarchical object oriented classification using very high resolution imagery and LIDAR data over urban areas,” Adv. Space Res., vol. 43, pp. 1101–1110, 2009.
[13] R. S. Rand and D. A. Davis, “Multivariate Spectral Analysis to Extract Materials From Multispectral Data,” U.S. Army Topographic Eng.
Center Publ. TEC-0039, 1993.
[14] Y. Leung, J.S. Zhang, Z.B. Xu, “Clustering by scale-space filtering,”
IEEE Trans. Pattern Anal. Mach. Intell, vol. 22, pp. 1396–1410.
[15] S. Bandyopadhyay, U. Maulik “An evolutionary technique based on K-Means algorithm for optimal clustering in RN,” Inf. Sci., vol. 146, pp.
221–237, 2002.
[16] Ivan De Falco, A.D.C., 2005. Evaluation of Particle Swarm Optimization Effectiveness in Classification. 164–171, 2005
[17] D. Karaboga, C. Ozturk, “A novel clustering approach: Artificial Bee Colony (ABC) algorithm,” Appl. Soft Comput., vol. 11, pp. 652–657, 2000.
[18] J. Senthilnath, S.N. Omkar and V. Mani “Clustering using firefly algorithm: performance study,” Swarm and Evolutionary Computation, vol. 1, no. 3, pp.164 - 171, 2011.
[19] P. Shelokar, V. Jayaraman, B. Kulkarni “An ant colony approach for clustering,” Anal. Chim. Acta, vol. 509, pp. 187–195, 2004.
[20] J. Senthilnath, V. Das, S.N. Omkar, V. Mani “Clustering using Levy Flight Cuckoo Search,” Proc. 7th Int. Conf. Bio-Inspired Computing:
Theories and Applications (BIC-TA 2012), pp. 65–75, 2013.
[21] X.S. Yang “A new metaheuristic bat-inspired algorithm,” Nature
Inspired Cooperative strategies for Optimizations (NISCO 2010),
Springer Berlin Heidelberg, pp. 65-74, 2010.
[22] X.S. Yang, X. He “Bat Algorithm: literature review and applications,” Int. J. Bio-Inspired Computation, vol. 5, no. 3, pp. 141-149, 2013. [23] R. Tang, F. Simon, X.S. Yang, S. Deb, “Integrating Nature-inspired
Optimization Algorithms to K-means clustering”, 7th Int. Conf. Digital
Information Management (ICDIM), Macau, pp. 116-123, 2012
[24] R. Tang, F. Simon, X.S. Yang, S. Deb “Nature inspired Clustering Algorithms for Web Intelligence Data”, IEEE International Conferences on Web Intelligence and Intelligent Agent Technology, Macau, pp. 147-153, 2012
[25] Yang, X.S., Gandomi, A.H., “Bat Algorithm: A Novel Approach for Global Engineering Optimization”. International Journal for Computer Aided Engineering and Software, vol. 29, no. 5, pp. 464-483, 2012.
[26] Kirkpatrick, S., Gelatt, C.D. and Vecchi, M.P., “Optimization by Simulated Annealing”, Science, vol. 220, no. 4598, pp. 671-680, 1983.
[27] Marinakis, Y., Marinaki, M., Doumpos, M., Matsatsinis, N., Zopoundis, C., “A Hybrid Stochastic Genetic-GRASP Algorithm for Clustering Analysis”, Operation Research, vol. 8, pp. 33-46, 2008.