SPACE LAUNCH SYSTEM SCALE MODEL ACOUSTIC TEST
IGNITION OVERPRESSURE TESTING
Donald K. Nance Peter A. Liever
Jacobs ESSSA Group, NASA Marshall Space Flight Center, Huntsville, AL 35812
ABSTRACT
The overpressure phenomenon is a transient fluid dynamic event occurring during rocket propulsion system ignition. This phenomenon results from fluid compression of the accelerating plume gas, subsequent rarefaction, and subsequent propagation from the exhaust trench and duct holes. The high-amplitude unsteady fluid-dynamic perturbations can adversely affect the vehicle and surrounding structure. Commonly known as ignition overpressure (IOP), this is an important design-to environment for the Space Launch System (SLS) that NASA is currently developing. Subscale testing is useful in validating and verifying the IOP environment. This was one of the objectives of the Scale Model Acoustic Test (SMAT), conducted at Marshall Space Flight Center (MSFC). The test data quantifies the effectiveness of the SLS IOP suppression system and improves the analytical models used to predict the SLS IOP environments. The reduction and analysis of the data gathered during the SMAT IOP test series requires identification and characterization of multiple dynamic events and scaling of the event waveforms to provide the most accurate comparisons to determine the effectiveness of the IOP suppression systems. The identification and characterization of the overpressure events, the waveform scaling, the computation of the IOP suppression system knockdown factors, and preliminary comparisons to the analytical models are discussed.
KEY WORDS: ignition overpressure, Space Launch System, computation fluid dynamics, launch vehicles
INTRODUCTION
Subscale testing is useful in validating and verifying the IOP environment. This was one of the objectives of the Scale Model Acoustic Test (SMAT), conducted at Marshall Space Flight Center (MSFC). The test data allowed for the quantification of the effectiveness of the IOP suppression system and provided a means to validate the analytical models used to predict the SLS IOP environments. The reduction and analysis of the data gathered during the SMAT IOP test series required identification and characterization of multiple dynamic events and scaling of the event waveforms to provide the most accurate comparisons to determine the effectiveness of the IOP suppression systems. The identification and characterization of the overpressure events, the waveform scaling, and the computation and verification of the IOP suppression system knockdown factors are discussed. The analytical models used to predict the overpressure environments are discussed and preliminary comparisons of the experimental data and the analytical model results are presented.
Multiple transient events occur during the startup of the solid rocket motors (SRM) for each test in the SMAT IOP test series. Each event produces a complex transient signal and requires
systematically assessing each instrument waveform individually. The events characterized and discussed are the source overpressure (SOP), IOP, and duct overpressure (DOP). IOP water suppression system knockdown factors were determined.
SCALE MODEL ACOUSTIC TEST IOP SERIES
The SLS SMAT was a developmental test program led by the Propulsion Systems Department Fluid Dynamics Branch at MSFC. The primary focus of the SMAT program was the measurement of acoustic and ignition transient pressure data used to inform and improve the analytical models used to predict launch environments. All hot fires during the SMAT program were performed at MSFC East Test Area Test Stand 116.
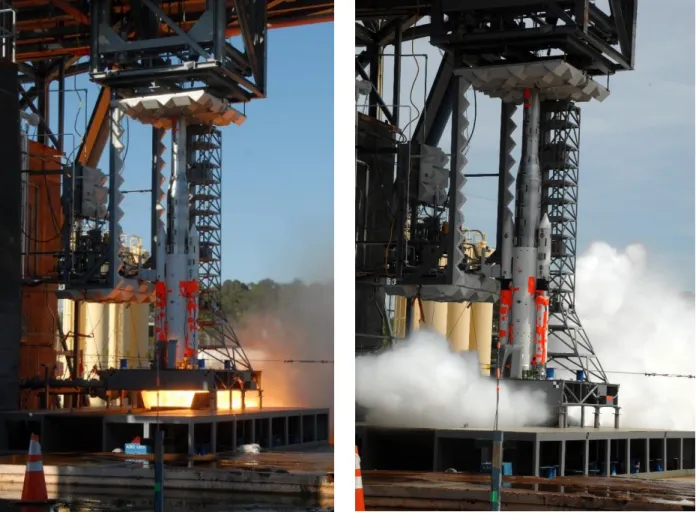
The IOP test portion of the SMAT program consisted of three hot fires of a five-percent scale model of the SLS vehicle and ground support structures. Hot fire 1 (HF-01), shown in Figure 1, was a dry test case (i.e., no water suppression systems were active). HF-02, shown in Figure 2, and HF-03, a repeat of 2, were wet test cases (i.e., all overpressure water suppression systems were active). All IOP series tests were conducted with the vehicle model in the hold-down position. The objectives of the SMAT IOP test series were to obtain data to support the validation and verification of the predicted SLS IOP environments and quantify the effectiveness of the IOP suppression system.
The fully assembled SMAT test article included five-percent scale models of the SLS-10003 launch vehicle and propulsion systems. The ground systems and water sound suppression systems were also modeled at five-percent scale. Two Alliant Techsystems Inc. (ATK) Rocket Assisted Take-Off (RATO) motors were selected to represent the ATK Five-Segment Reusable Solid Rocket Motors (RSRMV) that will be used on the full-scale SLS. The RATO motors required a nozzle extension in order to reach the correct scale nozzle exit diameter. Four liquid oxygen (LOX)/hydrogen thrusters were used to simulate the SLS RS-25 Core Stage engines. Overpressure water sound suppression systems included below-deck exhaust hole water suppression and launch pad trench main flame deflector water suppression. A total of 83 pressure sensors were installed on the SMAT model during the IOP test series to measure and characterize the ignition transients. The sensors were located on different portions of the SMAT test article: 34 on the vehicle model and 49 on the modeled ground support structures. Additional instrument was utilized to measure RATO motor and liquid engines performance, water flow rates, and ambient environmental conditions.
SMAT OVERPRESSURE DATA REDUCTION AND ANALYSIS
The reduction and analysis of the data gathered during the SMAT IOP test series required identification and characterization of multiple dynamic events and scaling of the event waveforms to provide the most accurate comparisons to determine the effectives of the IOP suppression systems. The identification and characterization of the overpressure events, the waveform scaling, and the computation of the IOP suppression system knockdown factors are discussed below.
Identification and Characterization of Overpressure Events
A detailed explanation of the ignition transient characterization and physical mechanism by which the waveform is generated is provided by Casiano (Casiano, et al. 2013). The excerpt below briefly explains the generation and propagation of the three primary overpressure events—SOP, IOP, and DOP.
In general, an igniter starts the burning process of an SRM. Subsequently, there is an abrupt change in pressure inside the motor from its original ambient pressure to its final steady state pressure. This abrupt change in pressure corresponds to an abrupt change in flow through the nozzle. The fluid compression due to the accelerating plume gas causes an increase in pressure at a location within the plume. This location is classically regarded as the apparent source. In a simplified sense, pressure waves will propagate from the apparent source within the flame trench as the SOP, out the flame trench as the DOP, and up out of the exhaust duct as the IOP.
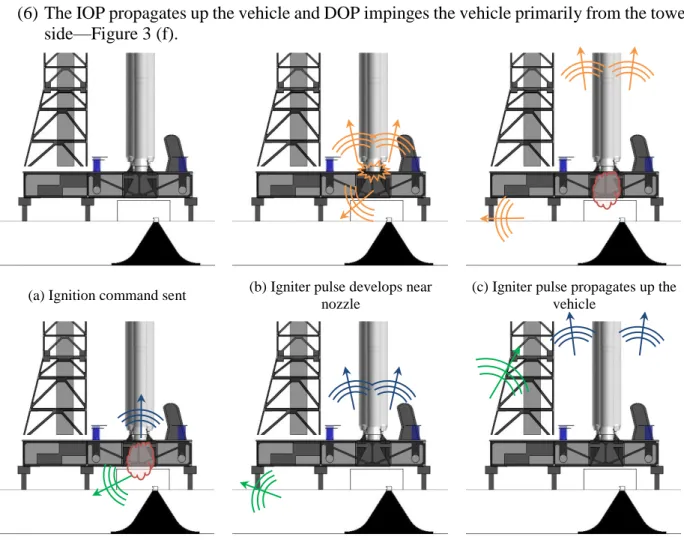
A series of snapshots illustrating instants during the transient events for each of the SMAT IOP series tests is provided in Figure 3. The following evolution of steps transpires:
(1) The fire command is sent and the initiator ignites the propellant—Figure 3 (a). (2) The igniter pulse exits the nozzle—Figure 3 (b).
(3) The igniter pulse begins to propagate up the vehicle as the plume gas accelerates out of the nozzle—Figure 3 (c).
(4) The SOP develops first as the apparent source and propagates through the flame trench and exhaust duct—Figure 3 (d).
(5) The IOP propagates out of the exhaust duct and the DOP propagates out of the flame trench exit—Figure 3 (e).
(6) The IOP propagates up the vehicle and DOP impinges the vehicle primarily from the tower side—Figure 3 (f).
(a) Ignition command sent (b) Igniter pulse develops near nozzle
(c) Igniter pulse propagates up the vehicle
(d) SOP develops (e) IOP and DOP propagate out exhaust duct and trench
(f) IOP and DOP impinge along the vehicle
Figure 3: Illustration of the SMAT ignition transient sequence.
A few example measurements are chosen to provide a reference for the identification of the ignition transient events. The time histories shown in Figure 4 are filtered to represent the same scaled frequency content that would be present in the SLS vehicle up to 100 Hz. The determination of the appropriate model scale frequency filtering is later discussed in the Frequency Scaling section. Note that the amplitude scales are not the same for all plots, but the time scales are identical. The measurement locations for the waveforms shown in Figure 4 are illustrated in Figure 5.
The earliest evidence of an overpressure waveform was measured near the bottom of the exhaust duct. This occurrence is termed the SOP waveform and shown in Figure 4 (a). Instruments near the bottom of the exhaust duct experiencing the SOP waveform exhibited some of the highest measured overpressure amplitudes. The SOP waveform propagated through the trench (primarily on the tower side due the positioning of the exhaust nozzles on the tower side of the deflector) and reached the trench exit as the DOP waveform. The earliest measurement of the DOP waveform is
shown in Figure 4 (b). The SOP waveform propagated through and exited the top of the exhaust duct as the IOP waveform. The IOP waveform is shown in Figure 4 (c).
Figure 4: Waveform event timing and identification: (a) SOP, (b) DOP, and (c) IOP.
The overpressure waveforms behaves proportionally to the chamber pressure rise rate, hence, the determination of this parameter was important in defining
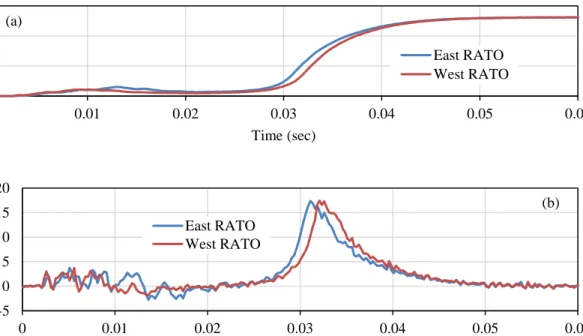
the timing, location, and distribution of the overpressure source. The procedure used to determine the chamber pressure rise rate is provided later in the Chamber Pressure Rise Rate Estimation section. Figure 6 shows the abrupt change in chamber pressure over the short durations for each RATO for HF-01 in the SMAT IOP series. Further chamber pressure and chamber pressure rise rate results are provided in the Chamber Pressure Rise Rate Estimation section.
The approximate extent of each overpressure event is indicated by the colored windows in Figure 4. The selection of the windows were informed via CFD analysis and the calculated chamber pressure rise rate for each SMAT IOP series test. The windows were slid based on
-2 0 2 4 6 0 0.01 0.02 0.03 0.04 0.05 0.06 0.07 0.08 0.09 0.1 P ress u re (p si) SOP Window Igniter Window -2 -1 0 1 2 0 0.01 0.02 0.03 0.04 0.05 0.06 0.07 0.08 0.09 0.1 P ress u re (p si) DOP Window Igniter Window -2 -1 0 1 2 0 0.01 0.02 0.03 0.04 0.05 0.06 0.07 0.08 0.09 0.1 P ress u re (p si) Time (sec, T0 = 0.0) IOP Window Igniter Window (a) (b) (c)
Figure 5: Measurement locations for the data in Figure 4.
the necessary point-to-point propagation time needed for the wave to propagate to each measurement. The overpressure events were then identified at a multitude of appropriate measurement locations along the SMAT model.
Figure 6: Representative abrupt change in chamber pressure: (a) chamber pressure and (b) chamber pressure rise rate.
Chamber Pressure Rise Rate Estimation
Due to the importance of the chamber pressure rise rate in determining the timing, location, and distribution of the overpressure source and the lack of an accurate direct motor internal pressure measurement, a detailed procedure was needed to determine the chamber pressure and rise rate. Lessons learned during Ares I Scale Model Acoustic Test (ASMAT) prove that direct measurement of the motor internal pressure inside the igniter chamber (the only feasible location for such a measurement within the RATO architecture) is inaccurate for much of the ignition transient (Casiano, et al. 2013). A consistent, repeatable procedure to estimate the RATO chamber pressure and provide smoothing pressure rise rate curves was developed during the ASMAT program. For SMAT, this method requires the measurement of case hoop strain along each RATO coupled with the indirect use of the igniter pressure measurement to determine the appropriate steady state chamber pressure. Four strain gages were placed around the aft section of each RATO near the head-end of the motor. The strain gages provided very good transient stresses of the motor casing and were used to simulate the chamber pressure. The following step-by-step procedure was used to estimate the chamber pressure rise rate:
(1) Zero the sensors: Average the strains and igniter pressures individually from a time of – 0.875 to –0.125. Subtract this value from the associated data trace. Call it the zero-removed raw data.
(2) Combine the igniter pressure and record the steady state peak chamber pressure: Average the two igniter pressure curves and choose the peak chamber pressure just after the start
0 500 1000 1500 0 0.01 0.02 0.03 0.04 0.05 0.06 P ress u re (p sig ) Time (sec) East RATO West RATO -5 0 5 10 15 20 0 0.01 0.02 0.03 0.04 0.05 0.06 C h am er P ress u re R is e R ate (p si/s ec ) x 1 0 0 0 0 Time (sec) East RATO West RATO (b) (a)
transient. Take this value as the peak chamber pressure and record the point in time where this occurs.
(3) Obtain scale multipliers: Take the peak chamber pressure from the previous step and divide it by the values at that same point in time for and all four strain values. This should give four multipliers that should be associated with the four data traces.
(4) Obtain scaled curves: Take the zero-removed raw data and multiply it by the appropriate multiplier.
(5) Obtain the representative steady state peak chamber pressure: Average the four scaled strain curves together and choose the peak chamber pressure. This is the representative steady state peak chamber pressure.
(6) Obtain the final rise rate curve: Average the four scaled chamber pressure curves together and then calculate the derivative.
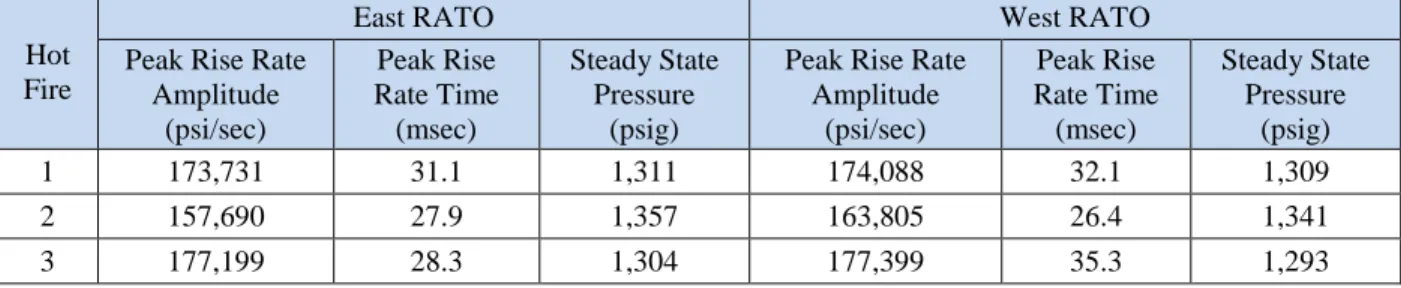
The results of the chamber pressure estimation procedure for HF-01 are shown in Figure 6. The resulting peak rise rate amplitude and time of occurrence and the steady state chamber pressure for each RATO for each test are provided in Table 1.
Table 1: Chamber pressure rise rate estimations for SMAT hot fires 1, 2, and 3. Hot
Fire
East RATO West RATO Peak Rise Rate
Amplitude (psi/sec) Peak Rise Rate Time (msec) Steady State Pressure (psig)
Peak Rise Rate Amplitude (psi/sec) Peak Rise Rate Time (msec) Steady State Pressure (psig) 1 173,731 31.1 1,311 174,088 32.1 1,309 2 157,690 27.9 1,357 163,805 26.4 1,341 3 177,199 28.3 1,304 177,399 35.3 1,293 WAVEFORM SCALING
The well-documented and well-understood transient pressure scaling method of Broadwell and Tsu (Broadwell and Tsu 1961, 1967) coupled with solid rocket motor physics allows for the scaling of model-scale data to the conditions expected at full-scale. Relationships for scaling both frequency and amplitude to full-scale are provided within the methodology. For the purpose of the analysis present in this paper, the amplitude scaling theory is only used to account for differences in motor-to-motor ballistics to aid in determination of knockdown factors between subscale tests. Additionally, the frequency scaling is used to ensure that the appropriate subscale frequency bandwidth is chosen to correctly scale to a full-scale environment.
In general, two configurations—termed 𝑥 and 𝑦 herein—are scaled. The frequency scaling relationship is determined by considering the characteristic frequency during the ignition transient. The frequency scaling factor is directly proportional to the ignition action time, 𝑇𝑜, and can be written as:
𝑓𝑥𝑇𝑜,𝑥 = 𝑓𝑦𝑇𝑜,𝑦
The amplitude and ballistics scaling is determined by considering the Broadwell and Tsu overpressure theory. The scaling relationship for separate configurations that have geometrically scaled geometries, and different motor performance and ballistics, can be written as:
𝑃𝑥+(
𝑃̅𝑥
𝐷𝑥𝑃̇𝑥) = 𝑃𝑦+( 𝑃̅𝑦
𝐷𝑦𝑃̇𝑦) 𝐾𝐹 (2)
In this scaling relationship, the thermodynamics and nozzle exit velocities are assumed to be similar. Equation (2) additionally contains a knockdown factor, 𝐾𝐹, where configuration 𝑦 contains some type of suppression system. The overpressure peak is represented by 𝑃+, the steady state chamber pressure is 𝑃̅, the chamber pressure rise rate is 𝑃̇, and the effective duct diameter at the overpressure source is 𝐷. The peak rise rate is chosen for the chamber pressure rise rate, 𝑃̇, for consistency but also because this would generate the peak overpressure value.
Frequency Scaling
Frequency scaling is used to determine the low-pass filter model-scale cutoff frequency that corresponds to the desired full-scale overpressure cutoff frequency. Considering the ignition action time in terms of the performance and ballistics parameters (i.e., 𝑇𝑜= 𝑃̅ 𝑃̇⁄ ), equation (1) can rewritten as:
𝑓𝑆 = 𝑃̇𝑆 𝑃̇𝐹
𝑃̅𝐹
𝑃̅𝑆𝑓𝐹 (3)
The subscripts 𝑆 and 𝐹 indicate the subscale and full-scale configurations, respectively. For the analysis detailed in this document, the full-scale overpressure cutoff frequency of interest was 100 Hz. The full-scale motor performance
parameters were obtained from the five-segment reusable SRM demonstration motor number 1 (RSRMV-DM1) data. The calculated subscale cutoff frequency and motor performance characteristics for each RATO motor for each SMAT IOP series test are shown in Table 2.
Prior to the post-test data reduction, the
subscale data were filtered using a Chebyshev type-II IIR low-filter. As stated earlier the subscale cutoff frequency limits for each RATO motor corresponding to a full-scale cutoff frequency of 100 Hz were determined; however, in order to simplify the analysis a common subscale cutoff frequency of 1500 Hz was used for all data sets. The implications of the use of this common subscale cutoff frequency are minor in terms of the subsequent data reduction because the amplitude contribution at higher frequencies is very small and does not make an appreciable difference in the resulting amplitude.
Rocket-Assisted Take-Off Motor Ballistics Scaling
In order to accurately compare the subscale tests and evaluate the effectiveness of the IOP suppression system scaling of the motor-to-motor ballistics is required. Minor, but non-negligible, differences in the ballistics between each motor do not allow for direct comparison of the measured
Table 2: Subscale cutoff frequency at 100 Hz full-scale.
Hot Fire
East RATO Cutoff Frequency (Hz, based on RSRMV-DM1)
West RATO Cutoff Frequency (Hz, based on RSRMV-DM1) 1 1,433 1,438 2 1,256 1,320 3 1,304 1,482
overpressure environment. The overpressure physics described in the amplitude scaling equation (2) can be directly applied to address motor-to-motor discrepancies. When applying equation (2) in this case, it should be noted that both configurations 𝑥 and 𝑦 are subscale and the geometries are identical; thus the effective diameters are equal (i.e., 𝐷𝑥 = 𝐷𝑦). With these considerations equation (2) can be rewritten as:
𝑃𝐴+(𝑃̅𝐴
𝑃̇𝐴
) = 𝑃𝐵+(𝑃̅𝐵
𝑃̇𝐵
) 𝐾𝐹 (4)
The subscripts in equation (4) are changed to represent two subscale configurations, 𝐴 and 𝐵. A one-to-one comparison of the data can be made upon determining the ballistics factor. The ballistics factor essentially accounts for the rise rate and performance differences between the motors so that a direct comparison of data can be made in determining the knockdown factor in order to evaluate the effectiveness of the IOP suppression system. To find the ballistics factor, a knockdown factor should first be defined as:
𝐾𝐹 ≡ 𝑃𝐴+
𝑃𝐵,𝑐+ (5)
The variable 𝑃𝐵,𝑐+ is the corrected peak overpressure for configuration 𝐵. A ballistics factor for configuration 𝐵 can then also be defined as:
𝐵𝐹𝐵≡ 𝑃𝐵,𝑐
+
𝑃𝐵+ (6)
This is the ratio of the corrected amplitude to the actual peak overpressure amplitude from the data. Substituting equation (6) into equation (5), and then substituting the result into equation (4) yields:
𝐵𝐹𝐵 = 𝑃̅𝐵 𝑃̅𝐴
𝑃̇𝐴
𝑃̇𝐵 (7)
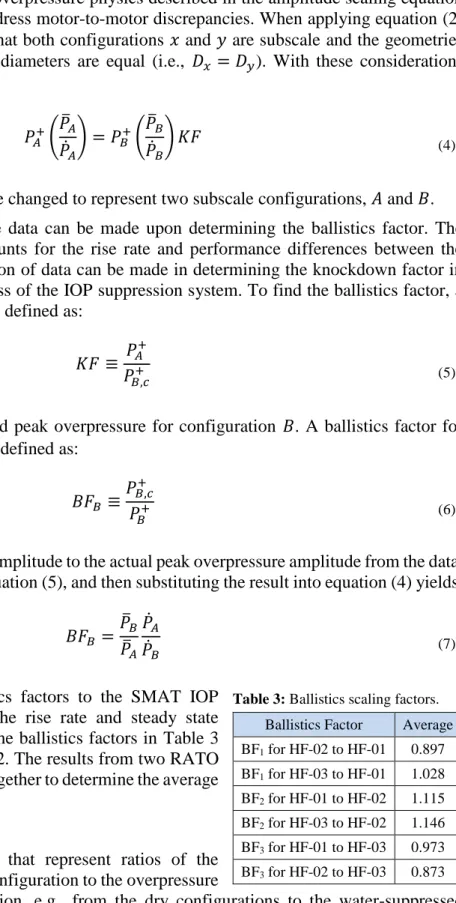
The average test-to-test ballistics factors to the SMAT IOP series are provided Table 3. The rise rate and steady state pressure data used to calculate the ballistics factors in Table 3 are shown in Table 1 and Table 2. The results from two RATO motors in each test are average together to determine the average ballistics factor.
KNOCKDOWN FACTORS
Knockdown factors are values that represent ratios of the overpressure amplitude in one configuration to the overpressure
amplitude in another configuration, e.g., from the dry configurations to the water-suppressed configurations. The zero-to-peak amplitude is commonly used to calculate the knockdown factor, but in more complex waveforms, peak-to-peak amplitudes may also be used. When calculating the
Table 3: Ballistics scaling factors. Ballistics Factor Average BF1 for HF-02 to HF-01 0.897 BF1 for HF-03 to HF-01 1.028 BF2 for HF-01 to HF-02 1.115 BF2 for HF-03 to HF-02 1.146 BF3 for HF-01 to HF-03 0.973 BF3 for HF-02 to HF-03 0.873
knockdown factor, careful evaluation is needed in order to account for motor-to-motor differences. It should be noted that droplet size and droplet survival distance have been shown to be inconsequential in regards to the scaling of knockdown factors from subscale to full scale architectures (Williams et al. 2014); thus the scaling of the knockdown factors provided herein from SMAT to SLS is one-to-one.
The average ballistics factors described in the previous section can be applied directly to the data to provide a one-to-one comparison of the results in calculating the knockdown factor. Because they are calculated on an individual test-to-test basis they can be directly applied when calculating the knockdown factors rather than generating entirely new sets of corrected data by using a single reference motor. Combining equations (5) and (6), the knockdown factor can be calculated as follows:
𝐾𝐹 = 𝑃𝐴
+
𝑃𝐵+𝐵𝐹
𝐵 (8)
The knockdown factor is calculated where typically configuration 𝐵 has more IOP suppression than configuration 𝐴.
Figure 7 shows zero-to-peak knockdown factors comparing the dry configuration (HF-01) to the water suppression configurations (HF-02 and -03) for instrument heights along the vehicle model as measured from the nozzle exit plane (NEP). Measurements along the SLS vehicle model Core and the RATO motor casings are indicated by the squares and circles, respectively. The averages for the measurements on the mobile launcher (ML), exhaust duct (ED), trench (LPT), and tower (T) are also shown. The knockdown factors computed comparing HF-01 to HF-02 are shown in red, while those comparing HF-01 to HF-03 are shown in black. As shown in Figure 7, the knockdown factors resulting from the use of IOP water suppression system compare quite well along the vehicle model. The average zero-to-peak knockdown factor along the vehicle model for 01-to-02 is 2.0, and the average for 01-to-03 is 2.4.
Figure 7: Water suppression knockdown factors.
The historic water suppression curve is shown Figure 8 (Jones, et al. 1994). The original curve and data are plotted in black. The value computed from the results of ASMAT (Casiano, et al. 2013) is shown in purple. The SLS baseline is represented by the light blue circle. The computed SMAT values are shown in red (01-to-02) and orange (01-to-03). The SMAT data were estimated by
0.0 1.0 2.0 3.0 4.0 5.0 6.0 7.0 -100 -50 0 50 100 150 200 Kn o ck d o w n Facto r
Distance Along the SMAT Model (from NEP, inches)
01-to-02 Core 01-to-02 RATO 01-to-03 Core 01-to-03 RATO
averaging the zero-to-peak knockdown factors along the length of the vehicle model. The values computed from the SMAT data compare well with the SLS baseline prediction.
Figure 8: Water suppression curve.
The results presented above serve as verification of the knockdown factors included in the ignition overpressure environment provided in the SLS baseline documentation. The data presented in Figure 7 and Figure 8 show that the IOP suppression system is effective (to the extent predicted for SLS) in knocking down the amplitude of the overpressure events. The IOP suppression system is effective over the entire pad, tower, and vehicle.
COMPUTATIONAL FLUID DYNAMICS SIMULATION OF SMAT HOT FIRE 1
The SMAT overpressure data presented herein will, in part, be used to validate the computational fluid dynamics (CFD) models used to derive the ignition overpressure environment provided in the SLS baseline documentation. Preliminary comparisons of the experimental and simulated results for SMAT HF-01 are presented and discussed. The CFD model generation and CFD simulation results used in the validation against SMAT experimental data are documented. The CFD simulation was performed to validate against the SMAT test HF-01. Test HF-01 was the first SMAT full assembly hot fire test at the hold down position with the sound suppression water injection systems turned off. The dry configuration serves as a suitable fundamental validation case focusing on the plume flow modeling validation in the absence of complex two-phase flow effects resulting from deluge water application.
SMAT test data were applied in the validation of CFD modeling of the ignition transient environment. Lessons learned from previous CFD modeling and validation against ASMAT tests provided a solid foundation for best practices in CFD model generation, transient boundary condition implementation, and optimum simulation execution parameters (Casiano, et al. 2013). Simulating the SMAT plume flow environment requires appropriate computational models of the transient gas flow building up and exiting through the respective liquid and solid nozzles. Proper computational modeling of the liquid thruster plume flow was established in preparatory CFD modeling development tasks (Nielsen 2014, 2015). The most important of these initial model development activities was the implementation of appropriate resolution of the plume structure and dynamics, and, in particular, the transient solid motor nozzle inflow conditions that had to be
0 0.2 0.4 0.6 0.8 1 1.2 0 0.2 0.4 0.6 0.8 1 1.2 1.4 1.6 p '[ w ater ] / p '[ w ith o u t w ater ]
Water Injection Ratio (w[water] / w[propellant])
Original Curve Fit 40,000 gpm (Test 10) 50,000 gpm (Test 41) 70,000 gpm (Test 12) 75,000 gpm (Test 42) 100,000 gpm (Test 35) 105,000 gpm (Test 21) ASMAT Measured SLS Baseline SMAT 01-to-02 SMAT 01-to-03
extracted and approximated from limited RATO motor internal ballistics transient information (Casiano, et al. 2013). With all prerequisite computational modeling components in place, a full SMAT configuration ignition sequence simulation and validation against SMAT experimental data was performed to assess the validity and accuracy of the CFD modeling approach.
CFD Model
Loci/CHEM is the workhorse CFD analysis program applied by the MSFC Fluid Dynamics Branch. The Loci computational framework was originally developed in the late 1990s with the goal of simplifying the development of complex numerical models that can take advantage of massively parallel high end computing systems such as the NASA Ames NAS (Luke 2005). Loci/CHEM is a generalized unstructured mesh density-based Navier-Stokes solver implementation in the Loci framework employing high-resolution approximate Riemann solvers for complex multi-physics simulations with multi-component mixing and chemically reacting flows (Luke 2007). Loci/CHEM supports multiphase simulations of dispersed liquid and solid particulates using both Lagrangian and Eulerian approaches. The program contains a variety of turbulence modeling options including RANS, hybrid RANS/LES, and DES turbulence models essential for modeling liftoff plume environments. Loci/CHEM numerical models have been verified to be at least second order accurate in space and time through rigorous verification using the Method of Manufactured Solutions (MMS) (Veluri, Roy and Luke 2010). A detailed documentation of the modeling and numerical approaches may be found in the Loci/CHEM user manual (Luke, Tong, et al. 2014).
Continuing improvements in CFD simulation capability and fidelity with Loci/CHEM in the MSFC Fluid Dynamics Branch have enabled CFD modeling of complete launch vehicles liftoff configurations with multiple plumes interacting with detailed launch pad geometric models. Time accurate simulations applying hybrid RANS/LES modeling are capable of capturing the sources of acoustic waves originating from the plumes and the plume interaction with the facility structures. Advanced multi-phase modeling capabilities such as the injection of deluge water in the CFD model have been added recently that enable the assessment of deluge water in affecting the acoustic source regions. These capabilities now offer the possibility of analysis support for the design of the launch pad and targeted placement of water injection systems (West, et al. 2012). These analyses have become routine in defining liftoff environments supporting design analysis cycles of the new Space Launch System (SLS) heavy lift launch vehicle (Strutzenberg and Liever 2011).
The CFD modeling of the acoustic environments due to solid rocket motor ignition transients has been successfully validated against scaled acoustic tests such as ASMAT and SMAT, providing confidence that CFD models of this class are capable of capturing the sources of acoustic waves originating from the plumes and the plume interaction with the launch pad structures (Putnam and Strutzenberg 2011, Casiano, et al. 2013).
CFD Pressure Probe Results
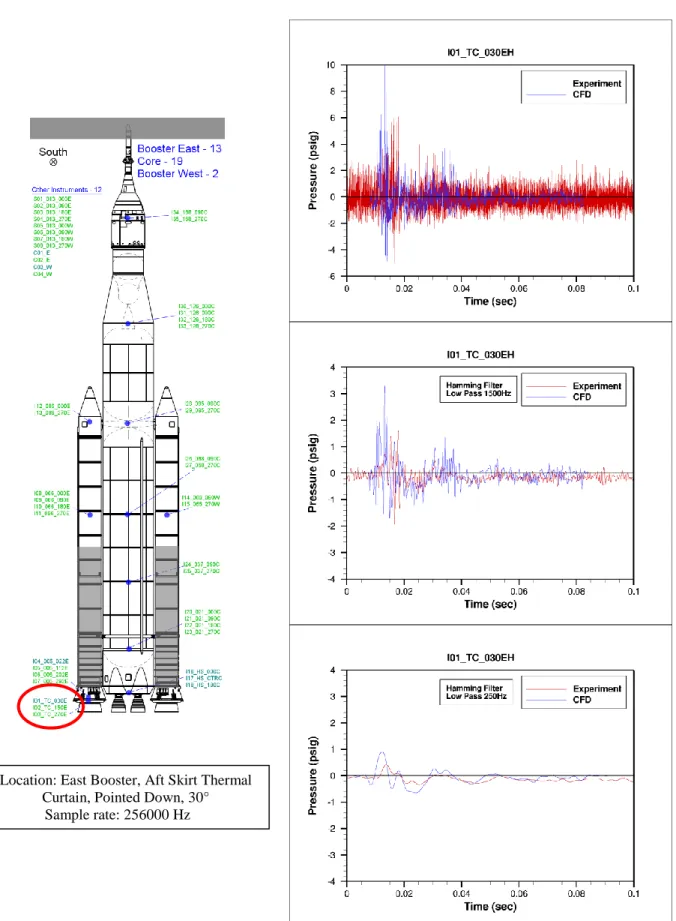
The SMAT test was equipped with numerous pressure sensors on the vehicle and the launch pad components. The CFD model was equipped with probe points at the respective sensor locations. Data was sampled at those probe locations at every time step during the CFD simulation, resulting in a sample rate of 1,000,000 Hz. The sensors on the test featured two sample rates, at 4,000 Hz and 256,000 Hz. The following series of figures presents the comparison of the pressure probe data form the CFD simulation and against the test data. Each comparison is presented in three plots for the raw data and two filtered data sets with low pass filters of 1,500 Hz and 250Hz.
The pressure signals were investigated at locations spanning the length of the vehicle model and tower, inside the exhaust duct, on the mobile launcher deck, and within the exhaust trench. A few selected computational probes and corresponding measurements along the vehicle model and tower are compared and discussed below. The comparison and discussion of the remainder of the pressure probes will be the topic of a future paper.
Figure 9 shows a representative probe/measurement comparison located at the downward facing aft end sections of the vehicle model. The rapid bulk mass flow ramp-up boundary condition profile induces a strong pressure wave filling the nozzle followed by an expansion as the nozzle settles on a the igniter mass flow plateau. The number of peaks and valleys resulting from the slightly staggered igniter pulses from the two motors is captured correctly. The low pass filtered signals resulting at the booster and core base probe locations indicate that the boundary condition imposes considerably higher peak values in over-and under-pressure of the waves resulting from the igniter mass flow pulse. The CFD predicted waves further arrive slightly early by approximately 2 milliseconds compared to the measured data. This indicates that the time profile at the RATO nozzle inflow boundary location which was correlated to the chamber pressure computed slightly upstream from the nozzle in the RATO chamber requires an appropriate time delay.
The amplification in the CFD over- and under-pressure peaks from the igniter pulse ramp-ups most likely results from the imposition of a plug-like bulk mass flow wave propagating through the nozzle. The polynomial fit of the ramp-up was designed to mimic the initiation of mass flow commencing when the throat plug breaks. The plug break-up process in reality is not instantaneous and the presence of plug debris in the flow will likely result in a more moderate ramp-up gradient in the mass flow through the nozzle. Improvements in the boundary condition are expected from ongoing work to extract higher fidelity time-dependent flow conditions directly from an internal RATO motor CFD simulation of the ignition process. It is positive that the model applied errs on the conservative side with the CFD boundary condition resulting in a simulation scenario with higher amplitude signals than measured in the test series.
Pressure probes along the vehicle model are shown in Figure 10 through Figure 13. These locations give an indication of the propagation and attenuation of the IOP signals farther away from the source regions. Ignition over-pressure waves arrive at the various locations on the vehicle in the time frame after t=0.030 sec and DOP waves arrive closer to t=0.060 sec. As was observed at locations at the aft skirt and core base closer to the over-pressure sources, the igniter pulse signal amplitudes are larger and the CFD signals arrive earlier by approximately 2 milliseconds due to the CFD boundary condition construct. The occurrence of all wave events (Igniter Pulse, IOP, and DOP) is captured and properly propagated by the CFD solution.
Comparison of the CFD data with the test measurements for locations on the tower at levels 30, 100, 200, and 285 are shown in Figure 14 through Figure 17. As with the sensor locations on the vehicle, the CFD predicted waves arrive approximately two milliseconds early and the igniter mass flow boundary condition induces considerable over- and undershoots in the time before 0.030 sec. Good agreement exists in capturing the later arriving IOP and DOP wave features in both, amplitude and phase.
Figure 9: Pressure values at probe I01_TC_030EH. Location: East Booster, Aft Skirt Thermal
Curtain, Pointed Down, 30° Sample rate: 256000 Hz
Figure 10: Pressure values at probe I23_021_270C. Location: Core/C3-1/270°
Figure 11: Pressure values at probe I29_095_270C. Location: Core/C4/270°
Figure 12: Pressure values at probe I33_126_270C. Location: Core/P1/270°
Figure 13: Pressure values at probe I35_168_270C. Location: Core/P4/270°
Figure 14: Pressure values at probe I37_019_T02H. Location: Tower/Trench Side/Level 30
Figure 15: Pressure values at probe I39_061_T04. Location: Tower/Trench Side/Level 100
Figure 16: Pressure values at probe I41_121_T06. Location: Tower/Trench Side/Level 200
Figure 17: Pressure values at probe I43_171_T08H.
Location: Tower/Trench Side/Level 285 Sample rate: 256000 Hz
CONCLUSION
SMAT ignition overpressure testing has served as sufficient verification of the water sound suppression systems knockdown factors for the ignition transient phenomenon. The data presented herein show that the IOP suppression system is effective in reducing the amplitude of the ignition transient event to the extent predicted for the SLS launch architecture. Furthermore, SMAT testing has proved useful in validating the analytical models used to predict the SLS overpressure environments; and thus, verifying the predicted SLS overpressure environment.
REFERENCES
Broadwell, J., and C. Tsu. 1961. An Analysis of Transient Pressures due to Rocket Starting in Underground Launchers. Report 7103-0028-MU-000, Los Angeles: Space Technology Laboratories, Inc.
Broadwell, J., and C. Tsu. 1967. "Transient Pressures Caused by Rocket Start and Shutdown in Ducted Launchers." Journal of Spacecraft and Rockets 4 (10): 1323-1328.
Casiano, M., D. McDaniels, D. Alvord, and G. Putnam. 2013. "Ares I Scale Model Acoustic Test (ASMAT) Overpressure Final Analysis Report." NASA TP 2013-217478.
Jones, J., S. Guest, T. Nesman, J. Matienzo, and D. Reed. 1994. "Acoustic, Overpressure and Unsteady Flow Phenomena associated with Saturn/Space Shuttle Systems: A Review of Selected Issues." International Conference on Acoustic and Dynamic Environment of Space Transportation Systems. Chatillon, France.
Luke, E. 2005. "Loci: a rule-based framework for parallel multi-disciplinary simulation synthesis." Journal of Functional Programming 15 (3): 477-502.
Luke, E. 2007. "On robust and accurate polytype CFD solvers." 18th AIAA Computational Fluid Dynamics Conference. Miami: AIAA 2007-3956.
Luke, E., X. Tong, J. Wu, P. Cinnella, and R. Chamberlain. 2014. "CHEM 3.3: A fineite-rate Viscous Chemistry Solver - The User Guide."
Nielsen, T. 2014. "Computational Fluid Dynamics Model Parameter Assessment of a 5% Scale RS-25 Thruster Simulation." ESSSA-FY14-1185.
Nielsen, T. 2015. "Computational Fluid Dynamics Study on the Effects of Ignition Timing on the Scale Model Acoustic Test." ESSSA-FY15-9.
Putnam, G., and L. Strutzenberg. 2011. "Simulation of acousitcs for the Ares I scale model acoustis test." Journal of the Acoustical Society of America 130 (4): 2543.
Strutzenberg, L., and P. Liever. 2011. "Hybrid Computational Fluid Dynamics and
Computational Aero-acoustic Modeling for Liftoff Acoustic Predictions." Journal of the Acoustical Society of America 130 (4): 2534.
Veluri, S., C. Roy, and E. Luke. 2010. "Comprehensive Code Verification for an Unstructured Finite Volume CFD Code." 48th AIAA Aerospace Sciences Meeting Including the New Horizons Forum and Aerospace Exposition. Orlando: AIAA 2010-127.
West, J., L. Strutzenburg, G. Putnam, P. Liever, and B. Williams. 2012. "Development of Modeling Capabilities for Launch Pad Acoustics and Ignition Transient Environments Prediction." 18th AIAA/CEAS Aeroacoustics Conference (33rd AIAA Aeroacoustics Conference). Colorado Springs, CO: AIAA 2012-2094.
Williams, B., P. Davis, G. Putnam, and H. Tang. 2014. "Input for Space Launch System Scale Model Acoustic Test Review." ESSSA-FY14-01944.