2008
Energy efficiency enhancements to a low energy
high performance building
Joel Clifton Logan
Iowa State UniversityFollow this and additional works at:https://lib.dr.iastate.edu/rtd
Part of theEnergy Systems Commons,Oil, Gas, and Energy Commons, and thePower and Energy Commons
This Thesis is brought to you for free and open access by the Iowa State University Capstones, Theses and Dissertations at Iowa State University Digital Repository. It has been accepted for inclusion in Retrospective Theses and Dissertations by an authorized administrator of Iowa State University Digital Repository. For more information, please contactdigirep@iastate.edu.
Recommended Citation
Logan, Joel Clifton, "Energy efficiency enhancements to a low energy high performance building" (2008).Retrospective Theses and
Dissertations. 14920.
by
Joel Clifton Logan
A thesis submitted to the graduate faculty
in partial fulfillment of the requirements for the degree of MASTER OF SCIENCE
Major: Mechanical Engineering Program of Study Committee: Michael B. Pate, Co-major Professor
Ron M. Nelson, Co-major Professor J. Adin Mann
Iowa State University Ames, Iowa
2008
1453054 2008
Copyright 2008 by Logan, Joel Clifton
UMI Microform Copyright
All rights reserved. This microform edition is protected against unauthorized copying under Title 17, United States Code.
ProQuest Information and Learning Company 300 North Zeeb Road
P.O. Box 1346
Ann Arbor, MI 48106-1346 All rights reserved.
Table of Contents
List of Tables
v
List of Figures
viii
List of Nomenclature
xii
Acknowledgements
xiv
Abstract
xv
Chapter 1.
Introduction
1
1.1. Problem Definition 2
1.2. Goals and Objectives 4
1.3. Report Organization 5
Chapter 2.
Literature Review
7
2.1. Introduction 7
2.2. United States’ Building Energy Use Statistics 7 2.3. Definitions of ‘High Performance Building’, ‘Green Building’, and
‘Sustainable Building’ 11
2.3.1. Definition of ‘Good’ Design 11
2.3.2. Definition of ‘High Performance’ Building 12
2.3.3. Definition of ‘Sustainable’ and ‘Green’ Building 12
2.4. Net Zero Energy Building 15
2.4.1. Definitions of Net Zero Energy Buildings 15
2.4.2. Technical Potential of Zero Energy Buildings 18
2.5. Low Energy Building Design and Monitoring 18
2.5.1. Design Guidelines 19
2.5.2. Design Optimization 21
2.5.3. Building Monitoring and Comparisons 25
2.6. Low Energy Building Case Studies 28
2.6.1. Science House 28
2.6.3. Jack Evans Police Headquarters 30
2.6.4. Zuckerman Building 31
2.6.5. BigHorn Home Improvement Center 32
2.6.6. Montreal Retail Store 33
2.6.7. Energy Star Homes 34
Chapter 3.
The IAMU’s Headquarters
36
3.1. IAMU Introduction 36
3.2. Integrated Building Design 39
3.3. Building Systems 41
3.3.1. Envelope 41
3.3.2. Daylighting and Lighting Controls 43
3.3.3. Ground Source Heat Pumps 45
3.3.4. Energy Recovery Ventilator 48
3.4. Energy Efficiency Enhancement Cost Premiums 49
Chapter 4.
IAMU Building Monitoring
52
4.1. Introduction 52
4.2. Data Acquisition System 52
4.3. Building Monitoring Strategy 56
4.4. Whole Building Energy Performance 59
Chapter 5.
Experimental
68
5.1. Introduction 68
5.2. Ground Source Heat Pump Circulating Pump 70
5.2.1. GSHP System Overview 71
5.2.2. GSHP Circulating Pump Operation and Energy Performance 79
5.2.3. GSHP Circulating Pump System Changes 93
5.2.4. GSHP Circulating Pump Energy Performance Improvements 103
5.3. Energy Recovery Ventilator Defrost Heater 114
5.3.1. ERV Defrost Heater System Operation 114
5.3.3. ERV Defrost Heater Energy Performance Improvements 121
5.4. Unoccupied General Equipment Loads 130
5.4.1. General Equipment Description 130
5.4.2. Unoccupied Hours General Equipment Energy Performance 131
5.4.3. General Equipment Energy Performance Improvements 136
Chapter 6.
Conclusion
141
Appendix A.
DOE-2 Modeled Energy Efficiency Strategies
152
Appendix B.
IAMU Data Acquisition Points List
154
Appendix C.
Thermostat Set Points
159
Appendix D.
Heat Pump Runtime Analysis MATLAB Code
162
Appendix E.
Heat Pump Binned Runtime
175
Appendix F.
IAMU Electric Rates
181
Appendix G.
Energy Savings from Circulating Pump VFD
182
Appendix H.
Defrost Heater Energy Analysis MATLAB Code
183
Appendix I.
General Equipment Load Breaker Schedule
190
List of Tables
Table 2.1. U.S. commercial and residential building primary energy use (DOE
2007). 8
Table 2.2. Commercial building primary energy end uses (DOE 2007). 9
Table 2.3. Comparison of the 2003 energy use intensity for various commercial
buildings between the average for the U.S. and Climate Zone 2(EIA
2006). 10
Table 2.4 Building energy performance metrics (Barley et al. 2005). 27
Table 3.1. Glazing properties. (Klaassen, et al. 2006) 42
Table 3.2. HVAC system alternatives life cycle cost analysis (Klaassen). 47
Table 3.3. IAMU energy enhancement construction cost premiums (Walters). 50
Table 4.1. Instrumentation used in IAMU building monitoring. 54
Table 4.2. IAMU annual energy use indices. 60
Table 5.1. Pressure drop and flow rate through circuit balancing valves. 74
Table 5.2. GSHP system circulating pump information. 75
Table 5.3. Comparison of circulating pump energy to HVAC energy and total
office energy. 80
Table 5.4. Flow rates and VFD speed as heat pump valves are opened. 103
Table 5.5. ERV frost thresholds (Greenheck). 116
Table 5.6. ERV modes of operation. 119
Table 5.7. Comparison of 46 and 5 oF defrost heater set points between 7:30 am
and 5:30 pm. 123
Table 5.8. Temperature bin data for ERV operation times: 8:00 am to 6:00 pm
Table 5.9. Savings resulting from decreasing defrost heater set point from 46 F to
5 oF. 130
Table 5.10. Unoccupied hours general equipment energy use. 136
Table 5.11. Sample appliance energy use. 138
Table 5.12. Sample appliance energy savings 138
Table 6.1. Summary of IAMU building energy enhancements. 141
Table A.1. Individual energy efficiency strategies modeled in DOE-2 (The Weidt
Group 1998). 152
Table B.1. Points connected to controller in north equipment room. 154
Table B.2. Points connected to controllers in south equipment room. 155
Table B.3. NOSE IAQ sensor points. 156
Table B.4. Calculated points. 157
Table B.5. Point names and controllers the points are connected to. 158
Table C.1. HP-H1, north wing, conference room’s thermostat settings (6-12-2007). 159
Table C.2 HP-H2, north wing, south offices’ thermostat settings (6-12-2007). 159
Table C.3. HP-H3, north wing, north offices’ thermostat settings (6-12-2007). 159
Table C.4. HP-H4, north wing, central offices’ thermostat settings (6-12-2007). 160
Table C.5. HP-V1, south wing, auditorium’s thermostat settings (6-12-2007). 160
Table C.6. HP-V2, south wing, north offices’ thermostat settings (6-12-2007). 160
Table C.7. HP-V3, south wing, lobby’s thermostat settings (6-12-2007). 161
Table C.8. HP-V4, south wing, south and east offices’ thermostat settings
(6-12-2007). 161
Table E.2. Number of heat pump-minutes in weekday bins (8/1/2004 to
6/30/2007). 176
Table E.3. Average number of heat pumps running in weekday bins (8/1/2004 to
6/30/2007). 177
Table E.4. Number of minutes occurring in weekend bins (8/1/2004 to 6/30/2007). 178 Table E.5. Number of heat pump-minutes in weekend bins (8/1/2004 to
6/30/2007). 179
Table E.6. Average number of heat pumps running in weekend bins (8/1/2004 to
6/30/2007). 180
Table F.1. Electric rates including all fees and taxes. 181
Table G.1. Calculations performed to determine maximum and minimum energy
use by VFD/pump. 182
List of Figures
Figure 2.1. Energy efficiency design optimization for a community hall (Colley
and Schukat 2002). 23
Figure 2.2. Least cost path to net zero energy home (Anderson, Christensen, and
Horowitz 2006). 24
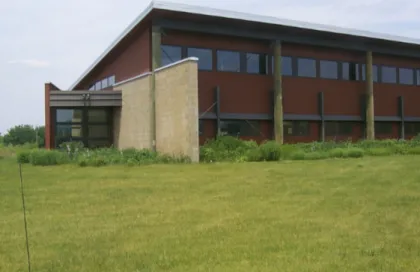
Figure 3.1. The south side of the IAMU facility; the south wing is in the right side of the picture and the north wing is in the left side of the picture. (John
Burnet, IAMU) 36
Figure 3.2. IAMU entrance sign with flowering prairie in background. (John
Burnet, IAMU) 38
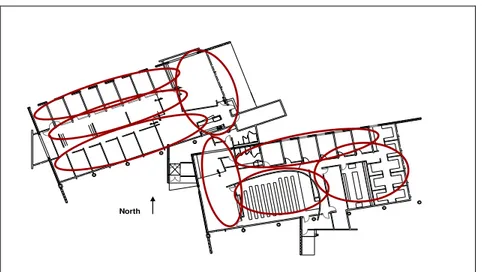
Figure 3.3. The IAMU floor plan. (RDG Planning and Design) 39
Figure 3.4. IAMU north wing, daylight office space. Southern windows to left of
picture. (John Burnet, IAMU) 43
Figure 3.5. Southwest corner of the IAMU’s north wing. Notice the many exterior
shading devices. (John Burnet, IAUM) 44
Figure 3.6. IAMU’s eight thermal zones served by eight ground source heat pumps. 46
Figure 3.7. Schematic of the energy recovery ventilator (ERV). 48
Figure 4.1. Data acquisition system architecture. 53
Figure 4.2. Organization of IAMU energy monitoring meters. 57
Figure 4.3. Location of temperature sensors (T) and NOSE indoor air quality
sensors (N). 58
Figure 4.4. Location of light sensors (L). 59
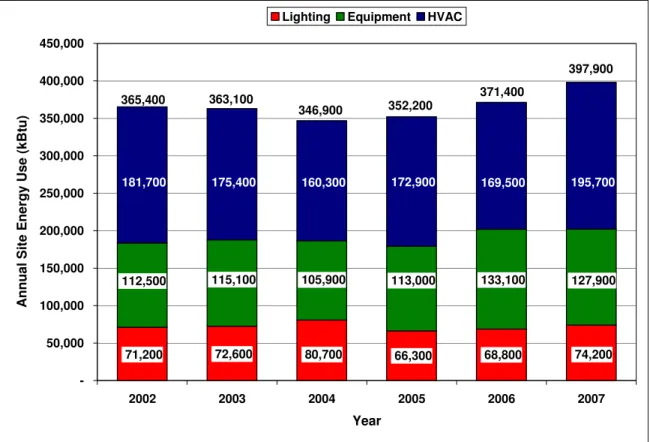
Figure 4.5. IAMU annual site energy use for the years 2002 through 2007. 62
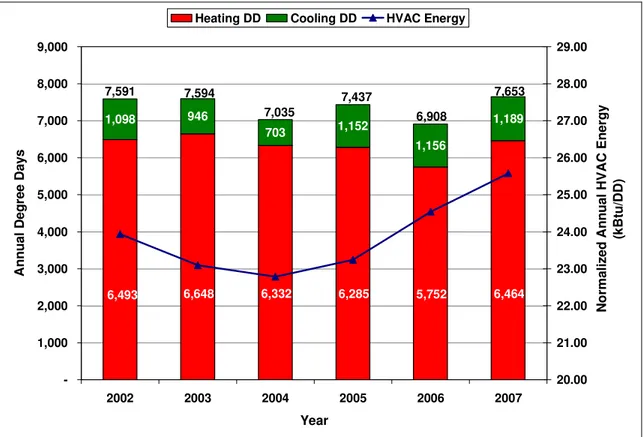
Figure 4.6. Annual number of degree days, and normalized annual HVAC energy
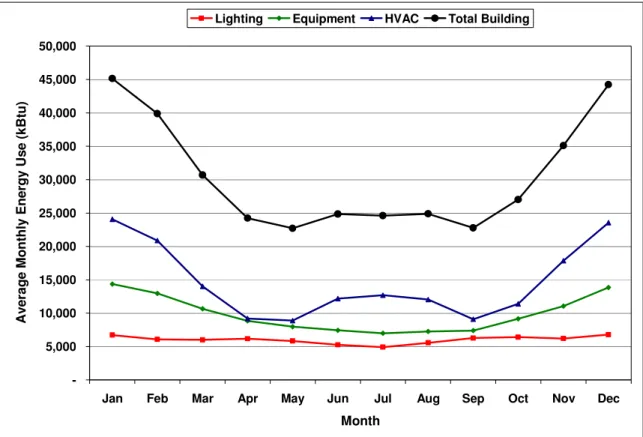
Figure 4.7. IAMU six year average, from 2002 to 2007, monthly energy use. 65 Figure 4.8. Comparison of IAMU energy use to code compliant building, and
design estimate energy use. 66
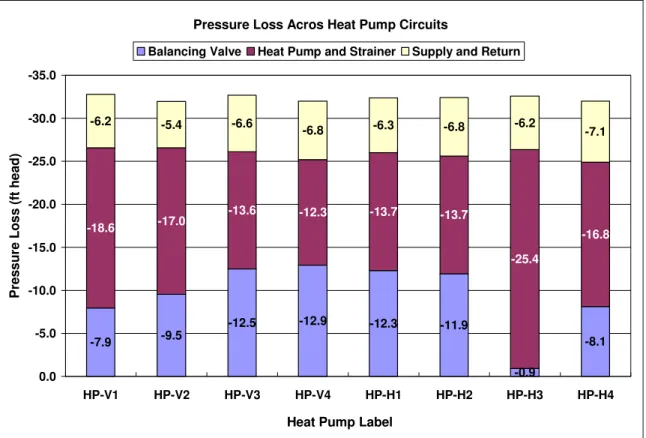
Figure 5.1. Schematic of the ground source heat pump system. 72
Figure 5.2. Heat pump hook up. 76
Figure 5.3. Pressure losses across heat pumps before addition of VFD. 78
Figure 5.4 GSHP system demand and circulating pump demand for Sunday, October 1, 2006. The outside air temperature varies between 53 and 86
o
F. 82
Figure 5.5 GSHP system demand and circulating pump demand for Thursday, February 15, 2007. The outside air temperature varies between -8 and 7
o
F. 83
Figure 5.6. Average number of heat pumps running in 1 hour and 5 oF
temperature-time bins on weekdays, view one. 88
Figure 5.7. Average number of heat pumps running in 1 hour and 5 oF
temperature-time bins on weekdays, view two. 90
Figure 5.8. Average number of heat pumps running in 1 hour and 5 oF
temperature-time bins on weekdays, view three. 91
Figure 5.9. Hours of concurrent heat pump operation between 8/1/2004 and
7/31/2007. 92
Figure 5.10. Schematic of GSHP system retrofitted for addition of VFD to control pump speed. Note addition of electronic shutoff valves, flow meters, and differential pressure sensors, as well as removal of automatic
balancing valves. 94
Figure 5.11. New heat pump connection piping configuration. 96
Figure 5.12. Flow rates in the heat pumps when all the heat pumps’ valves are
Figure 5.13. Pressure drop vs. valve Cv for a flow rate of 9 GPM. 99
Figure 5.14. Shut off valve wiring diagram. 100
Figure 5.15. Measured VFD/Pump current on line one and line two at various
pump speeds. 105
Figure 5.16. VFD/Pump power and VFD/Pump DAQ current at different pump
speeds. 106
Figure 5.17. VFD/Pump power and VFD/Pump DAQ current at different pump
speeds, with transient values removed. 107
Figure 5.18. VFD/Pump power as a function of the VFD/Pump current on line 1 as
measured by the data acquisition system. 108
Figure 5.19. Percentage of energy saved by VFD compared to constant speed
pumping over monitoring period from 12/19/2007 to 2/26/2008. 109
Figure 5.20. The weekday fraction of energy previously used by circulating pump
without VFD now used by pump with VFD, 12/19/2007 to 2/26/2008. 110
Figure 5.21. VFD/Pump current on line 1 as measured by the data acquisition system as a function of the number of shutoff valves open. The lower line represents current when the valve on HP-V1 is closed, and the
upper line represents the current when the valve on HP-V1 is open. 112
Figure 5.22. Predicted maximum and minimum annual energy use of the
VFD/pump compared to energy use of the pump without the VFD. 113
Figure 5.23. Schematic diagram of the ERV. 115
Figure 5.24. Defrost heater thermostat control wiring. 117
Figure 5.25. Actual defrost heater wiring diagram, single 12.2 kW stage. 118
Figure 5.26. Recommended defrost heater wiring diagram, two 6.1 kW stages. 118
Figure 5.27. ERV defrost heater runtime with 46 oF set point. 120
Figure 5.29. Percentage runtime of defrost heater in 5 F temperature bins when
ERV is operating. 126
Figure 5.30. Annual runtime of ERV defrost heater in 5oF temperature bins. 129
Figure 5.31. Summer general load meter power profile. 132
Figure 5.32. Winter general load meter power profile. 133
Figure 5.33. Winter general plug load profile showing unit heaters shut off from
List of Nomenclature
∆P Differential pressure
ARI Air Conditioning and Refrigeration Institute
ASHRAE American Society of Heating, Refrigerating and Air-Conditioning
Engineers
COP Coefficient of Performance
Cv Loss coefficient for valves
DAQ Data acquisition
DC Discretionary communal
DOAS Dedicated outside air system
DOE Department of Energy
DOE-2 Building energy simulation software program
DP Discretionary personal
EAEAT Exhaust air entering air temperature
EALAT Exhaust air leaving air temperature
EIA Energy Information Administration
ERV Energy recovery ventilator
EUI Energy use intensity
GSHP Ground source heat pump
HVAC Heating, ventilating, and air conditioning
HVAC&R Heating, ventilating, air conditioning, and refrigeration
IAMU Iowa Association of Municipal Utilities
IESNA Illuminating Engineering Society of North America
LEED Leadership in Energy and Environmental Design
LON LonWorks communication protocol
NIST National Institute of Standards and Technology
NOAA National Oceanic and Atmospheric Administration
NREL National Renewable Energy Laboratory
OAEAT Outside air entering air temperature
OALAT Outside air leaving air temperature
PID Proportional, integral, differential
PT Pressure, temperature
Q Flow rate
RTD Resistance temperature detector
SHGC Solar heat gain coefficient
TMY Typical Meteorological Year
USGBC United States Green Building Council
VAV Variable air volume
VFD Variable frequency drive
VOC Volatile organic compound
Acknowledgements
I would not have been able to complete this thesis without the help and encouragement from many people. I would first like to thank Dr. Michael Pate, who recruited me for my graduate position and provided me an assistantship at the Iowa Energy Center’s Energy Resource Station. Dr. Pate along with Dr. Ron Nelson acted as my co-major professors on my program of study committee and provided me guidance, but allowed me freedom to develop this project largely on my own. I also thank Dr. J. Adin Mann for serving on my program of study committee.
I owe a deep debt of gratitude to Curt Klaassen, the director of the Energy
Resource Station, who provided frequent technical assistance on my project. Without his help, this thesis would not have been possible. I also thank all of the staff and students at the Energy Resource Station for their daily help on my project and making my time at the Energy Resource Station so enjoyable: David Perry, Xiaohui “Joe” Zhou, Doug Sick, Enes Kadic, Lee Johnson, Rodney Ingle, Michael Keiter, Denise Junod, Melva Schmidt, and Connie Pedersen. I thank Robert Haug, director of the Iowa Association of
Municipal Utilities for allowing me to study his organization’s building for my thesis. Thank you to Erin Peiffer and all the other employees at the IAMU who assisted me in my project.
I thank Amy Kristapovich, my fiancée, and my parents, Rod and Mari, for their love and support throughout my time in graduate school.
Finally, I thank the Iowa Energy Center, which supplied the financial support to make this project possible.
Abstract
This report discusses energy efficiency enhancements made to a low energy, high performance office building. The building studied is the Iowa Association of Municipal Utilities’ headquarters located in Ankeny, Iowa, just north of Des Moines. Monitoring the energy use of the building for over six years has revealed that it has an average annual
site energy use of 29,300 Btu/ft2. This is 68% less energy than that used by the average
U.S. office building and 74% less energy than the average office building in climate zone 2, the location of Ankeny.
Three areas of energy use were chosen for improvement: the ground source heat pump system’s circulating pump, the energy recovery ventilator’s defrost heater, and general office equipment (computers, refrigerators, coffee pot, etc.) during periods when the building is unoccupied. Before the improvements, the three items contributed to 38% of the building’s annual energy use. The table below summarizes the energy use of each item before improvements were made, and the savings resulting from the improvements. The improvements have the potential of saving up to 27% of the building’s annual energy use. The circulating pump’s energy savings were achieved by switching it from a
constant speed pump to a variable speed pump by equipping it with a variable frequency drive and installing shutoff valves on the heat pumps. Energy savings for the defrost
heater were realized by decreasing its set point from an unreasonable 46 oF to a
recommended 5 oF. The savings for the general equipment can be achieved if employees
turn off all unnecessary equipment when the building is unoccupied.
Annual Building Energy: 107,300 kWh Annual Energy (kWh) % of Total Building Energy Annual Energy (kWh) Cost Savings % Savings % Savings of Building Energy Circulating Pump 18200 17% 3100 to 4100 $920 to $990 77% to 83% 13% to 14% Defrost Heater 5100 5% 360 $260 93% 4% Unoccuped Period General Equipment 17400 16% 8100* $600* 53%* 9%*
*Savings potential if all discretionary equipment is turned off during unoccupied periods
Chapter 1.
Introduction
There is a large movement among the building design, construction, and operation and maintenance communities to make buildings ‘green’. This movement is rooted in the assertion that human activities are damaging the natural environment to an extent that the environment will not be able to provide for the needs of future generations. The
movement to design and construct green buildings, also referred to as sustainable buildings, seeks to reduce the impact buildings have on the environment, and hence make buildings more sustainable. The United States Green Building Council, a
prominent organization within the green building movement, has established five areas in which to measure the sustainability of buildings: (USGBC, 2007)
1. Sustainable site development
2. Water savings
3. Energy efficiency
4. Materials selection
5. Indoor environmental quality
The large amount of pollution created and natural systems disrupted during the production and use of energy, especially energy derived from fossil fuels, makes energy efficiency a key element of making buildings more sustainable. Besides sustainability, energy efficiency is important because of the growing global demand for limited energy sources and the corresponding rising price of energy. Investing in energy efficiency will provide savings throughout the life of a building.
In 2005, buildings in the United States used over 39 Quads of primary energy, and contributed to 40% of the U.S.’ total primary energy use (DOE 2007). Of this 40% of U.S. primary energy use, commercial buildings used over 7 Quads or 18%, and
residential buildings used over 8 Quads or 22%. The U.S. Department of Energy predicts that U.S. building energy use will continue to rise over the next two decades, reaching 48
Quads by 2020 and 53 Quads by 2030 (DOE 2007). Currently U.S. building energy use contributes 39% of the U.S.’s carbon emissions and 9% of the world’s total carbon emissions (DOE 2007).
1.1. Problem Definition
The energy use of a building is determined by three main phases in its life: the design of the building, the implementation of the design (construction and
commissioning), and the occupancy of the building. During the design phase, many elements that will greatly affect a building’s energy use are determined. Some of these elements are the building orientation, type and quantity of fenestrations, and the type and efficiency of mechanical systems. Without a design that takes energy efficiency into account, it is almost impossible for a building to be a low energy building. Ideally, a building would be constructed exactly as the architects and engineers specified, but many practical reasons prevent this from happening. Changes made to the design during implementation, and the quality of construction will affect the energy use of a building. If insulation is installed poorly or a daylighting system is commissioned incorrectly, the intended energy savings from these items will not be realized. Finally, in the occupancy phase, the occupancy level, the type and quantity of equipment used, the behavior of the occupants, and physical changes to the building, will affect the energy use of the
building.
This study uses the Iowa Association of Municipal Utilities’ (IAMU) office building as a case study to examine how the energy use of a low energy building can be reduced. Design of the IAMU’s office building began in 1997, and it became occupied in June 2000. From the beginning of design, the organization’s leaders desired a building with low environmental impacts, including low energy use. Monitoring of the building has shown that it maintains high indoor environmental quality and is indeed a low energy
building. The building was one of the American Institute of Architects’ National Committee on the Environment’s Top Ten Green Projects in the U.S. in 2002. The building was also rated among the top 10% most efficient commercial buildings in the U.S. when it received an Energy Star rating of 93. The low energy use of the building is due largely to the integrated design approach and the use of energy modeling to
determine cost effective energy efficiency features in the building. The building’s design process has been documented by McDougall et al. (2006), and the results from
monitoring the energy use and indoor environmental quality of the building are presented by Klaassen et al. (2006).
During the design of the IAMU building, emphasis was placed on implementing energy efficiency measures that would save the largest amount of energy and have the largest paybacks. The building energy monitoring has shown that these energy efficiency measures have succeeded in greatly reducing the energy use of the building. The
building uses 55% less energy compared to an energy simulation, using DOE-2, of the building without any of the efficiency measures (Winkelmann et al 1993). While attention was placed on implementing efficiency measures for the biggest energy uses, many smaller energy uses were not considered for efficiency measures. Energy
monitoring has shown that these ignored energy uses, which would be insignificant in a building without any efficiency measures, contribute a significant proportion of the IAMU building’s total energy use. Because these energy uses did not receive efficiency measures in the original building design, they present opportunities to significantly further reduce the building’s energy use. The energy uses fall into all three building phases in which energy use is determined: system design, design implementation, and occupancy.
1.2. Goals and Objectives
This report has two main goals. First, it will document energy uses of a low energy building for which attention was not paid to efficiency in the design of the
building, implementation of the design, or occupancy phase of the building. These energy uses present areas for further reduction in building energy use through energy efficiency enhancements. The second goal is to implement energy efficiency enhancements to reduce the energy use of an already low energy building. The goals will be met through the use of the IAMU building as a case study. The report will meet the goals through the following objectives:
1. Give an overview of the current work being done in low energy buildings
through a literature review.
2. Document that the IAMU building is a low energy building by:
a. Presenting how a focus on energy efficiency by the design team led to
a building with energy efficiency integrated into all of its systems.
b. Presenting building monitoring data that reveal that the IAMU
building uses significantly less energy than typical office buildings.
3. Identify three systems within the building where energy efficiency
improvements can be made. Each energy use will correspond to one of the three building phases within which building energy use is determined.
a. Provide complete description of system
b. Present monitored energy performance data for system
c. Make changes to systems to improve energy performance
1.3. Report Organization
In Chapter 2 a review of literature on topics related to low energy buildings is presented. Section 2.2 gives statistics on the energy use of buildings in the United States. These statistics include the historical amount of primary energy U.S. buildings use, the distribution of commercial building energy use among end uses, the average energy use index for different types of commercial buildings, and the contribution U.S. building energy use makes to green house gas emissions. Section 2.3 presents the definitions of several phrases frequently used to describe low energy buildings. These phrases include ‘good design’, ‘high performance building’, and ‘sustainable building’. Following this, section 2.4 discusses several definitions of a ‘zero energy building’ and explores the technical feasibility of this type of building. Section 2.5 outlines designing and
optimizing a low energy building, and then discusses monitoring buildings to determine their performance level. Finally, in section 2.6, several case studies of low energy buildings from the literature are presented.
Chapter 3 introduces the reader to the IAMU office building and the design features that make it a low energy building. Section 3.2 discusses the integrated design of the building, section 3.3 discusses the major building systems, and section 3.4 discusses the cost premiums associated with the original energy efficiency design features. Chapter 4 presents information on the monitoring of the energy performance and indoor environmental quality of the IAMU building. Section 4.2 contains an overview of the data acquisition system, and section 4.3 discusses the building
monitoring strategy. Then in section 4.4 energy performance of the building from six years of monitoring is presented.
The experimental section is contained in Chapter 5. This chapter discusses three areas where the energy performance of the building could be improved, and the steps taken to make those improvements. Section 5.2 discusses the energy performance of the
ground source heat pump system circulating pump’s energy use, section 5.3 discusses the energy use of the energy recovery ventilator’s defrost heater, and section 5.4 discusses the energy use of the building’s general equipment when the building is unoccupied. Section 5.2 has four subsections: the first gives an overview of the operation of the GSHP system, the second describes the performance and energy use of the system, the third describes changes made to the system, and the fourth describes the energy savings resulting from the changes. Sections 5.3 and 5.4 contain three subsections each: the first describes the operation of the systems, the second describes the performance and energy use of the systems, and the third describes changes made to the systems and the resulting energy savings. Finally, Chapter 6 contains a conclusion to the energy efficiency
Chapter 2.
Literature Review
2.1. Introduction
This literature review covers issues related to low energy buildings on the whole building level. The review covers building energy statistics, definitions associated with low energy buildings, the design of low energy buildings, and case studies of monitored low energy buildings. Section 2.2 lays the background for discussing low energy
buildings by outlining some pertinent statistics on the energy use and carbon emissions of buildings in the U.S. Section 2.3 goes on to define several terms frequently used in literature to describe low energy buildings and clarifies how the terms are related to low energy buildings. These terms include ‘High Performance Building’, ‘Sustainable Building’, and ‘Green Building’. In section 2.4 the concept of a net zero energy building is introduced, and four different definitions that emphasize different methods of meeting net zero energy are outlined. This section also contains information on the technological feasibility of constructing net zero energy commercial buildings. Section 2.5 contains guidelines on the design and optimization of low energy buildings, and procedures for monitoring and reporting the energy use of buildings. Finally in section 2.6 seven low energy building case studies are discussed. The case studies offer insights into different types of low energy buildings, their design, the type of technology used in them, and the problems encountered in them.
2.2. United States’ Building Energy Use Statistics
Buildings have a profound impact on our world by providing the shelter and conditioned environment needed for most human activities to take place. Large amounts of energy are used by buildings for lighting, space heating and cooling, and ventilation to provide a healthy comfortable indoor environment. Considerable additional energy is used for the activities that occur within the buildings including the operation of computers and appliances, refrigeration, heating of water, etc. In 2005, as shown in
Table 2.1, buildings in the U.S. used 39.7 Quads of primary energy, or 40% of the U.S.’s primary energy. In 2005 commercial building accounted for 18% of U.S. primary energy use and residential buildings accounted for 22% of U.S. primary energy use. Since 1980 the primary energy used by U.S. buildings has grown 50% from 26.4 Quads to 39.7 Quads. It is predicted that by 2030 U.S. building primary energy use will grow an additional 34% from 39.7 Quads to 53.3 Quads. Table 2.1 also show that between 1980 and 2005 the percentage of primary energy used by residential buildings has increased only slightly from 20% to 22%, and it is predicted it will drop back to 20% by 2030. In contrast the percentage of primary energy used by commercial buildings has increased from 14% to 18% between 1980 and 2005, and is predicted to increase to 20% by 2030.
Table 2.1. U.S. commercial and residential building primary energy use (DOE 2007).
Year Building Primary Energy Use (Quads) % U.S. Primary Energy Used by All Buildings
% U.S. Primary Energy Used by Residential
Buildings
% U.S. Primary Energy Used by Comercial Buildings 1980 26.4 34% 20% 14% 1990 30.4 36% 20% 16% 2000 37.7 38% 21% 17% 2005 39.7 40% 22% 18% 2010 42.5 40% 22% 18% 2020 48.0 41% 21% 19% 2030 53.3 41% 20% 20%
The breakdown of primary energy to end uses in commercial buildings in the U.S. is shown in Table 2.2. The largest category of energy consumption is lighting at 26% of commercial building primary energy use, followed by space heating at 14%, and space cooling at 13%. Ventilation uses another 6% of the primary energy. The ‘other’ category, which makes up 13% of the primary energy use, includes service station equipment, ATMs, telecommunications equipment, medical equipment, pumps, emergency electric generators, combined heat and power, and manufacturing in commercial buildings. Electronics use 6% of commercial building primary energy, refrigeration uses 4%, computers use 3%, and cooking uses 2%. The ‘adjust to SEDS’
category’ is an adjustment the Energy Information Agency (EIA) uses to remove discrepancies between data sources.
Table 2.2. Commercial building primary energy end uses (DOE 2007).
Energy Use Amount (Quad) Percent
Space heating 2.5 14% Lighting 4.6 26% Space Cooling 2.3 13% Water Heating 1.2 7% Electronics 1.1 6% Refrigeration 0.7 4% Cooking 0.4 2% Ventilation 1.1 6% Computers 0.6 3% Other 2.4 13% Adjust to SEDS 1.0 5% Total 17.9 100%
The amount of energy a building uses per unit floor area, or energy use intensity (EUI), is a useful metric for comparing the energy use of different buildings. Table 2.3 contains EUI’s for thirteen different commercial building types averaged over the entire U.S. and averaged over climate zone 2, which contains Ankeny, IA. Climate Zone 2 is defined by the National Oceanic and Atmospheric Administration (NOAA) as the area of the U.S. that has historically (1971-2000) had fewer than 2000 cooling degree days and between 5,500 and 7,000 heating degree days. For most of the categories Climate Zone 2’s EUIs are higher than the national average. For commercial office buildings the
national average EUI is 92.9 kBtu/ft2, while the EUI for commercial office buildings in
Climate Zone 2 is 114.9 kBtu/ft2, 24% higher than the national average. The EUI of
office buildings is slightly higher the average EUI for all commercial building types (row 1 of Table 2.3) when compared on both the national and climate zone 2 levels.
commercial buildings between the average for the U.S. and Climate Zone 2(EIA 2006). Principle Building Activity United States Energy Use Index (kBtu/ft2) Climate Zone 2* (Contains Ankeny, IA)
Energy Use Index (kBtu/ft2) All Buildings 90.1 102.6 Education 83.1 85.2 Food Service 258.3 238.7 Inpatient Healthcare 249.2 283.3 Outpatient Healthcare 94.6 101.5 Lodging 100.0 132.1 Retail (non-malls) 73.9 73.5
Enclosed and Strip Malls 102.2 114.3
Office 92.9 114.9
Public Assembly 93.9 90.8
Relitious worship 43.5 46.9
Serrvice 77.0 71.2
Warehouse and Storage 45.2 76.1
*Defined by NOAA as historically (1971-2000) having fewer than 2000 CDD and 5,500 HDD
The use of electricity generated through the burning of fossil fuels such as coal, natural gas, or oil, or the burning of these fossil fuels at the building site releases carbon dioxide, a known greenhouse gas and contributor to global warming. Through the use of electricity produced by burning fossil fuels or the direct burning of fossil fuels onsite, U.S. commercial and residential buildings release 630.3 million metric tons of carbon annually into the atmosphere (DOE 2007). This accounts for 39% of U.S. carbon
emissions and 9% of annual global carbon emissions (DOE 2007). It is projected that by the year 2030 U.S. building carbon emissions will grow to 885.4 million metric tons annually, but the contribution to global emissions will decrease slightly to 8% as other areas of carbon emission throughout the world increase at a faster rate (DOE 2007).
2.3. Definitions of ‘High Performance Building’, ‘Green Building’, and ‘Sustainable Building’
In literature there are many references to ‘high performance’ buildings, ‘green’ buildings, and ‘sustainable’ building. Frequently these terms are used interchangeably or without any reference to their exact meaning. This section discusses the meaning of each phrase. Section 2.3.1 defines ‘good’ design—what all building designers should strive for. Section 2.3.2 discusses ‘high performance’ buildings and section 2.3.3 discusses ‘green’ and ‘sustainable’ buildings.
2.3.1. Definition of ‘Good’ Design
Because of the pervasiveness of buildings in human activity it is important that they are designed well. The ASHRAE GreenGuide outlines five qualifications of good building design (ASHRAE 2006). A good design should be considered the minimum goal of all building designs. The first qualification is for the building to meet the needs of the owners and occupants. This is the most basic requirement; no matter what features a building has, if it doesn’t meet the needs of the owner and occupants the design cannot be qualified as good. Second the building must meet all applicable building codes and standards. These represent minimum requirements of the building necessary for human health and safety, and for reducing the building’s environmental impact. Third the building must provide good indoor environmental quality including thermal comfort, indoor air quality, acoustical comfort, and visual comfort. Fourth a well designed building will be “compatible with and respectful of the characteristics, history, and culture of the immediate surroundings” (ASHRAE 2006). A building should always be appropriate for its surroundings; an otherwise well designed barn would not be
compatible with downtown Manhattan. Finally, the ASHRAE GreenGuide specifies that a building have the emotional impact on a viewer that the designers intended (ASHRAE 2006).
2.3.2. Definition of ‘High Performance’ Building
In literature the exact meaning of a ‘high performance’ building is unclear. In the most generic definition a ‘high performance’ building is a building that meets the five qualification of good design in exceptional ways. A key characteristic of a high
performance building is that all of its systems work together to compliment each others’ operation. It is difficult for a building to meet the good design criteria, let alone the high performance building criteria if the building systems (siting, envelope, lighting,
mechanical systems, etc.) have not been specifically designed to complement each other. There are no official qualifications for the way in which a high performance building must exceptionally meet the prerequisites of good design, but some commonly used qualifications are: the building uses significantly less energy than other buildings with comparable services; the building restores or protects the natural environment of the building site; the building has an exceptional indoor environment; or the building has exceptional emotional impact on the viewer. The performance of a high performance can be quantified as reduced energy consumption, reduced energy cost, reduced resource inputs, reduced waste outputs, high level of occupant comfort, and reliable building operation.
2.3.3. Definition of ‘Sustainable’ and ‘Green’ Building
With electric lighting, mechanical heating, cooling, and ventilation, and air purification systems, buildings can be designed to operate completely independent of the outside environment. Under most circumstances designing a building to be independent of the outside environment would be a poor design decision; the building would use more energy and resources than necessary, cost more to operate than necessary, and disconnect the occupants from the outdoor environment. With the growing human population and our increased pressure on the natural systems of the world, it is important that the environment be considered when designing buildings. In the book Natural Capitalism
Hawken et al. (1999) establish the concept of natural capital as one of four necessary types of capital required by the economy (the three others are human capital, financial capital, and manufactured capital). Natural capital consists of natural resources, living systems, and ecosystem services. Ecosystem services consist of such processes as the water cycle and the carbon cycle. It is generally accepted that through human activities natural capital is being depleted at rates that will cause resource shortages and disruptions in major ecosystem services in the future. Resource shortages and decreased ecosystem services will compromise the ability of future generations to survive. Our current rate of resource use and damage to the environment must be reduced to a sustainable level—a level that will allow us to meet our current needs, but will leave enough natural capital for future generations to meet their needs. The concept of sustainability can be applied to building design to decrease the use of natural capital in buildings. Throughout their life buildings use considerable natural capital: resources are used and ecosystems displaced when a building is constructed, the building uses energy and more resources throughout its life, and at the end of a building’s life it must be disposed of. Many steps can be taken during the design of a building to reduce the rate of natural capital use throughout its lifecycle. Frequently the term ‘green’ is used to give the connotation of a connection to nature to buildings (ASHRAE 2006). ‘Green’ is essentially a synonym of sustainable, but it is frequently used more loosely than the term sustainable.
The United States Green Building Council (USGBC) has established the Leadership in Energy and Environmental Design (LEED) rating system to encourage building designs that increase the sustainability of the building over its entire life cycle. LEED measures the sustainability of buildings in five areas (USGBC, 2007):
1. Sustainable site development
2. Water savings
4. Materials selection
5. Indoor environmental quality
Sustainable site development seeks to have as minimal impact on the natural biome of the building site as possible if the site is a greenfield. If the site has been disturbed, the project may restore the area around the building to a natural site.
Sustainable site development may include planting native plants, minimizing runoff using permeable paving systems or wetlands, and the reduction of light pollution from site lighting. Efficient water use includes reducing or eliminating the need to water landscaping, using innovate waste water management systems, and reducing the water use within the building. Energy efficiency is important to reduce the emissions and pollution associated with energy production. A sustainable building will draw on the resources freely available at the building site to reduce its use of natural capital—it may use daylighting instead of relying entirely on electric lighting, passive solar heating may be incorporated to reduce the energy use of the heating system, or natural ventilation could be utilized to reduce the reliance on mechanical cooling. When local resources are insufficient to meet the building’s needs the most efficient lighting, heating, cooling, and ventilation equipment should be employed. Materials selection in sustainable buildings seeks to use materials reused from other buildings, recycled materials, materials obtained locally, and fast growing renewable materials. Finally, sustainable buildings must provide good indoor environmental quality. While good indoor environmental quality is not unique to sustainable buildings, it is part of the good design of all buildings, a focus on sustainability can affect how good indoor environmental quality is achieved. The sustainable design guidelines of LEED place a large emphasis on using low emitting materials, controlling air pollutants, and providing daylighting and views to achieve good indoor environmental quality (USGBC, 2005).
Typically a sustainable or green building should also meet the five requirements of good design, but currently green design features are not considered necessity for a good design (ASHRAE 2006). Because of the growing concern over the sustainability of current building practices, sustainable design may become one of the requirements of good design. A building that meets the five criteria of a well designed building plus the requirements for being a sustainable building would also be considered a high
performance building. Energy use is considered one of the largest factors affecting the sustainability of a building, and the LEED sustainable building rating system allocates 10 out of 69 points to energy efficiency, three points to on site renewable energy, one point to enhanced commissioning of building systems, one point for measurement and
verification of the actual building energy use, and one point for purchasing green power from the grid (USGBC 2005). A large amount of work has focused on the energy efficiency aspects of sustainable and high performance buildings, and the remaining sections of the literature review focuses on this work.
2.4. Net Zero Energy Building
A net zero energy building is a subset of high performance buildings that utilizes energy efficient systems to greatly reduce its energy use and has renewable energy
sources to meet its remaining energy needs. The U.S. DOE has a goal of making net zero energy commercial and residential buildings marketable. Section 2.4.1 discusses the different definitions of a net zero energy building and section 2.4.2 discusses the technical potential for net zero energy commercial buildings.
2.4.1. Definitions of Net Zero Energy Buildings
A net zero energy building relies on both onsite renewable energy sources and a connection to the electrical grid for its energy needs. The primary source of energy for a net zero energy building is its onsite renewable source, but when this source is
insufficient the building can draw power from the electrical grid. When the building uses less energy than is produced onsite, the surplus power is fed back into the electrical grid. A net zero energy building is achieved when the amount of energy drawn from the grid equals the amount of onsite renewable energy fed back into the electrical grid.
Although the concept of a net zero energy building is straight forward there is some disagreement on the precise definition of a net zero energy building. Torcellini et al. (2006b) outline four definitions for a net zero energy building: net zero site energy, net zero source energy, net zero energy cost, and net zero energy emissions. Each definition emphasizes different strategies and energy sources for achieving a net zero energy building. Torcellini et al. also layout a hierarchy of steps that should be taken to achieve a net zero energy building. The first step is to prevent the consumption of energy by designing an energy efficient building. Second, renewable energy sources within the building footprint, such as photovoltaic panels on the roof or façade should be taken advantage of. Third, renewable energy sources on the building site should be used, such as a wind turbine or photovoltaic panels not placed on the building. Renewable energy sources in the building footprint are preferred because the energy producing system should be able to stay in place for the entire life of the building whereas renewable energy sources outside of the building footprint my be displaced by future development. The fourth level in the hierarchy is renewable energy sources available away from the building site that are brought to the building to produce electricity or heat. This includes all types of biofuels that are harvested, processed, and shipped to the building. The last and least desirable level of the hierarchy is purchasing electricity generated off site from renewable sources such as hydro or wind. In a region where hydro power dominates the supply, all electricity purchased is essentially renewable. Elsewhere, customers can pay an extra fee to assure that their electrical energy is supplied by a renewable source.
The definition of a zero energy building should encourage the building owner to implement as many energy efficiency features as possible to reduce energy use
(Torcellini et al., 2006b). If the definition of a zero energy building can be met by purchasing energy from a renewable source such as a hydroelectric plant, the building owner will not be motivated to build and maintain energy efficient buildings. A net zero site energy building treats all energy sources the same, therefore one energy unit of natural gas used at the building must be offset by one unit of electricity produced on site and one unit of purchased electricity must be offset by one unit of electricity produced on site. Because a site net zero building makes up all energy use one-to-one, they encourage the use of many energy efficient features (Torcellini et al., 2006b).
A net zero source energy building considers the amount of energy required at the energy source (power plant for electricity and gas pumping station for natural gas) to deliver one unit of energy use by a customer. Dreu and Torcellini (2006) determined that on a national average one unit of site electricity is equal to 3.37 units of source energy, and one unit of site natural gas is equal to 1.12 units of source energy. Therefore one unit of site produced exported electricity will make up for 3.37 units of site natural gas energy use. This ratio makes it easier to achieve a net zero source building when large amounts of natural gas are used.
A net zero energy cost building is achieved when the value of the exported site generated energy is equal to the value of the energy purchased for the building. This is the most difficult net zero energy definition to meet because electricity is usually purchased by power companies at a much lower price than the price they sell electricity to the building owner (Torcellini et al, 2006b). Demand charges, fees, and taxes make achieving a net zero energy cost building even more difficult. A net zero energy emissions building exports as much emissions free energy as energy purchased from emissions emitting sources. The accounting for a net zero energy emissions building is
difficult because the electricity purchased from the grid is generated using multiple methods with varying amounts of emissions—some regions may have a large contribution from hydro and nuclear plants while other regions may have a large contribution from fossil fuel burning plants (Torcellini et al, 2006b)
2.4.2. Technical Potential of Zero Energy Buildings
The Department of Energy’s Building Technologies Program has the goal of making net-zero energy buildings marketable by the year 2025. To assist this goal the National Renewable Energy Lab (NREL) examined the technological feasibility of constructing net-site zero energy commercial buildings (Griffith et al. 2006). The study does not consider the economic feasibility of net-zero energy commercial buildings, but considers the proportion of commercial buildings that could potentially be net-zero using technology available today and technological improvements predicted to occur by the year 2025. Fully utilizing today’s technology, 22% of commercial buildings could be net-zero, and based on projected technology improvement in 2025, 64% of commercial buildings could be net-zero (Griffith et al. 2006). The projected technological
improvements include doubling the efficiency of rooftop photovoltaic panels, increasing inverter efficiency, reducing lighting power density by 50% below Standard 90.1-2004 (ASHRAE 2004b), increasing chiller COP from 6.0 to 6.5, increasing heating efficiency from 95% to 97%, small decreases in fan static pressure, and other HVAC improvements (Griffith et al. 2006). By further reducing lighting power density to 75% below Standard 90.1-2004 or by reducing plug loads 25% below the other scenarios, the number of zero-energy buildings in 2025 would increase to about 70% (Griffith et al. 2006).
2.5. Low Energy Building Design and Monitoring
Designing a low energy or zero energy building takes a greater level of effort and organization than designing traditional buildings. Even if a building is designed to be
low energy, it my not perform as such. Therefore it is important to monitor buildings’ energy performance to find and correct discrepancies between the intended operation and the actual operation. Monitoring also allows a building’s energy performance to be compared to other buildings’ performance. Section 2.5.1 contains guidelines for the design of low energy buildings, section 2.5.2 outlines several methods for the
optimization of the design of low energy buildings. Section 2.5.3 discusses monitoring the energy performance of a building and making comparisons between buildings.
2.5.1. Design Guidelines
There are many guidelines available to assist in the design of low energy buildings. The following list of best practices for designing low- and zero-energy buildings was developed by NREL after monitoring the performance of six high
performance buildings. These best practices are general guidelines and should be used by building owners, architects, engineers, and anyone else involved in the design of
buildings to assist in the construction of high performance low energy buildings (Torcellini et al. 2006a):
1. A whole-building design process should be used to design low energy
buildings:
a. Set specific measurable energy goals to guide design.
b. Include all project participants from the start of design.
c. Use building energy simulation software to model building energy use
throughout design, construction, and occupancy to guide informed decision making.
d. The building envelope should eliminate as much of the heating, cooling,
and lighting loads as possible, and the mechanical and lighting systems should then be designed to make up the rest of the loads.
e. Update the building simulation as changes are made so that energy impacts of changes can be evaluated.
2. Perform a post occupancy evaluation of the building’s energy performance to
determine if the building systems are working harmoniously together.
3. Obtain standard metrics on the building to determine performance of systems
and overall building.
4. Design envelope and lighting system to take advantage of as much daylighting
as possible:
a. Use daylighting in all occupied areas adjacent to an exterior wall or
ceiling.
b. Prevent glare in daylighting design.
c. Integrate electric lights into daylighting system by using automatic,
continuously dimming daylighting controls.
d. The building interior should maximize daylighting distribution.
e. Commission daylighting system, and determine energy savings.
5. Energy recovery ventilators should have economizers.
6. Evaporative cooling should be used in dry climates.
7. Natural ventilation design guidelines:
a. Natural ventilation should rely on stack effect—winds shift and require
numerous cross-paths for reliable ventilation.
b. Use separate supply and relief dampers with automatic HVAC controls for
natural ventilation rather than relying on occupants to open and close windows.
c. Avoid enclosed spaces that are difficult to ventilate naturally.
d. Do not use natural ventilation as replacement for HVAC system
8. Use demand-responsive controls to mange demand.
9. Avoid parasitic energy draws.
ASHRAE (2004) has published several Advanced Energy Design Guides, including one for small office buildings that provide standard practices for designing a building that should reduce the energy use of a new building 30% below ASHRAE 90.1-1999. The guides divide the United States into eight climatic zones and provide a table of standard design features that will reduce the energy consumption of a building in each zone. The guide contains recommendations for the building envelope, lighting, HVAC equipment and systems, and water heating. Unlike the best practices guidelines presented above, the Advanced Energy Guides are very specific and offer such information as the R-value of insulation and efficiency of mechanical equipment needed to achieve 30% energy savings. The guides stress that for the measures to be effective, energy efficiency must be a priority form the beginning of the design and an integrated design approach should be utilized.
The ASHRAE GreenGuide gives general recommendation on the design, construction, and operation of sustainable buildings. It covers all areas related to sustainability, not just energy efficiency. The book is written primarily for HVAC&R engineers, but also contains green building information on fire protection, storm water management, lighting, and architectural features that affect energy use. This book also emphasizes that coordination is required between all parties involved in the design, construction, and commissioning of the building to ensure that the green building goals are met (ASHRAE 2006).
2.5.2. Design Optimization
The many energy efficiency design guidelines available to design professionals allow a range of low energy design solutions to be developed. Frequently a trial-and-error method is used in conjunction with building energy simulation to determine which
design features to incorporate into a building. In the design of the Iowa Association of Municipal Utilities’ (IAMU) office building, The Weidt Group (1998) used DOE-2.1E to simulate the energy use of a base case building built according to ASHRAE Standard 90.1-(1993 lighting standards). They then simulated 84 different energy efficiency measures individually to determine their impact on the energy use on the base case building simulation, their incremental implementation cost, and their expected payback period. The owner and design team then met to form three alternative bundles of energy efficiency measures from the list of 84. The first bundle contained the features most likely to be included in the building, the second contained all the features of the first plus additional desired items, and the third bundle was a variation of the first two. The Weidt Group then used DOE-2.1E to evaluate the energy performance of each of the three bundles before the final bundle selection was made.
This method of energy analysis is lengthy and labor intensive because the designer must run a separate building energy simulation for each energy efficiency feature and then run more simulations once the efficiency enhancement bundles are determined. The labor intensiveness of this design method severely limits its ability to optimize the energy efficiency of the building. Only a fraction of possible energy efficiency options can be evaluated in the initial development of alternatives, and then only a handful of energy efficiency bundles can be evaluated. It is unlikely that the small sample of bundles would determine the optimum design of the building. To facilitate the design of high performance buildings Charron and Athienitis (2006) suggest the use of genetic algorithms used in conjunction with a building energy simulation program. Genetic algorithms allow a large variety of alternatives to be tested, and they work well for finding optimal solutions. Various building parameters such as orientation, amount of glazing, insulation levels, and shading, can be varied by the genetic algorithm to produce a large number of solutions. Figure 2.1 shows the results of using a genetic algorithm to
design a community hall in the United Kingdom (Coley and Schukat 2002). The genetic algorithm developed many different building designs that use significantly less energy than the typical community hall in the UK. This variety allows for design flexibility. Coley and Schukat reported that two of the better designs had similar energy use, but one relied on large amounts of insulation and few windows to achieve energy savings, and the second had a large amount of glazing to permit passive solar heating to achieve energy savings.
Figure 2.1. Energy efficiency design optimization for a community hall (Colley and Schukat 2002).
Optimization strategies have also been applied to residential single family homes. As part of the US Department of Energy’s Building America program Anderson,
Christensen, and Horowitz (2006) used a sequential search method called BEopt with a building energy simulation program to determine the least-cost path to achieving zero energy homes. Because most construction materials and configurations are available only in discrete forms, the optimization routine utilized discrete rather than continuous variables. For example, wall constructions, glass types, and furnaces all appear only in discrete forms. The optimization routine searches all categories of discrete variables at
each sequential step in energy savings to determine the most cost-effective combination of energy improvements. The program determines cost-effectiveness based on the combined annual cost of energy and the mortgage used to finance the energy
improvements. The most cost-effective point at each level of energy savings make up the least-cost path to zero energy homes, which is shown by the green line in Figure 2.2. Point 1 in the figure is the base case home that has no energy efficiency improvements. From point 1 energy efficiency upgrades are employed until the minimum annual cost is reached at point 2. Energy improvements are added to the home until point 3 is
reached—the point where the marginal cost of additional energy improvements is equal to the cost of producing renewable energy onsite. From point 3 additional onsite generating equipment such as photovoltaic panels are added until net zero energy is reached at point 4. At point 4 the annual energy cost is zero, and the mortgage for financing the energy improvements makes up the entire annual cost.
Figure 2.2. Least cost path to net zero energy home (Anderson, Christensen, and Horowitz 2006).
The exact shape of the curve and the energy savings where points 2 and 3 occur are dependent on many of the cost and construction assumptions of the model and the climate where the house is located. The researchers found that for the 5 main climate zones of the lower 48 states of the U.S. the minimum annual cost point (point 2) was reached between an energy savings of 27% and 39%. The switch from energy efficiency enhancements to renewable onsite generation (point 3) occurred between 50% and 60% energy savings. The least cost-curve is useful for determining the potential of energy improvements and onsite generation technologies for saving energy in new houses.
This general optimization procedure for determining the least cost path to net zero energy is useful for residential homes because the majority of homes have very similar features and construction practices. Applying a similar general optimization procedure to commercial buildings would not be practical because of the wide variety in commercial buildings. For useful results this optimization routine would need to be applied to many different categories of commercial buildings such as retail, office, warehouse, hospital, etc. Even so, the diversity among these groups is so great that a new least cost path many need to be developed for each new building under development.
2.5.3. Building Monitoring and Comparisons
In an effort to better understand the attributes of energy efficient buildings and the design practices that result in energy efficient buildings, a large amount of research has been devoted to monitoring the energy use and the indoor environment of buildings that have been designed to be high performance buildings. These monitoring projects focus on tracking the main energy uses in the buildings—lighting, HVAC, and equipment loads, and the energy production of any onsite renewable energy source such as photovoltaic panels—to determine energy savings of the buildings compared to equivalent buildings built according to the contemporary energy code. In addition to monitoring energy use and production, key building performance metrics such as light
level, temperature, and humidity level are monitored to verify that the building systems are operating satisfactorily.
To determine the energy savings of a high performance building, a year long building energy simulation of the as built building should be compared to the energy simulation of a base case building using TMY weather data (Torcellini, et al. 2006). The base case building is the same as the as-built building, except its features minimally meet the applicable energy code. If the building under study has been monitored for a year, and weather data is available from the building site or from a nearby weather station, this weather data will provide more accurate simulation results than TMY weather data. Using the actual weather data and the actual occupancy, lighting, and equipment
schedules will allow the as-built simulation to be tuned so that it predicts the same energy use as was measured in the actual building. Comparing a base case simulation to an as-built simulation allows difficult to know inputs to be remain constant between
simulations and removes uncertainty from the calculation of energy savings (Torcellini, et al. 2006).
A standard set of building performance metrics is necessary to allow the comparison of a monitored building to energy simulation results or to other monitored buildings. Without a standard set of metrics a plethora of metrics developed for different programs make performance comparisons between buildings difficult. The Performance Metrics Project performed by the U.S. Department of Energy is an effort to standardize the metrics by which the performance of commercial buildings is reported (Barely, et al. 2005). Attention was paid to making the metrics applicable to a large variety of building configurations and scopes of monitoring projects. The project only developed metrics needed for energy performance quantification. The report by Barely, et al. specifies the procedure for determining 45 energy performance metrics shown in Table 2.4. The metrics are divided into two tiers. The first tier provides a quick summary of a building’s
energy performance and relies on the electric utility meter to provide energy usage data. The second tier uses a data acquisition system to monitor energy use of specific pieces of equipment and provides a much more detailed energy performance report. All 45 of the metrics would not be used in the second tier; only the metrics that apply to the systems included in the building and metrics that answer the questions of the researcher would be used. ASHRAE Standard 105-2007, “Standard Methods of Measuring, Expressing, and Comparing Building Energy Performance”, also contains metrics to compare the energy performance of a building (ASHRAE 2007). While past versions of the standard have given guidelines for determining the energy performance of a building, they were not designed to compare the energy performance of different buildings. The updated
standard outlines how to measure the energy performance of a building, how to compare the energy performance of buildings, and provides minimum requirements for reporting building energy performance and making comparisons.
Table 2.4 Building energy performance metrics (Barley et al. 2005).
Air Distribution Energy Use HVAC Energy Use
Building Electrical Demand Indoor Zone Temperature
Building Electrical Demand Intensity Installed Lighting Energy Use
Building Energy Use Net Facility Electrical Demand
Building Energy Use Intensity Net Facility Energy Use
Building Lighting Energy Use Net Facility Load Factor
Building Purchased Energy Cost Net Facility Purchased Energy Cost
Building Purchased Energy Cost Intensity Other Building Energy Use
Cogeneration Electrical Energy Output Other Facility Electrical Energy Production
Cogenerational Fuel Use Other HVAC Energy Use
Cogeneration Losses Outdoor Ambient Temperature
Cogeneration Thermal Energy Output Outdoor Energy Use
Cold Storage Transfer People-Mover Energy Use
Cooling Energy Use Plug-in Lighting Energy Use
DHW Energy Use Plug Loads Energy Use
DHW System Efficiency Process Energy Use
DHW Load Produced Energy Storage Transfer
Electrical Generation System Losses PV Energy Production
Façade Lighting Energy Use Thermal Energy Production
Facility Energy Production Total Facility Electrical Demand
Functional Area Total Facility Energy Use
Gross Interior Floor Area Wind Energy Production