Development/Plasticity/Repair
A Structural MRI Study of Human Brain Development from
Birth to 2 Years
Rebecca C. Knickmeyer,
1Sylvain Gouttard,
2Chaeryon Kang,
3Dianne Evans,
1Kathy Wilber,
4J. Keith Smith,
4Robert M. Hamer,
1,3Weili Lin,
4Guido Gerig,
2and John H. Gilmore
11Department of Psychiatry, University of North Carolina, Chapel Hill, North Carolina 27599-7160,2Scientific Computing and Imaging Institute, University
of Utah, Salt Lake City, Utah 84112,3Department of Biostatistics, University of North Carolina, Chapel Hill, North Carolina 27599-7420, and4Department of
Radiology, University of North Carolina, Chapel Hill, North Carolina 27599-7510
Brain development in the first 2 years after birth is extremely dynamic and likely plays an important role in neurodevelopmental
disorders, including autism and schizophrenia. Knowledge regarding this period is currently quite limited. We studied structural brain
development in healthy subjects from birth to 2. Ninety-eight children received structural MRI scans on a Siemens head-only 3T scanner
with magnetization prepared rapid gradient echo T1-weighted, and turbo spin echo, dual-echo (proton density and T2 weighted)
se-quences: 84 children at 2– 4 weeks, 35 at 1 year and 26 at 2 years of age. Tissue segmentation was accomplished using a novel automated
approach. Lateral ventricle, caudate, and hippocampal volumes were also determined. Total brain volume increased 101% in the first
year, with a 15% increase in the second. The majority of hemispheric growth was accounted for by gray matter, which increased 149% in
the first year; hemispheric white matter volume increased by only 11%. Cerebellum volume increased 240% in the first year. Lateral
ventricle volume increased 280% in the first year, with a small decrease in the second. The caudate increased 19% and the hippocampus
13% from age 1 to age 2. There was robust growth of the human brain in the first two years of life, driven mainly by gray matter growth.
In contrast, white matter growth was much slower. Cerebellum volume also increased substantially in the first year of life. These results
suggest the structural underpinnings of cognitive and motor development in early childhood, as well as the potential pathogenesis of
neurodevelopmental disorders.
Key words:
brain development; cortex; children; magnetic resonance imaging; hippocampus; caudate
Introduction
Quantitative magnetic resonance imaging has significantly
ad-vanced our understanding of brain development during
child-hood and adolescence. Several large scale longitudinal studies
have been published (Giedd et al., 1999; Sowell et al., 2004).
However, none of these large scale studies included children
be-low the age of 4 years. This represents a serious gap in current
knowledge, as these early years, particularly the period from birth
to 2, may be the most dynamic and important phase of postnatal
brain development in humans. This period is likely to be critical
in neurodevelopmental disorders including autism and
schizo-phrenia. There is a dramatic increase in overall brain size during
this period, with the brain reaching 80 –90% of adult volume by
age 2 (Pfefferbaum et al., 1994). The rapid elaboration of new
synapses in the first two years of life (Huttenlocher and
Dab-holkar, 1997; Glantz et al., 2007) corresponds with an increase in
overall gray matter volumes to a lifetime maximum around age 2
(Hu¨ppi et al., 1998; Matsuzawa et al., 2001; Gilmore et al., 2007b).
Myelination of white matter proceeds rapidly after birth. The
general pattern of adult myelination is present by the end of the
second year (Sampaio and Truwit, 2001), although myelination
does continue, at a slower rate, far into adulthood. Concurrent
with the rapid pace of structural brain development is an equally
rapid development of a wide range of cognitive and motor
func-tions (Kagan and Herschkowitz, 2005).
Most MRI studies of infants and young children have focused on
those born prematurely (Hu¨ppi et al., 1998; Peterson et al., 2003;
Aljabar et al., 2008). Gray and white matter volume did increase
significantly in the perinatal period in a small control group in two
prospective studies of premature infants (Hu¨ppi et al., 1998;
Peter-son et al., 2003). Another study including a few children under the
age of 4 –5 also found that white and gray matter volume increased in
the first few years of life, although the gray and white matter
segmen-tation used in this study did not work well in younger subjects
(Mat-suzawa et al., 2001). This relative lack of data reflects the difficulties
in performing MRI studies in infants and young children. Practical
issues include subject cooperation and motion. Image analysis
pre-sents multiple challenges including low contrast to noise ratio, high
variability and small size of anatomical shapes, rapid changes as a
function of age, and contrast changes and brightness
inhomogene-ities attributable to myelination (Prastawa et al., 2005).
Received July 24, 2008; revised Sept. 24, 2008; accepted Oct. 4, 2008.
This work was supported by National Institute of Mental Health Conte Center Grants MH064065 (J.H.G.), HD053000 (J.H.G.), HD03110 (G.G.), HD40127 (R.C.K.), and MH019111 (R.C.K). We thank Joe Blocher, Dr. Martin Styner, Dr. Liesa Glantz, Meghan Casey, Mike Graves, Rachel Gimpel-Smith, and Matthew Santelli for technical assistance and valuable discussions. We also thank the participating families who have made this project possible. Correspondence should be addressed to John H. Gilmore, Department of Psychiatry, 7025 Neurosciences Hospi-tal, Campus Box #7160, University of North Carolina, Chapel Hill, NC 27599-7160. E-mail: [email protected].
DOI:10.1523/JNEUROSCI.3479-08.2008
Our group is carrying out a large-scale, prospective,
longitu-dinal MRI study of early brain development in a general
popula-tion sample. This is the first developmental MRI study in this age
range which utilizes a high-resolution 3 Tesla scanner and novel
automatic methods for tissue segmentation and parcellation,
which are highly accurate, reliable, and efficient (Hazlett et al.,
2005; Prastawa et al., 2005; Gilmore et al., 2007b). We previously
reported data on 74 neonates scanned at 2– 4 weeks of age
(Gil-more et al., 2007b). In the present study, we present initial results
on structural brain development from birth to 2 years.
Materials and Methods
Subjects.The 98 children (49 male, 49 female; 82 White, 14 African-American, 2 Asian) analyzed in this report are controls in an ongoing longitudinal study of prenatal and neonatal brain development in chil-dren at high risk for neurodevelopmental disorders. Control mothers were recruited during the second trimester of pregnancy from the out-patient Obstetrics and Gynecology Clinics at the University of North Carolina (UNC) Hospitals. Exclusion criteria at recruitment were the presence of abnormalities on fetal ultrasound or major medical or psy-chotic illness in the mother. 153 children attended for MRI at 2– 4 weeks of age; 94 of these had high quality T1 and T2 scans (a success rate of 60%). Eighty-six children attended for a follow-up MRI at age 1; 42 of these had high quality T1 and T2 scans (a success rate of 50%). Sixty-seven children attended for a follow-up MRI at age 2; 35 of these have high quality T1 and T2 scans (a success rate of 50%). Additional exclu-sion criteria for this analysis included gestational age⬍34 weeks (n⫽2), spending⬎24 h in the neonatal intensive care unit after birth (n⫽7), a composite score of⬍71 on the Mullen scales of early development (Mullen, 1995) at either age 1 or age 2 (n⫽3), major congenital abnor-mality (n⫽0), history of major medical illness (n⫽1), and major abnormality on MRI (n⫽4). Twenty-three subjects had small incidental intracranial hemorrhages, which are present in⬃25% of vaginal births (Looney et al., 2007); these subjects are included in the analysis. Two children had febrile seizures; these subjects are also included in the anal-ysis. After applying the above exclusion criteria, high quality scans are available for 84 neonates (2– 4 weeks of age), 35 one year olds, and 26 two year olds. The sample is largely cross-sectional (Table 1); thus, when interpreting our results the possibility of cohort effects should be kept in mind. Written informed consent was obtained from a parent before participation. This study was approved by the Institutional Review Board of the University of North Carolina School of Medicine. Demographic data on the sample is found in Table 2.
Image acquisition.Magnetic resonance imaging was performed at the UNC MRI Research Center on a Siemens head-only 3T scanner (Allegra; Siemens Medical System). All subjects were studied without sedation. Neonates fell asleep easily after being fed and swaddled regardless of the time of day. Subjects at 1 and 2 years were mildly sleep deprived (i.e., parents were asked to wake the child 1 h early that day and to skip a nap). Scans were scheduled to coincide with the child’s normal naptime or bedtime. Once a child was asleep, they were fitted with earplugs or ear-phones and placed in the MRI scanner with head in a Vac-Fix immobi-lization device, and additional foam padding to diminish the sounds of the scanner. Neonatal scans were performed with a neonatal nurse present and a pulse oximeter was used to monitor heart rate and oxygen
saturation. For older children, a member of the research team remained in the scanner room to monitor the child throughout the scan.
For the majority of the scans, T1-weighted images were obtained using a three-dimensional (3D) spoiled gradient [FLASH repetition time (TR)/ echo time (TE)/Flip Angle 15/7 ms/25°]. Fifteen of the early neonatal scans used a 3D magnetization prepared rapid gradient echo (TR/inver-sion time (TI)/TE/Flip Angle 1820/400/4.38 ms/7°) T1 sequence. Proton density and T2-weighted images were obtained with a turbo spin echo (TR/TE1/TE2/Flip Angle 6200/20/119 ms/150°). Spatial resolution was 1⫻1⫻1 mm voxel for T1-weighted images and 1.25⫻1.25⫻1.5 mm voxel with 0.5 mm interslice gap for proton density/T2-weighted images. The Siemens head-only 3T scanner is FDA approved for use in all age groups. Specific absorption rates are kept within safe levels for body weight by both hardware and software features of the scanner. We have previously confirmed that the scan sequences did not cause significant temperature increases with a phantom (Gilmore et al., 2004).
Tissue segmentation: neonates.Brain tissue was classified as gray mat-ter, nonmyelinated white matmat-ter, myelinated white matter and CSF using an automatic, atlas-moderated expectation maximization segmentation tool as previously described (Prastawa et al., 2005; Gilmore et al., 2007b). Segmentations for 4 of the 84 scans collected in neonates were deemed poor quality. These scans were not included in the analysis of tissue volumes, but are included in the analysis of ventricle volume.
Tissue segmentation: age 1 and 2. The 1-year-old brain presents a unique set of challenges for tissue segmentation as white matter is inho-mogeneous and provides high contrast interiorly while presenting grad-ually lower contrast toward the cortical periphery. In addition, white matter contrast in T2 lags behind T1, reflecting different properties of the early developing brain. To address this, we used a newly developed method for correction of white matter inhomogeneity as a preprocessing for classification of gray and white matter. Only the T1 image was used for segmentation. We used a well established automatic brain tissue seg-mentation method (expectation maximization segseg-mentation) which in-tegrates bias correction, brain stripping, and tissue classification into one tool (Van Leemput et al., 1999; Prastawa et al., 2004). A probabilistic infant brain atlas serves as geometric prior. The same method was used to segment the 2-year-old brain.
All scans were reviewed by an anatomical expert to determine if the results of the tissue segmentation were accurate. Segmentations for 5 of the 35 scans collected at age 1 were deemed poor quality. These scans were not included in the analysis of tissue volumes but are included in the analysis of ventricle, hippocampal, and caudate volumes.
Parcellation. Parcellation of each subject’s brain into regions was achieved in the neonate by nonlinear warping of a parcellation atlas template as previously described (Hazlett et al., 2005; Gilmore et al., 2007b). An affine registration was used in the 1 and 2 year olds. Left and right hemispheres, cerebellum, brainstem and combined sets of subcor-tical structures are represented separately.
Subcortical structures.Measurement of the lateral ventricles at all ages, and measurement of the caudate and hippocampus at age 1 and age 2, were obtained using standardized tracing protocols. The lateral ventricles and caudate were defined on high resolution T1 images using a semiau-tomated 3D segmentation tool [ITK-SNAP (Yushkevich et al., 2006)] that employs a user-defined threshold window, initialization, and pa-rameters for 3D deformable segmentation based on level sets. The hip-pocampus was obtained using a semiautomated tool where the user de-fines landmarks, but the hippocampus is automatically segmented via a
Table 1. Distribution of scan availability
Available scans N
Neonate scan only 50
1 year scan only 7
2 year scan only 1
Neonate⫹1 year scan 15
Neonate⫹2 year scan 12
1 year⫹2 year scan 6
Neonate⫹1 year⫹2 year scan 7
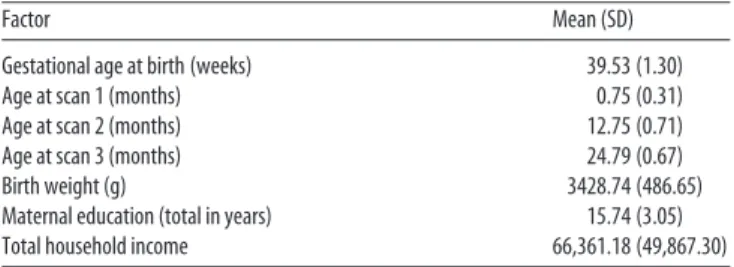
Table 2. Demographic data for participants
Factor Mean (SD)
Gestational age at birth (weeks) 39.53 (1.30) Age at scan 1 (months) 0.75 (0.31) Age at scan 2 (months) 12.75 (0.71) Age at scan 3 (months) 24.79 (0.67)
Birth weight (g) 3428.74 (486.65)
Maternal education (total in years) 15.74 (3.05) Total household income 66,361.18 (49,867.30)
high-dimensional deformation of a shape tem-plate [MOJO (Csernansky et al., 1998; Joshi et al., 2004)]. A single rater performed all segmen-tations for a specific structure. For the lateral ventricles, intrarater reliability was 0.99; for the caudate, intrarater reliability was 0.93; and for the hippocampus, intrarater reliability was 0.95. All reliabilities are intraclass correlations.
Data analysis.For all comparisons of brain volumes between the three ages, we used a mixed model approach to repeated measures ANOVA or analysis of covariance using the method of restricted/residual maximum likeli-hood. We used an unstructured covariance ma-trix with sandwich (Empirical) estimation to model within-subject covariances. In this model, we examined the estimated changes over time. Also, the change from neonate to 1 year and change from 1 year to 2 years were compared to determine whether there were dif-ferent growth rates. All statistical hypothesis tests were conducted at a significance level of 0.05.
Results
Total brain volume and volumes of the
cortical hemispheres, subcortical area,
and cerebellum
Total brain volume (TBV) was calculated
by combining total gray matter and total
white matter as defined by the automatic
tissue segmentation. TBV increased by
101% in the first year (95% CI: 95–107%)
and by 15% in the second year (95% CI:
11–19%) (Figs. 1, 2). To put this in
con-text, TBV at 2– 4 weeks of age is
⬃
36% of
adult volume; TBV at 1 year is
⬃
72% of
adult volume, and TBV at 2 years is
⬃
83%
of adult volume [Comparison to adult
vol-umes is based on TBV of 58 healthy adults
who served as controls in Lieberman et al.
(2005). Adult subject characteristics are as
follows: mean (SD) age, 25.6 (4.1) years;
64% male; 61% Caucasian, 28% of African
descent, 3% Hispanic, and 8% Asian.].
The volume of the cortical hemispheres
in-creased by 88% in the first year (95% CI:
83–94%) and by 15% in the second year
(95% CI: 11–19%). The volume of the
subcortical area (including brainstem)
in-creased by 130% in the first year (95% CI:
126 –138%) and by 14% in the second year
(95% CI: 11–18%). The cerebellum
in-creased by a striking 240% from 2 weeks to
1 year (95% CI: 228 –253%), and increased
by 15% from 1 to 2 years of age (95% CI:
10 –19%) (Table 3; Fig. 2).
Volumes can be normalized by TBV to
calculate the ratio of tissue volumes and
anatomical regions relative to the full
brain. This allows one to identify regions experiencing
particu-larly rapid or slow growth relative to the full brain. When
nor-malized in this way, the subcortical region and cerebellum
con-tinued to show significant increases from birth to age 1, whereas
the cortical hemispheres decreased as a proportion of TBV.
Be-tween age 1 and age 2, only the cerebellum continued to show a
significant increase when normalized for TBV. An alternative
way of describing the relative growth of different regions is the
correlation between growth in different regions in the subset of
children with true longitudinal data. From age 0 to age 1, the
Figure 1. Example axial slices from a single subject at birth, 1, and 2 years. CSF (blue), GM (gray matter; green), myelinated WM (white matter; red), unmyelinated WM (brown).
Figure 2. Scatterplots showing brain growth in the first 2 years of life.a, Total brain volume by age at scan.b, Cortical hemispheres.c, Cerebellum.d, Subcortical region and brainstem.
strongest correlation was seen between the cerebellum and the
cortical hemispheres (Spearman correlation, 0.94; N
⫽
16).
Strong correlations were also seen between the subcortical area
and the cortical hemispheres (Spearman correlation, 0.73) and
between the subcortical area and the cerebellum (Spearman
cor-relation, 0.68). From age 1 to age 2, the strongest correlation was
seen between the cerebellum and the subcortical region
(Spear-man correlation, 0.92; N
⫽
9). Strong correlations were also seen
between the subcortical area and the cortical hemispheres
(Spear-man correlation, 0.82) and between the cortical hemispheres and
the cerebellum (Spearman correlation, 0.85). These correlations
are all large and not significantly different from each other.
Constituent tissues
Growth of the cortical hemispheres during this period appears to
primarily reflect gray matter growth. Total hemispheric gray
matter increased by 149% in the first year (95% CI: 143–155%)
and by 14% in the second year (95% CI: 11–18%). In contrast,
total hemispheric white matter increased by 11% in the first year
(95% CI: 6 –11%) and by 19% in the second year (95% CI: 13–
24%). When normalized for TBV, the percentage of gray matter
increased significantly in the first year and remained relatively
constant in the second year. The percentage of white matter
ac-tually decreased in the first and second year. Thus, the ratio of
hemispheric gray matter to white matter changes significantly in
the first year, from 1.26 to 2.84 (Fig. 3). White matter and gray
matter could not be accurately separated in the subcortical area
and cerebellum by the automatic segmentation and are not
reported.
Subcortical structures
The volume of the lateral ventricles increased 280% in the first
year of life (95% CI: 213–352%), with a nonsignificant decrease
of 8% in the second year (95% CI: 28%
decrease to 11% increase). However, when
normalized for TBV, lateral ventricle
vol-ume decreased in both the first and second
year. The caudate and hippocampus could
not be reliably identified in the neonate,
but total caudate volume increased by 19%
between 1 and 2 years of age (95% CI: 11–
26%); whereas total hippocampal volume
increased by 13% (95% CI: 7–20%). When
normalized for TBV, only caudate volume
increased significantly between 1 and 2
years of age. Patterns were similar when
left and right caudates and hippocampi
were examined separately.
Although our sample size is not ideal for examining subsets of
children, we did limited analyses on the effects of gender and
ethnicity. Mean TBV was larger in males than females at all ages
(95% CI: 2– 8%; 3–13%, and
⫺
1 to 8% for neonate, age 1, and age
2, respectively). This difference is slightly lower that that observed
for ICV in neonates, 9% (Gilmore et al., 2007b), and adults,
11.9 –14.6% (Gur et al., 1999; Raz et al., 2004). Growth patterns
across all regions and substructures appeared highly similar
be-tween the genders, with the interesting exception of ventricular
volume which dropped 1% between age 1 and age 2 in girls but
dropped 24% in boys in the same period. This result must be
treated with caution given the small sample size and high
vari-ability in ventricular volume. Results for all analyses were similar
when we examined only those children who were white.
Discussion
The results of the present analysis confirm and significantly
aug-ment previous reports of early brain developaug-ment in pediatric
subjects. The large increase in total brain volume in the first year
of life suggests that this is a critical period in which disruption of
developmental processes, as the result of innate genetic
abnor-malities or as a consequence of environmental insults, may have
long-lasting or permanent effects on brain structure and
func-tion. It is interesting to note that one of the most consistent
anatomical findings in young children with autism is that they
have larger-than-average heads (Bailey et al., 1993; Lainhart et al.,
1997; Stevenson et al., 1997). Magnetic resonance imaging
con-firms that these large heads contain abnormally large brains,
re-flecting enlargement of gray and white matter (Courchesne et al.,
2001; Hazlett et al., 2005). Retrospective analysis of head
circum-ference data in medical records indicates that this difcircum-ference
emerges in the first year of life (Hazlett et al., 2005), the period of
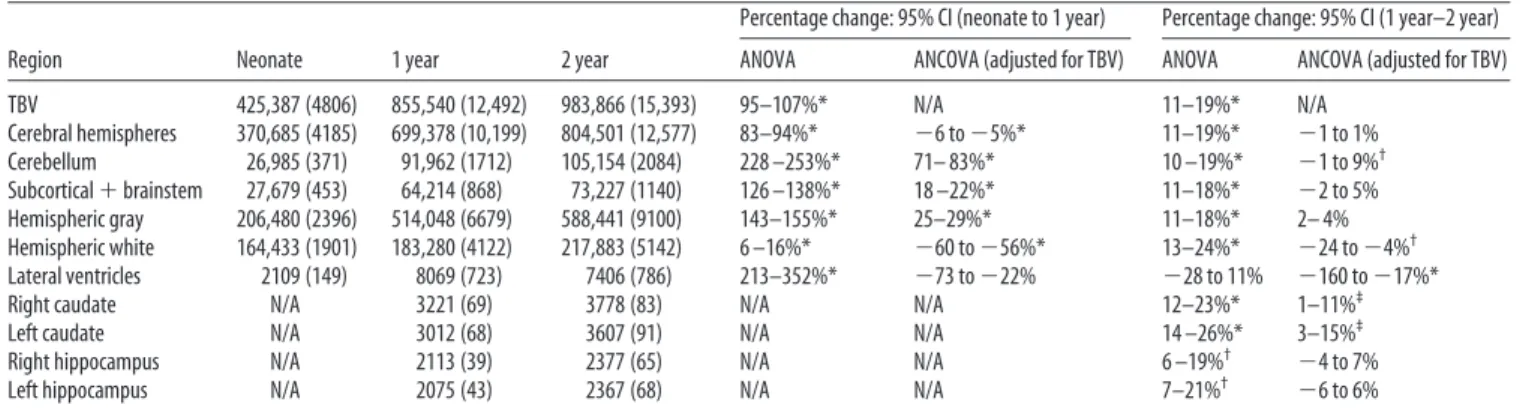
Table 3. Age-related changes in brain volumes
Region Neonate 1 year 2 year
Percentage change: 95% CI (neonate to 1 year) Percentage change: 95% CI (1 year–2 year) ANOVA ANCOVA (adjusted for TBV) ANOVA ANCOVA (adjusted for TBV) TBV 425,387 (4806) 855,540 (12,492) 983,866 (15,393) 95–107%* N/A 11–19%* N/A Cerebral hemispheres 370,685 (4185) 699,378 (10,199) 804,501 (12,577) 83–94%* ⫺6 to⫺5%* 11–19%* ⫺1 to 1% Cerebellum 26,985 (371) 91,962 (1712) 105,154 (2084) 228 –253%* 71– 83%* 10 –19%* ⫺1 to 9%† Subcortical⫹brainstem 27,679 (453) 64,214 (868) 73,227 (1140) 126 –138%* 18 –22%* 11–18%* ⫺2 to 5% Hemispheric gray 206,480 (2396) 514,048 (6679) 588,441 (9100) 143–155%* 25–29%* 11–18%* 2– 4% Hemispheric white 164,433 (1901) 183,280 (4122) 217,883 (5142) 6 –16%* ⫺60 to⫺56%* 13–24%* ⫺24 to⫺4%† Lateral ventricles 2109 (149) 8069 (723) 7406 (786) 213–352%* ⫺73 to⫺22% ⫺28 to 11% ⫺160 to⫺17%*
Right caudate N/A 3221 (69) 3778 (83) N/A N/A 12–23%* 1–11%‡
Left caudate N/A 3012 (68) 3607 (91) N/A N/A 14 –26%* 3–15%‡
Right hippocampus N/A 2113 (39) 2377 (65) N/A N/A 6 –19%† ⫺4 to 7%
Left hippocampus N/A 2075 (43) 2367 (68) N/A N/A 7–21%† ⫺6 to 6%
All volumes are mean (SD) in mm3. *p⬍0.0001,†p⬍0.001,‡pⱕ0.05. N/A, Not applicable.
Figure 3. Gray and white matter growth in the first two years of life.a, Scatterplot of absolute gray and white matter volumes by age at scan.b, Scatterplot of gray and white matter volumes as a percentage of total brain volume.
greatest brain volume growth in typical children. This suggests
that the enlarged head size in children with autism may be an
exaggeration of normal developmental processes in the first two
years of life, such as synaptic proliferation and myelination. This
period of rapid gray matter growth may also be important in the
ultimate development of the abnormal cortical connectivity
thought to underlie schizophrenia (Lewis and Levitt, 2002).
Although the first year of life may be a period of
developmen-tal vulnerability, it may also be a period in which therapeutic
interventions would have the greatest positive effect. Relevant
data are emerging from the Bucharest Early Intervention Project,
which is following a cohort of Romanian children who were
placed in foster care after experiencing extreme deprivation in
orphanages. One of the surprising findings from this study is that
children placed in foster care before two years of age appear to be
making far better improvements in cognitive development than
those placed in foster care after the age of 2 (Nelson et al., 2007).
The profound changes in structural brain development we
ob-served may delineate this critical period in cognitive
develop-ment. Our results also suggest that there is a pressing clinical need
to identify children at risk for developmental disorders within the
first year of life and to initiate appropriate interventions.
Examination of constituent tissues in the cortical hemispheres
suggests that early growth is driven primarily by gray matter.
Although MRI is not currently capable of identifying the
neuro-developmental processes which underlie the observed volume
changes, postmortem human and nonhuman primate studies
reveal likely candidates. Although cells expressing markers which
are characteristic of migrating neuroblasts and early neurons
have been observed in the subventricular zone of human infants
(Weickert et al., 2000), neurogenesis and neuronal migration are
unlikely to account for the volume changes we observed as total
cortical neuron numbers at 0, 1, and 2 years are highly similar
(Shankle et al., 1999). It is more likely that the gray matter volume
increase reflects changes in neuropil, which is composed of
den-drites, axons, and glia. Intensive dendritic and axonal
arboriza-tion and spine growth occur during this period (Mrzljak et al.,
1990) and synaptic density also increases (Huttenlocher, 1979;
Glantz et al., 2007). In the first two years, growth may be most
pronounced in cortical layers II and III (Zecevic et al., 1989;
Huttenlocher and Dabholkar, 1997; Landing et al., 2002).
As regards glia, a study of the striate cortex in rhesus monkeys
showed a 10-fold increase in oligodendrocytes from birth to
ma-turity. In contrast, the number of astrocytes and microglia
ap-peared constant in early postnatal development (O’Kusky and
Colonnier, 1982). The absolute increase in hemispheric white
matter is likely to reflect myelination by oligodendrocytes; a
pro-cess that will continue throughout childhood and adolescence
and well into adulthood (Yakovlev and Lecours, 1967; Benes et
al., 1994; Lenroot and Giedd, 2006). Increased volume
attribut-able to myelination may be partially offset by axon elimination
(LaMantia and Rakic, 1990; Low and Cheng, 2006). Although we
have shown a striking difference in the developmental trajectories
of hemispheric gray and white matter volume and significant
changes in the ratio of gray to white matter during this period;
this should not distract from the reciprocal relationships that
exist between neurons, glia, and myelin. Within the developing
nervous system, astrocytes and Schwann cells actively promote
synapse formation and function (Allen and Barres, 2005),
whereas neuron activity promotes the proliferation and survival
of oligodendrocytes and the production of myelin (Simons and
Trajkovic, 2006). The functional consequences of the dramatic
change in the proportion of gray to white matter in the first year
of life will be a fruitful area for future research using diffusion
tensor imaging (DTI) and functional MRI. DTI has already
shown striking changes in the corpus callosum and corticospinal
tracts in the first 2 years of life (Gilmore et al., 2007a; Goodlett et
al., 2008).
We observed a remarkable 240% increase in the size of the
cerebellum in the first year. Although the relations between the
size of brain structures and specific cognitive functions are not
always clear, area size can influence performance of
modality-specific behaviors (Leinga¨rtner et al., 2007). Because the
cerebel-lum is critically involved in motor coordination and balance
(Bastian and Thach, 2002), the striking cerebellar growth may
underpin the rapid motor developments of infancy. The
cerebel-lum has also been implicated in a plethora of other cognitive
abilities including planning, set-shifting, language abilities,
ab-stract reasoning, working memory, and visual-spatial
organiza-tion (Schmahmann and Sherman, 1998). Given that “cognitive”
regions of the cerebellum have reciprocal projections with
non-primary frontal, parietal, and occipital association cortex (Thach,
1996), the extremely rapid growth of the cerebellum in the first
year may be a prerequisite for specific aspects of later cortical
development. DTI and functional MRI studies of the developing
connections between the cerebellum and the cortex may shed
light on this relationship. As with the overall increase in brain
size, the rapid growth of the cerebellum in the first year suggests
that this may be a time of heightened vulnerability of the
cerebel-lum, which shows preferential susceptibility to environmental
insults such as alcohol, lead, and anoxia. Postnatal neurogenesis
of cerebellar Purkinje cells may be related to this environmental
susceptibility (Welsh et al., 2002), although the relationship
be-tween this process and the volumetric changes we observed
re-mains to be clarified.
We also observed a large increase in the volume of the lateral
ventricles in the first year, followed by a small decrease in volume
in the second. It is unclear at this point how volume changes in
the lateral ventricles relate to overall brain growth and the
devel-opment of adjacent subcortical structures. We will explore these
relationships in greater detail using shape analysis of the
ventri-cles and surrounding structures. An antagonistic relationship
be-tween ventricles and subcortical nuclei is observed in certain
pathological conditions, where atrophy of the basal ganglia or
thalamus is associated with increased ventricular volume (Harris
et al., 1999; Gaser et al., 2004). In addition, a study of
monozy-gotic and dizymonozy-gotic twins showed significant negative genetic and
environmental correlations between lateral ventricle and basal
ganglia volumes (Schmitt et al., 2007). It is not clear why ventricle
volume would increase in the first year and decrease in the second
year of life, given continued growth of subcortical and cortical
structures. One possibility is that closure of the fontanelles
(un-ossified gaps between the calvarial bones) limits outward growth
of the brain in the second year, with growth now impinging on
the lateral ventricles.
Finally, we reported that the caudate and hippocampus
creased in volume from 1 to 2 years, but only the caudate
in-creased when normalized for TBV. This suggests that different
subcortical structures have different developmental trajectories
during this period. The caudate is crucial in the control of
move-ment (Herrero et al., 2002). Therefore, growth in this region may
relate to motor development. The relatively small growth of the
hippocampus may still have functional consequences for
cogni-tive tasks linked to this structure, including spatial (Maguire et
al., 1997) and episodic memory (Lencz et al., 1992; Goldberg et
al., 1994). Although direct comparison to the single existing MRI
study of early hippocampal growth is difficult because of differing
methodologies, our results are broadly compatible with those of
Utsunomiya et al. (1999) who report a 5% difference in
hip-pocampal volume when comparing children between 1 and 2
years of age with those between 3 and 4 years of age.
In conclusion, we observed rapid growth of the entire brain
during the first year of life, with slower growth during the second
year of life. Compared with the cortical hemispheres, the
cerebel-lum showed disproportionate enlargement in this period. Within
the cortical hemispheres, gray matter volume increased
signifi-cantly more than white matter volume and the proportion of gray
to white matter changed markedly. Unique growth patterns were
also observed in the ventricles, caudate, and hippocampus. These
findings can provide insight into pathologies of development
such as autism and schizophrenia and may ultimately allow us to
define structural correlates of critical periods in human cognitive
development.
References
Aljabar P, Bhatia KK, Murgasova M, Hajnal JV, Boardman JP, Srinivasan L, Rutherford MA, Dyet LE, Edwards AD, Rueckert D (2008) Assessment of brain growth in early childhood using deformation-based morphom-etry. Neuroimage 39:348 –358.
Allen NJ, Barres BA (2005) Signaling between glia and neurons: focus on synaptic plasticity. Curr Opin Neurobiol 15:542–548.
Bailey A, Luthert P, Bolton P, Le Couteur A, Rutter M (1993) Autism and megalencephaly. Lancet 341:1225–1226.
Bastian A, Thach WT (2002) Structure and function of the cerebellum. In: The cerebellum and its disorders (Manto M, Pandolfo M, eds), pp 49 – 66. Cambridge, UK: Cambridge UP.
Benes FM, Turtle M, Khan Y, Farol P (1994) Myelination of a key relay zone in the hippocampal-formation occurs in the human brain during child-hood, adolescence, and adulthood. Arch Gen Psychiatry 51:477– 484. Courchesne E, Karns CM, Davis HR, Ziccardi R, Carper RA, Tigue ZD,
Chi-sum HJ, Moses P, Pierce K, Lord C, Lincoln AJ, Pizzo S, Schreibman L, Haas RH, Akshoomoff NA, Courchesne RY (2001) Unusual brain growth patterns in early life of patients with autistic disorder. Neurology 57:245–254.
Csernansky JG, Joshi S, Wang L, Haller JW, Gado M, Miller JP, Grenander U, Miller MI (1998) Hippocampal morphometry in schizophrenia by high dimensional brain mapping. Proc Natl Acad Sci U S A 95:11406 –11411. Gaser C, Nenadic I, Buchsbaum BR, Hazlett EA, Buchsbaum MS (2004) Ventricular enlargement in schizophrenia related to volume reduction of the thalamus, striatum, and superior temporal cortex. Am J Psychiatry 161:154 –156.
Giedd JN, Blumenthal J, Jeffries NO, Castellanos FX, Liu H, Zijdenbos A, Paus T, Evans AC, Rapoport JL (1999) Brain development during childhood and adolescence: a longitudinal MRI study. Nat Neurosci 2:861– 863. Gilmore JH, Zhai G, Wilber K, Smith JK, Lin W, Gerig G (2004) 3T
mag-netic resonance imaging of the brain in newborns. Psychiatry Res 132:81– 85.
Gilmore JH, Lin W, Corouge I, Vetsa YS, Smith JK, Kang C, Gu H, Hamer RM, Lieberman JA, Gerig G (2007a) Early postnatal development of corpus callosum and corticospinal white matter assessed with quantita-tive tractography. Am J Neuroradiol 28:1789 –1795.
Gilmore JH, Lin W, Prastawa MW, Looney CB, Vetsa YS, Knickmeyer RC, Evans DD, Smith JK, Hamer RM, Lieberman JA, Gerig G (2007b) Re-gional gray matter growth, sexual dimorphism, and cerebral asymmetry in the neonatal brain. J Neurosci 27:1255–1260.
Glantz LA, Gilmore JH, Hamer RM, Lieberman JA, Jarskog LF (2007) Syn-aptophysin and postsynaptic density protein 95 in the human prefrontal cortex from mid-gestation into early adulthood. Neuroscience 149:582–591.
Goldberg TE, Torrey EF, Berman KF, Weinberger DR (1994) Relations be-tween neuropsychological performance and brain morphological and physiological measures in monozygotic twins discordant for schizophre-nia. Psychiatry Res 55:51– 61.
Goodlett CB, Fletcher PT, Gilmore JH, Gerig G (2008) Group analysis of DTI fiber tract statistics with application to neurodevelopment. Neuro-image, in press.
Gur RC, Turetsky BI, Matsui M, Yan M, Bilker W, Hughett P, Gur RE (1999) Sex differences in brain gray and white matter in healthy young adults: Correlations with cognitive performance. J Neurosci 19:4065– 4072. Harris GJ, Codori AM, Lewis RF, Schmidt E, Bedi A, Brandt J (1999)
Re-duced basal ganglia blood flow and volume in pre-symptomatic, gene-tested persons at-risk for Huntington’s disease. Brain 122:1667–1678. Hazlett HC, Poe M, Gerig G, Smith RG, Provenzale J, Ross A, Gilmore J, Piven
J (2005) Magnetic resonance imaging and head circumference study of brain size in autism - birth through age 2 years. Arch Gen Psychiatry 62:1366 –1376.
Herrero MT, Barcia C, Navarro JM (2002) Functional anatomy of thalamus and basal ganglia. Childs Nerv Syst 18:386 – 404.
Hu¨ppi PS, Warfield S, Kikinis R, Barnes PD, Zientara GP, Jolesz FA, Tsuji MK, Volpe JJ (1998) Quantitative magnetic resonance imaging of brain development in premature and mature newborns. Ann Neurol 43:224 –235.
Huttenlocher PR (1979) Synaptic density in human frontalcortex -developmental-changes and effects of aging. Brain Res 163:195–205. Huttenlocher PR, Dabholkar AS (1997) Regional differences in
synaptogen-esis in human cerebral cortex. J Comp Neurol 387:167–178.
Joshi S, Davis B, Jomier M, Gerig G (2004) Unbiased diffeomorphic atlas construction for computational anatomy. Neuroimage 23:S151–S160. Kagan J, Herschkowitz N (2005) A young mind in a growing brain.
Mah-wah, NJ: Erlbaum Associates.
Lainhart JE, Piven J, Wzorek M, Landa R, Santangelo SL, Coon H, Folstein SE (1997) Macrocephaly in children and adults with autism. J Am Acad Child Adolesc Psychiatry 36:282–290.
LaMantia AS, Rakic P (1990) Axon overproduction and elimination in the corpus-callosum of the developing rhesus-monkey. J Neurosci 10:2156 –2175.
Landing BH, Shankle WR, Hara J, Brannock J, Fallon JH (2002) The devel-opment of structure and function in the postnatal human cerebral cortex from birth to 72 months: changes in thickness of layers II and III co-relate to the onset of new age-specific behaviors. Pediatr Pathol Mol Med 21:321–342.
Leinga¨rtner A, Thuret S, Kroll TT, Chou SJ, Leasure JL, Gage FH, O’Leary DD (2007) Cortical area size dictates performance at modality-specific be-haviors. Proc Natl Acad Sci U S A 104:4153– 4158.
Lencz T, McCarthy G, Bronen RA, Scott TM, Inserni JA, Sass KJ, Novelly RA, Kim JH, Spencer DD (1992) Quantitative magnetic-resonance-imaging in temporal-lobe epilepsy - relationship to neuropathology and neuro-psychological function. Ann Neurol 31:629 – 637.
Lenroot RK, Giedd JN (2006) Brain development in children and adoles-cents: Insights from anatomical magnetic resonance imaging. Neurosci Biobehav Rev 30:718 –729.
Lewis DA, Levitt P (2002) Schizophrenia as a disorder of neurodevelop-ment. Annu Rev Neurosci 25:409 – 432.
Lieberman JA, Tollefson GD, Charles C, Zipursky R, Sharma T, Kahn RS, Keefe RS, Green AI, Gur RE, McEvoy J, Perkins D, Hamer RM, Gu H, Tohen M (2005) Antipsychotic drug effects on brain morphology in first-episode psychosis. Arch Gen Psychiatry 62:361–370.
Looney CB, Smith JK, Merck LH, Wolfe HM, Chescheir NC, Hamer RM, Gilmore JH (2007) Intracranial hemorrhage in asymptomatic neonates: prevalence on MR images and relationship to obstetric and neonatal risk factors. Radiology 242:535–541.
Low LK, Cheng HJ (2006) Axon pruning: an essential step underlying the developmental plasticity of neuronal connections. Philos Trans R Soc Lond B Biol Sci 361:1531–1544.
Maguire EA, Frackowiak RS, Frith CD (1997) Recalling routes around Lon-don: activation of the right hippocampus in taxi drivers. J Neurosci 17:7103–7110.
Matsuzawa J, Matsui M, Konishi T, Noguchi K, Gur RC, Bilker W, Miyawaki T (2001) Age-related volumetric changes of brain gray and white matter in healthy infants and children. Cereb Cortex 11:335–342.
Mrzljak L, Uylings HB, Van Eden CG, Juda´s M (1990) Neuronal develop-ment in human prefrontal cortex in prenatal and postnatal stages. Prog Brain Res 85:185–222.
Mullen EM (1995) Mullens scales of early development. In: American Guid-ance Service. Circle Pines, MN: American GuidGuid-ance Service.
Nelson CA 3rd, Zeanah CH, Fox NA, Marshall PJ, Smyke AT, Guthrie D (2007) Cognitive recovery in socially deprived young children: the Bu-charest early intervention project. Science 318:1937–1940.
O’Kusky J, Colonnier M (1982) Postnatal Changes in the number of astro-cytes, oligodendroastro-cytes, and microglia in the visual-Cortex (area-17) of the macaque monkey - a stereological analysis in normal and monocularly deprived animals. J Comp Neurol 210:307–315.
Peterson BS, Anderson AW, Ehrenkranz R, Staib LH, Tageldin M, Colson E, Gore JC, Duncan CC, Makuch R, Ment LR (2003) Regional brain vol-umes and their later neurodevelopmental correlates in term and preterm infants. Pediatrics 111:939 –948.
Pfefferbaum A, Mathalon DH, Sullivan EV, Rawles JM, Zipursky RB, Lim KO (1994) A quantitative magnetic-resonance-imaging study of changes in brain morphology from infancy to late adulthood. Arch Neurol 51:874 – 887.
Prastawa M, Bullitt E, Ho S, Gerig G (2004) A brain tumor segmentation framework based on outlier detection. Med Image Anal 8:275–283. Prastawa M, Gilmore JH, Lin W, Gerig G (2005) Automatic segmentation of
MR images of the developing newborn brain. Med Image Anal 9:457– 466. Raz N, Gunning-Dixon F, Head D, Rodrigue KM, Williamson A, Acker JD (2004) Aging, sexual dimorphism, and hemispheric asymmetry of the cerebral cortex: replicability of regional differences in volume. Neurobiol Aging 25:377–396.
Sampaio RC, Truwit CL (2001) Myelination in the developing brain. In: Handbook of developmental cognitive neuroscience (Nelson CA, Luci-ana M, eds), pp 35– 44. Cambridge, MA: MIT.
Schmahmann JD, Sherman JC (1998) The cerebellar cognitive affective syn-drome. Brain 121:561–579.
Schmitt JE, Wallace GL, Rosenthal MA, Molloy EA, Ordaz S, Lenroot R, Clasen LS, Blumenthal JD, Kendler KS, Neale MC, Giedd JN (2007) A multivariate analysis of neuroanatomic relationships in a genetically in-formative pediatric sample. Neuroimage 35:70 – 82.
Shankle WR, Rafii MS, Landing BH, Fallon JH (1999) Approximate dou-bling of numbers of neurons in postnatal human cerebral cortex and in 35 specific cytoarchitectural areas from birth to 72 months. Pediatr Dev Pathol 2:244 –259.
Simons M, Trajkovic K (2006) Neuron-glia communication in the control
of oligodendrocyte function and myelin biogenesis. J Cell Sci 119:4381– 4389.
Sowell ER, Thompson PM, Leonard CM, Welcome SE, Kan E, Toga AW (2004) Longitudinal mapping of cortical thickness and brain growth in normal children. J Neurosci 24:8223– 8231.
Stevenson RE, Schroer RJ, Skinner C, Fender D, Simensen RJ (1997) Autism and macrocephaly. Lancet 349:1744 –1745.
Thach WT (1996) On the specific role of the cerebellum in motor learning and cognition: clues from PET activation and lesion studies in humans. Behav Brain Sci 19:411– 431.
Utsunomiya H, Takano K, Okazaki M, Mitsudome A (1999) Development of the temporal lobe in infants and children: analysis by MR-based volu-metry. Am J Neuroradiol 20:717–723.
Van Leemput K, Maes F, Vandermeulen D, Suetens P (1999) Automated model-based bias field correction of MR images of the brain. IEEE Trans Med Imaging 18:885– 896.
Weickert CS, Webster MJ, Colvin SM, Herman MM, Hyde TM, Weinberger DR, Kleinman JE (2000) Localization of epidermal growth factor recep-tors and putative neuroblasts in human subependymal zone. J Comp Neurol 423:359 –372.
Welsh JP, Yuen G, Placantonakis DG, Vu TQ, Haiss F, O’Hearn E, Molliver ME, Aicher SA (2002) Why do Purkinje cells die so easily after global brain ischemia? Aldolase C, EAAT4, and the cerebellar contribution to posthypoxic myoclonus. Adv Neurol 89:331–359.
Yakovlev P, Lecours A (1967) The myelogenetic cycles of regional matura-tion of the brain. In: Regional development of the brain in early life (Minkowski A, ed), pp 3–70. Oxford: Blackwell.
Yushkevich PA, Piven J, Hazlett HC, Smith RG, Ho S, Gee JC, Gerig G (2006) User-guided 3D active contour segmentation of anatomical structures: Significantly improved efficiency and reliability. Neuroimage 31:1116 –1128.
Zecevic N, Bourgeois JP, Rakic P (1989) Changes in synaptic density in motor cortex of rhesus-monkey during fetal and postnatal life. Brain Res Dev Brain Res 50:11–32.