© Global Society of Scientific Research and Researchers
http://asrjetsjournal.org/
An Architecture for Big Data Analysis in the Context of
Social Media: The Case of Twitter
Belesti Melesse Asress
a*, Tibebe Beshah (PhD)
ba
MSc in Computer Science, HiLCoE School of Computer Science and Technology, Addis Ababa, Ethiiopia
b
Assistant Professor, School of Information Science, Addis Ababa University, Addis Ababa, Ethiopia
a
Email: [email protected]
b
Email: [email protected]
Abstract
Big Data analytics puts lots of pressure on ICT providers for developing new tools and technology to manage complex data. Challenges include storing and processing of huge volume of unstructured data, handling high-velocity data streams, cleansing noise and abnormality in the data, analyzing the data and finding value or meaning full results. Current tools and technologies are incapable to store, process and analyze huge amount of diverse data. In this research, we proposed an architecture that enables an effective storage and analysis of unstructured data, and developed a prototype to evaluate and test it. This research presents the work of investigating and designing a Big Data analysis solution using a MapReduce platform named Hadoop and a data warehouse infrastructure built on top of Hadoop called Hive which enables the analysis of unstructured data. The proposed architecture is validated through the development of a prototype that can analyze unstructured data using Hadoop MapReduce, HDFS (Hadoop File System), and Hive. We also evaluated whether this architecture is achieving its goals and objectives. The evaluation is conducted through streaming Twitter data, storing, processing, finally fetching and performing sentiment analysis. Twitter, one of the largest social media sites, is used as a data source in our experiment. Hence, this study provided an architecture that helps to address problems related to Big Data analysis and besides it is novel due to the use of MapReduce and Hive in a unique way for Twitter data analysis. The results of this work can be applied by enterprises in sentiment analysis to understand how their customers feel about a particular product or service and to track how those opinions change over time, and also to get information regarding the relative performances of their competitors.
--- * Corresponding author.
Keywords: Big Data analytics; Big Data analytics frameworks; unstructured data analysis; Big Data architecture.
1. Introduction
The emerging Big Data paradigm has recently attracted so much attention from industries, academicians and the world at large as it has a massive impact on society, the government, businesses, the way organizations are managed and operated, and eventually the global economy [1]. Big Data encloses large volume of complex structured, semi-structured, and data that is difficult to process using conventional approach and is unstructured in nature [2]. As far back as 2001, Doug Laney described the well-known definition of Big Data as the 3Vs of Big Data like volume, velocity and variety [3]. According to [1], there are five attributes to classify Big Data, as listed below.
• Volume: the size of the data to be managed [2].
• Velocity: the speed at which the data is being produced or the frequency with which it is delivered [4].
• Variety: the data form, i.e., structured, semi-structured, and unstructured [1].
• Veracity: It includes issues related to data quality like , incompleteness, errors, noise and other attributes affecting quality [5].
• Value: it refers to data usability and the practical possibilities of their use in decision-making and, consequently, to the possibility of generating important value for an organization [5].
Therefore Big Data refers to datasets which for one of many reasons (Volume, Velocity, Variety, Veracity, or Value) do not fit a conventional relational database [3]. Unstructured data is a phrase for describing information without a predefined data model [6].
1.1.Big Data analytics frameworks
Different types of frameworks are required to run different types of analytics. A variety of workloads present in large-scale data processing enterprise. To accomplish a business objective, it needs to see a blend of workloads deployed: batch-oriented processing, OLTP (Online Transaction Processing), stream processing, and interactive ad-hoc query [7].
• Apache Hadoop: Apache Hadoop is a software system that enables handling distributed processing of Big Data across clusters of commodity hardware. Hadoop is designed to scan large data set to yield results through a distributed and easily scalable batch processing systems [8].
• Project Storm: In order to carry out rigorous data processing in real- time, Storm has got developed. Storm is distributed real-time computation framework developed and released as open source by Twitter [2].
• Apache Drill: It is an open source and low-latency system for interactive ad-hoc analysis of large-scale datasets. Many times it allows delivering self-service data exploration capabilities on data stored in multiple formats that human sits in front of business application and need to execute ad-hoc queries as
per business needs. Apache drill will provide the solution for all these issues [7].
Apache Hadoop appears to be the standard for large scale batch processing whereas Project storm is well suited for data stream analysis in which analysis made is real time and Apache drill is best for interactive and ad-hoc analysis [7]. In line with this, Apache Hadoop has been preferred for this study.
1.2.The Hadoop framework
Hadoop analytics take a fundamental approach to a single large workload, mapping it into smaller sub-workloads and distributing them across nodes in a cluster. These smaller sub-workloads are then merged to obtain the end result. Hadoop clusters usually run MapReduce jobs in parallel, in addition to background activities such as importing/exporting data from Hadoop File System (HDFS) [6]. Apache Hadoop provides a distributed file system for data storage and a MapReduce analysis system for large scale data processing [3].
1.2.1.Hadoop Distributed File System (HDFS)
HDFS is defined by the Apache Hadoop project as the primary storage system used by Hadoop [3]. An HDFS cluster has two types of nodes: a NameNode (the master) and a number of DataNodes (workers). They operate as a master worker pattern. The NameNode handles the directory structure of the file system and tracks where the file data is kept in the cluster. On the other hand, DataNodes are the HDFS components that hold the actual data [9].
1.2.2.MapReduce
MapReduce is a tool for parallel processing of data sets in a distributed fashion across multiple nodes. It works based on the concept of splitting the data processing task into two phases of mapping and reducing [3]. Map Phase divides the workload into smaller sub-workloads and allocates tasks to mapper, which processes each unit block of data. Reduce phase analyzes and merges the input from mappers to produce the final output. The final output is then sent back to the HDFS in the cluster [6]. The MapReduce framework includes a single master Job tracker and multiple slave Task Trackers per cluster. The master node takes MapReduce jobs from client applications and manages all jobs and resources in the cluster. The slaves are where Map and Reduce tasks get executed as directed by the master [10].
1.2.3.HBase
It is a non-relational distributed database that sits on top of HDFS based on the Google’s Big Table. HBase cannot directly operate SQL ( Structured Query Language) [2]. HBase is highly configurable and fault-tolerant, providing a great deal of flexibility to address large volumes of data efficiently [11].
1.2.4. Hive
Hive is a batch-oriented and data-warehousing layer put up on the core elements of Hadoop (HDFS and
MapReduce). It provides users who know SQL with a simple SQL-like operation called Hive Query Language (HiveQL). So, it allows both HiveQL accesses to structured data and advanced Big Data analysis with MapReduce. Unlike most data warehouses, Hive is not designed for quick responses to queries [11]. Hive converts HiveQL query into a series of MapReduce jobs for implementation on a Hadoop cluster. It arranges data into tables, which provide a mechanism to attach structure onto this data [12].
1.2.5. Hue
Hue is an open source and web-based graphical user interface for making it easier to handle Apache Hadoop operations. Hue groups the most common Apache Hadoop components into a single configurable interface. Its main objective is to let the users just browse HDFS and work with Hadoop without worrying about using a command line [13, 14].
1.3.Related Works
These days, most of the information available in organizations is unstructured type. The prevailing challenge is the problem of turning unstructured data into Knowledge Discovery understanding that enables organizations to assist effective decision making. Das and Kumar (2013) developed a framework for analyzing unstructured data. Their proposed approach consists of acquiring unstructured data from public tweets of Twitter, storing the data in NOSQL database like HBase, and retrieving and analyzing the data. They investigated and tested the first phase, which is acquiring unstructured data from public tweets of Twitter. The processes used in the first phase are registering the application with the Twitter development, authenticating the application, sending the requests with java coding, and parsing the result as the XML (Extensible Markup Language) result produced need to be parsed for filtering [15]. However, there are many limitations in their research. Data acquired from Twitter were stored in HBase after sentiment analysis. Furthermore, MapReduce was not used either for processing or analyzing sentiments even though they are the core components of apache Hadoop. Therefore parallel processing of data during analysis is impossible in the system. Since HBase data requires java coding, business analysts who are supposed to use this solution need to have java knowledge and skills.
2. Methods
The objective of a research in information systems is to acquire knowledge and understanding that enable the development and application of technology-based solutions to unsolved and important business problems [16]. Design science, as one of the information systems research methodologies, creates and evaluates information technology artifacts intended to solve identified business problems. Design is essentially a search process to discover an effective solution to a problem. Problem solving can be perceived as utilizing available means to reach desired ends while satisfying laws existing in the environment [16].
The design science research process includes six steps: problem identification and motivation, objectives for a way out, design and development, evaluation, and communication. Communication refers to communicating the problem and its significance, the artifact, its utility and novelty, the rigor of its design, and its effectiveness to researchers and other relevant audiences [17]. Therefore, design-science research methodology has been chosen
for this study in order to produce a purposeful big data analysis artifact in the form of architecture to address important big data analysis problems. Because the artifact is purposeful, it has yielded a technology based solution for the specified problem.
3. The Proposed Architecture
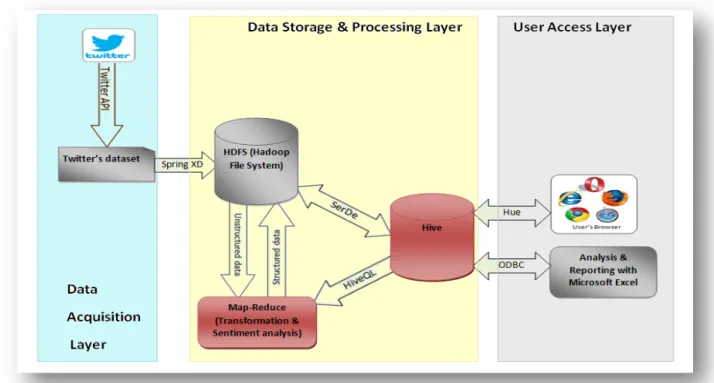
Recognizing the limitations in the framework presented by Das and Kumar (2013), we proposed a three layer architecture named data acquisition layer, data storage and processing layer, and user access layer. Hence, the novelty of our work lies in the storage and processing layer of the architecture by incorporating HDFS, MapReduce and Hive instead of HBase. Components of the architecture include Twitter API, HDFS storage, MapReduce, Hive, Hue and a front end application tool as it is described in Figure 1. The proposed architecture enables processing and analyzing Twitter datasets while addressing the limitations mentioned above and it has three layers. Twitter is chosen because Twitter postings are easier to analyze due to the length limit as the authors are usually straight to the point. Thus, it is often easier to attain high sentiment analysis accuracy. Reviews are also easier because they are highly focused with little irrelevant information [18].
3.1. Data acquisition layer
The first layer gets data from Twitter and makes the datasets ready to be taken by HDFS. This layer includes Twitter API and Twitter’s datasets.
3.1.1. Twitter API
These API employs the push strategy for data retrieval. Once a request for information is made, the Streaming APIs provide a steady stream of updates with no further input from the user. The limitations of Twitter APIs can be too restrictive for certain types of applications. The APIs only grant access to a 1% sample of the Twitter data, and concerns about the sampling mechanism and the quality of Twitter data obtained via the API. However, Twitter API works well for a lot of individuals that just want to access Twitter data for light analytics or statistical analysis and they are free to use [19]. Therefore, Twitter API is used to collect and download public tweets of Twitter; one is for cost reason and the other is data samples obtained with Twitter APIs are sufficient for experimenting with the proposed architecture [19]. Once an authorized API request is sent, Twitter database provides the data in JSON (Java Script Object Notation) format.
3.2. Data storage and processing layer
This layer stores and processes the Twitter datasets. This layer includes HDFS, MapReduce, and Hive as it is described below.
3.2.1. HDFS Storage
HDFS cluster is the storage structure in the architecture and hence it stores all the data in the system. It stores both the raw data and the data after being processed and analyzed. The HDFS cluster has two types of nodes
operating in a master-worker model: a NameNode (the master) and a number of DataNodes (slaves). The NameNode is responsible for maintaining the directory structure of the file system and tracking where each file data is kept in DataNodes of the Hadoop cluster. So it is the NameNode which knows what blocks on which data nodes make up the complete file where as the DataNodes are where data are actually stored.
Figure 1: the Proposed Architecture
3.2.2. Mapping and Reducing
The MapReduce cluster processes data sets in a distributed fashion. It works based on the concept of breaking the data processing task into two smaller jobs of mapping and reducing. It also works in master slave architecture: a JobTracker (the master) and a number of TaskTrackers (slaves). The MapReduce jobs break the input data set in to independent blocks. Then the master is responsible for dispatching jobs to TaskTrackers, keeping track of the job progress, re-executing the failed tasks, and returning the result to the storage. Then slaves perform the tasks as directed by the master.
3.2.3. Hive
In our architecture, we preferred Hive to HBase for many reasons. Hive converts SQL query into a series of MapReduce jobs for implementation on a MapReduce cluster [9]. Systems that require real-data processing can’t tolerate latency since they have to detect patterns and attempt to identify either opportunities or threats so as to take immediate actions. Some of them are real-time bidding system in stock market, credit (debit) card fraud detection system, heart rate monitoring system in hospitals, air craft control system, and traffic light system [20]. On the other hand, many business firms can handle analysis of customers’ tweets with Hive at least
every one or two hours while this latency is not affecting their business. In addition, HBase requires writing MapReduce codes with java which is not an issue in Hive [21].
3.2.4. Spring XD
Spring XD is a unified, distributed, and extensible assistance for data ingestion and data export. It offers high throughput data ingestion from different input sources into big data store such as HDFS, and high throughput data export from HDFS to Hive or HBase [22].
3.2.5. JSON SerDe (Serializer/Deserializer)
Hive uses the SerDe interface for input/output. The interface manages both serialization and de-serialization and also interpreting the outputs of serialization as individual fields for processing. JSON SerDe enables Hive to read from and write in to HDFS in JSON format [23].
3.3. User access layer
This layer provides access to processed data and used to manage analysis and report requests. It involves Microsoft Excel and web browsers as front end application tools. It also incorporates Open Database Connectivity (ODBC) and Hue web server to create connection between front end applications and Hive.
4. Results and Discussion
The validity of the architecture is warranted through the development of a prototype. The prototype has been done in a two node cluster environment in master slave architecture. The cluster is running Hadoop, MapReduce, HDFS, and Hive. Breen’s algorithm has been used in performing sentiment analysis in our research. The general idea is to calculate a sentiment score for each tweet that we can know how positive or negative is the posted message. There are different ways to calculate such scores. We have used a very simple yet useful approach [24].
Sentiment Score = Sum of Sentiment Scores of words in a tweet
Score of positive words is considered to be 1, score of negative words is considered to be -1, and score of neutral words is considered to be 0. Then the total score for a tweet is calculated by adding sentiment scores of words in a tweet. If Score is greater than 0, this means that the sentence has an overall 'positive opinion'. If Score less than 0, this means that the sentence has an overall 'negative opinion'. And if Score is equal to 0, then the sentence is considered to be a 'neutral opinion' [24].
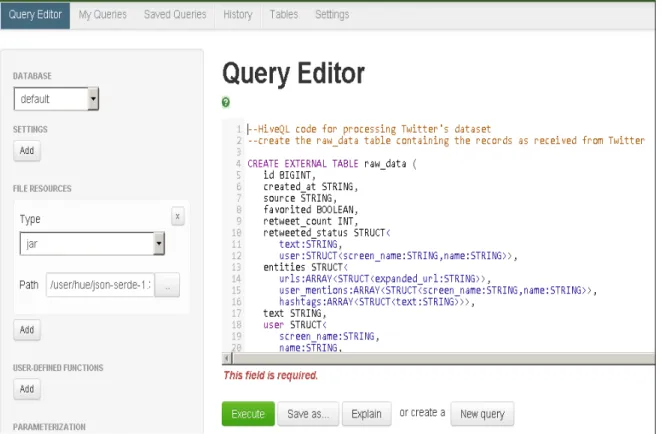
Subsequently sentiment dictionary and time-zone-map files have been downloaded [25] and stored together with the raw sentiment data. Then, a Hive script that can refine, transform, and analyze the raw sentiment data has been written in HiveQL (Hive Query Language). This script should be executed to clean the raw data, transform to structured data and compute sentiment score for each tweet as shown in Figure 2.
Figure 2: Executing Hive query
As it can be shown in Figure 3 below, with our sample data, the result shows that 17.86 percent of the tweets have positive opinion, 78.57 percent of the tweets have neutral opinions, and 3.57 percent of the tweets have negative opinions about Samsung Galaxy S6 mobile. Therefore, business analysts of Samsung Company can suggest possible actions to the responsible department so as to respond to the customers’ needs in appropriate way. It is also possible to make sentiment analysis of public tweets for other similar products in competitor companies. This comparison will provide the status of Samsung Galaxy S6 mobile in the eyes of customers among other products like iPhone and Huawei smart phones.
Figure 3: Sentiment summary 17.86% 78.57% 3.57%
Percent
Positive Neutral Negative 241Our results have suggested that the proposed Big Data solution is effective and it therefore added enhancement to the effectiveness of the framework proposed by Das and Kumar (2013). This is exhibited through the following points:
• It involved Hive, MapReduce, and HDFS.
The advantage of using MapReduce here is its ability in processing large sets of data in parallel, by distributing the jobs among the task tracker nodes in the cluster. A MapReduce job usually splits the input data-set into independent chunks which are processed by the map jobs in a completely parallel manner [11].
In using HDFS we also get multiple advantages. HDFS can store all kinds of data (both structured and unstructured data) without prior organization. In addition, HDFS stores the replicas of each data blocks on different DataNodes to provide both high speed data transfer and high availability of data [9].
Using Hive instead of HBase is another new feature of our architecture. Analyzing Hive data doesn’t require java coding rather it is done with HiveQL scripts, and HiveQL is already known by many business analysts since anyone familiar with SQL can interact to Hive with HiveQL [21].
• It allows storing unstructured data. As a Big Data analysis architecture, we should be able to store both structured and unstructured data in our system. This is made possible with the use of HDFS before and after data transformation and analysis
• Sentiment analysis is done by using sentiment analysis algorithm in MapReduce. Managing the sentiment analysis task with MapReduce provides better performance gain as MapReduce can do it with parallel processing using multiple task tracker nodes in the cluster.
• HiveQL is used to write or execute MapReduce jobs. Instead of writing MapReduce jobs in Java which demands serious software development skills, it is possible to write MapReduce jobs in HiveQL since Hive allows using HiveQL scripts [21].
Hence, our architecture is much better than the works of Das and Kumar (2013) as mentioned above. This is related with the use of HDFS and MapReduce in the Hadoop system and the use of Hive instead of HBase. In addition, we have shown that the analyst of an enterprise can get public Tweets about concerned products and services to make analysis and suggest appropriate actions for customers’ reaction effectively.
5. Conclusion and Recommendation
We have proposed a Big Data analysis architecture and we have also tried to show how the proposed solution could work by streaming Public tweets of Twitter, ingesting the raw data in to Hadoop system, and doing sentiment analysis during the experiment. We have also showed that raw twitter data sets can be stored in HDFS for future use and sentiment analysis can be done with MapReduce. Furthermore, a business analyst can easily be familiar to write HiveQL scripts to perform sentiment analysis on public tweets tracked from Twitter based on a given key word. Therefore, we believe that this proves the effectiveness of the proposed architecture. There are a lot of works that can be done in the future. The Hadoop and Hive newer versions have lots of bug fixes and
enhancements. We suggest upgrading and implementing it with newer versions to see if there are any improvements. We also suggest adjusting some configurations in Hadoop and Hive for an enhanced performance and efficiency. More over this research can be extended to other social media sources of Big Data like face book, LinkedIn, and You Tube.
This study will help business institutions in sentiment analysis to understand how their customers feel about a particular product or service and to track how those opinions change over time, and also to get information on how their competitors are doing in comparison. Hence, business organizations can deploy and use the result of this study to continuously monitor the feedbacks of their customers and take timely actions in response.
References
[1] Hu, H., et al., Towards Scalable Systems for Big Data Analytics: A Technology Tutorial. Access, IEEE 2014.
[2] Casado, R. and M. Younas, Emerging trends and technologies in Big Data processing. Concurrency and Computation: Practice and Experience, 2014.
[3] Kumar, R., et al., Apache Hadoop, NoSQL and NewSQL Solutions of Big Data. International Journal of Advance Foundation and Research in Science & Engineering (IJAFRSE). 1(6): p. 28-36.
[4] Zadrozny, P. and R. Kodali, Big Data and splunk, in Big Data Analytics Using Splunk. 2013, Springer. p. 1-7.
[5] Wieczorkowski, J. and P. Polak, Big Data: Three-aspect approach. Online Journal of Applied Knowledge Management.
[6] Bakshi, K. Considerations for Big Data: Architecture and approach. in Aerospace Conference, 2012 IEEE. 2012. IEEE.
[7] Chandarana, P. and M. Vijayalakshmi. Big Data analytics frameworks. in Circuits, Systems, Communication and Information Technology Applications (CSCITA), 2014 International Conference on. 2014. IEEE.
[8] Akerkar, R., Big Data computing. 2013: CRC Press.
[9] White, T., Hadoop: The definitive guide. 2012: " O'Reilly Media, Inc.".
[10] Hadoop, A. Hadoop 1.2.1 Documentation. MapReduce Tutorial. 2013 [cited 2015; Available from: http://hadoop.apache.org/docs/r1.2.1/mapred_tutorial.html#Example%3A+WordCount+v1.0.
[11] Nugent, A., F. Halper, and M. Kaufman, Big Data for dummies. 2013: John Wiley & Sons.
[12] ActivSteps. Practical Data Science. 2013 [cited 2015; Available from: http://www.datascience- labs.com/hive/hiveql-data-definition/.
[13] services, A.w. Amazon Elastic MapReduce. 2009 [cited 2015; Available from: http://docs.aws.amazon.com/ElasticMapReduce/latest/DeveloperGuide/what-is-hue.html.
[14] cloudera. Hue Installation Guide. [cited 2015; Available from: http://cloudera.github.io/hue/docs-2.0.1/manual.html#_introduction.
[15] Das, T. and P.M. Kumar, Big Data analytics: A framework for unstructured data analysis. International Journal of Engineering Science & Technology, 2013. 5(1): p. 153.
[16] von Alan, R.H., et al., Design science in information systems research. MIS quarterly, 2004. 28(1): p. 75-105.
[17] Peffers, K., et al. The design science research process: a model for producing and presenting information systems research. in Proceedings of the first international conference on design science research in information systems and technology (DESRIST 2006). 2006.
[18] Liu, B., Sentiment analysis and opinion mining. Synthesis Lectures on Human Language Technologies, 2012. 5(1): p. 1-167.
[19] Twitter. Developers Documentation. Overview. 2015 [cited 2015; Available from: https://dev.twitter.com/overview/documentation.
[20] teach-ict.com. Real time processing. [cited 2015; Available from: http://www.teach-ict.com/as_a2_ict_new/ocr/A2_G063/332_designing_systems/processing_methods/miniweb/pg4.htm#.
[21] TechTarget. Big data buzz gets louder with Apache Hadoop and Hive. 2015 [cited 2015; Available from: http://searchcloudcomputing.techtarget.com/tip/Big-data-buzz-gets-louder-with-Apache-Hadoop-and-Hive.
[22] Pivotal, S.b. Spring XD Guide. Reference Guide. 2015 [cited 2015; Available from: http://docs.spring.io/spring-xd/docs/current/reference/html/.
[23] Atlassian. Apache Hive. SerDe. [cited 2015; Available from: https://cwiki.apache.org/confluence/display/Hive/SerDe.
[24] Sanchez, G. Mininig Twitter with R. Basic Sentiment Analysis in R 2012 [cited 2015; Available from: https://sites.google.com/site/miningtwitter/questions/sentiment/analysis.
[25] Pradhan, M. sentiments.rar. 2014 [cited 2015; Available from: https://drive.google.com/file/d/0B7wy3b65I3jiUzN4WHBkVXdFejA/edit.