Process management, innovation
and efficiency performance
The moderating effect of competitive intensity
Janine L. Sanders Jones
Operations and Supply Chain Management, University of St Thomas,
Minneapolis, Minnesota, USA, and
Kevin Linderman
Supply Chain and Operations Management, University of Minnesota,
Minneapolis, Minnesota, USA
Abstract
Purpose– Much of the practitioner literature touts the universal benefits of process management and its impact on operational performance. However, in academic literature, empirical evidence is mixed. The purpose of this study is to investigate the role of the competitive intensity on the effectiveness of process management.
Design/methodology/approach– Survey data from manufacturing plants were collected from through a global research project. Regression analysis was used to test hypotheses.
Findings– The influence of process design on efficiency and innovation performance is not dependent on competitive intensity; however, the impact of process improvement and process control on efficiency and innovation performance is in some instances moderated by competitive intensity.
Research limitations/implications– The inclusion of competitive intensity as a contingency variable helps to explain the contextual impact of process management on efficiency and innovation.
Practical implications– Process management can be an effective tool if the levels of process design, control, and improvement are customized to fit with the competitive environment.
Originality/value– This is one of the few studies to empirically examine process management as three core elements. Previous studies utilized a single construct of process management or multiple manufacturing practices such as customer/supplier involvement, statistical quality control, process focus, and cross-functional teams to measure process management. Using this measurement approach demonstrates how process management can influence both efficiency and innovation.
KeywordsInnovation, Efficiency, Process management, Manufacturing, Competitive intensity
Paper typeResearch paper
Introduction
Due to today’s competitive pressures, organizations must engage in activities that will generate high performance and a competitive advantage. However, in order to effectively compete over time, organizations have to perform well in both efficiency and innovation. The changing nature of a dynamic environment requires organizations to compete through innovation and adaptability but also maintain productivity (Brown and Eisenhardt, 1997; Tushman and Anderson, 1986). Many organizations have turned to process management initiatives like Lean and Six Sigma as a means to help achieve and sustain this type of competitive advantage with mixed success. Trying to achieve these dual dimensions of performance often poses a potential issue for plants implementing process management (Sitkinet al., 1994; Sutcliffeet al., 2000).
The current issue and full text archive of this journal is available at
www.emeraldinsight.com/1463-7154.htm
Received 1 March 2013 Revised 15 May 2013 Accepted 21 June 2013
Business Process Management Journal Vol. 20 No. 2, 2014 pp. 335-358 qEmerald Group Publishing Limited 1463-7154 DOI 10.1108/BPMJ-03-2013-0026
Process
management
and innovation
335
Process management is described as the design, control, and improvement of processes (Evans and Lindsay, 2005). Quality gurus such as Deming and Juran charge that process management is universally beneficial to any organization. However, research results on the impact of process management on efficiency related performance measures are mixed. Ahire and Dreyfus (2000), for example, reported that process management positively impacted performance, while others have showed that process management has no real impact on operational performance (Samson and Terziovski, 1999; Nair, 2006).
Existing literature also suggests that process management requires a tradeoff between innovation and efficiency outcomes. Process management is positioned as a management practice that places too much attention on improving efficiency, thereby hindering a firm’s ability to focus on innovation through exploration (Benner and Tushman, 2002). Benner and Tushman (2003) argued that process management practices stabilize organizational processes and create an environment focused on searching for easy opportunities to gain efficiency. A study by Singh and Smith (2004) found no significant relationship between process management and innovation. However, Kimet al.(2012) and Prajogo and Hong (2008) did find that process management had a significant positive relationship with innovation performance in their studies.
Whereas previous research has focused on the direct effects of process management on operational performance, the resulting paradoxical outcomes may actually be resolved by including environmental contextual variables (Nair, 2006) and decoupling performance into more specific measures (Wonget al., 2011). A tenet of contingency theory is that organizational outcomes are influenced by the fit between the environmental context and the organization’s processes and structures (Donaldson, 2001). A growing body of operations management literature is using environmental contingency perspective to examine the moderating impact of environmental variables. Chavezet al. (2013) examined the moderating effect of industry clock speed on the relationship between internal lean practices and operational performance. This study found that lean practices had a positive relationship with quality, flexibility, and delivery in environments with low clock speed, yet a universally positive relationship with cost. Santos-Vijande and A´ lvarez-Gonza´lez (2007) found that market turbulence moderated the relationship between TQM and technology innovation. Environmental uncertainty was used as moderator variable in Wong et al. (2011). The study discovered that some links between supply chain integration and operations performance measures was influenced by environmental uncertainty.
Similar to these studies, some researchers have suggested that the effectiveness of process management is dependent on the task environment which is representative of the competitive market environment (Sutcliffeet al., 2000; Sitkinet al., 1994). Empirical research has yet to examine how the competitive environment dynamics faced by an organization moderate the effectiveness of process management, thus we seek to fill this gap in the literature and add to the operations literature stream investigate the effects of environmental contingencies. The objective of this study is to examine the moderating role of the competitive environment on the relationship between process management and performance. Specifically, this research study seeks to address the following two research questions:
RQ1.How does process management relate to innovation and efficiency performance?
BPMJ
20,2
RQ2.How does competitive intensity influence the impact of process management on efficiency and innovation performance?
Apart from previous studies, an alternate view of process management is used in this analysis. Process management is analyzed through its three components of process design, process improvement, and process control. The potential impact of the fit of process management with the competitive environment is explained using contingency theory. Regression is used to test for moderation by examining the interactions of process management and competitive intensity. The next section will provide the theory and hypotheses development. This is followed by a description of the data, analysis, and results. The article concludes with a discussion of the findings, contributions, and future research ideas.
Theory and hypotheses
Theoretical foundation
Process management, as positioned by Evans and Lindsay (2005) and Juran and Godfrey (1999), consists of three distinct dimensions: process design, process improvement, and process control. Process control is defined as monitoring existing process conditions to ensure stability and consistent performance ( Juran and Godfrey, 1999). Process improvement is the changing of existing processes to enhance performance. Process design is the development and implementation of new processes and may be associated with new product innovation (Deming, 1986; Ahire and Dreyfus, 2000). The traditional view of process management hinges on the concepts of process control and process improvement, but all three components are critical aspects of process management (Silver, 2004).
Theory relating process management and performance draws upon the organizational routines and contingency theory literature. Routines are patterns of interactions that occur repeatedly, therefore, a process is an organizational routine (Becker, 2004). Nelson and Winter (1982) describe organizational routines as a repeated pattern of behavior subject to change based on conditions. These routines can be viewed as a source of stability or flexibility (Feldman and Pentland, 2003) and are developed, maintained, and revised as needed. Routines that modify routines are described as meta-routines (Adleret al., 1999). Consequently, process management can be considered a meta-routine. Process control is a mechanism to maintain organizational processes and ensure stability. Process design and improvement change routines by either enhancing existing processes or creating new ones.
Some researchers consider process management to be a management initiative that is universally beneficially to organizations (Deming, 1986; Juran and Godfrey, 1999). This best practice philosophy and institutionalization of practices are exemplary of the institutional theory mimicry argument (Scott, 2001). As organizations become more effective and successful with the use of various management initiatives, other organizations begin to adopt these same actions as best practices. Omitted from this theoretical perspective is consideration of various environmental situations and their influence on the effectiveness of these practices (Bensonet al., 1991; Sitkinet al., 1994; Sousa and Voss, 2001; Ketokivi and Schroeder, 2004b).
Competitive intensity can be defined as the strength of competitors’ ability to influence a focal firm’s action and is an organization level phenomenon driven by perceptions of the external market environment (Barnett, 1997). As the intensity of competition increases,
Process
management
and innovation
337
organizations are forced to become more innovative with products and processes in order to remain competitive. Auh and Menguc (2005) noted that:
[. . .] when the competition is less intense, firms can operate with their existing systems to fully capitalize on the transparent predictability of their own behavior. However, when competition is intense, firms will have to adapt accordingly.
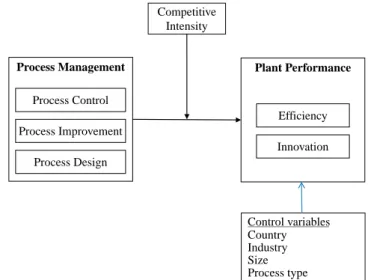
Thus, the level of competitive intensity of an organization’s external environment may play a pivotal role in the effectiveness of that organization’s process management efforts. Process management is proposed to have a significant relationship with efficiency and innovation performance contingent on the level of competitive intensity. Figure 1 illustrates the conceptual model.
Process management and efficiency
To be efficient, plants must quickly and effectively produce product with little waste. Gains in efficiency occur by producing a consistent product that conforms to product specifications. Process control focuses on identifying and removing defects and reducing process variation ( Juran, 1992). Employees increase their ability to identify defects because of the learning that occurs from actively performing the same recurring tasks (Repenning and Sterman, 2002; Upton and Kim, 1998). Process control can reduce the need for rework, thereby favorably impacting process cycle time and efficiency (Hackman and Wageman, 1995; Klassen and Menor, 2007).
Process improvement ideas also come through incremental learning. As employees become more proficient in their tasks, ideas are generated on how to change the existing process to be more efficient. This knowledge is often created through the use of cross-functional teams and other knowledge creation and sharing practices associated with process improvement (Choo et al., 2007; Mukherjee et al., 1998). Increased productivity is a product of continuous process improvements that reduce errors, reduce variance, lower cost, and improve cycle time ( Juran and Godfrey, 1999). Hence, process improvement can also result in gains in efficiency.
Figure 1. Conceptual model Process Control Process Improvement Process Design Competitive Intensity Efficiency Innovation Plant Performance Process Management Control variables Country Industry Size Process type
BPMJ
20,2
338
Efficiency can also be a result of the development and implementation of new processes associated with process design techniques. Capabilities can be significantly enhanced by adopting changes in new technology, processes, and people (Adler and Clark, 1991; Repenning and Sterman, 2002). However, disruption due to the introduction of new processes may not lead to more efficient operations until organizations have adapted to the new technology (Leonard-Barton, 1988). Yet, over time, it is assumed that the new processes will lead to better operating performance (Tyre and Hauptman, 1992). Thus, it is expected that:
H1. Process control positively influences efficiency performance.
H2. Process improvement positively influences efficiency performance.
H3. Process design positively influences efficiency performance.
Process management and innovation
High technical innovation performance requires flexibility and is a result of an organization successfully adapting its processes and products to changes in the environment (Donaldson, 2001; Abu Baker and Ahmad, 2010). Innovation is the process that connects new ideas to new processes and products (Aboelmaged, 2012) and requires organizations to go beyond learning from repetition, defect correction, and a desire for reducing process variation. The development of new technologies and products requires that organizations engage in practices that foster creativity, flexibility, and experimentation (Das and Joshi, 2011). Experimentation leads to a better understanding of causation that is not apparent through repetition (Fiol and Lyles, 1985). Experimentation and flexible routines are keys to learning that can lead to better innovation performance (Benner and Tushman, 2003).
Process control is centered on minimizing variation and considered a hindrance to the variability that is associated with the launch of a new process (Benner and Tushman, 2003). However, other management research on innovation argues that control is critical for flexible adaptation. Some variance reduction efforts may help innovation by reducing some uncertainty associated with the development of a new product or process (Eisenhardt and Tabrizi, 1995), however, according to Benner and Tushman (2002), they also constrain an organization from engaging in the higher order learning activities that are needed for process innovation. Organizations often get trapped in a learning cycle focused on making incremental process adjustments, minimizing their ability to engage in knowledge creation activities which lead to product and process innovation (Argyris, 1976; March, 1999). Focusing on process control may detract from those organizational efforts that can foster a competitive advantage in the area of innovation, therefore, negatively impacting innovation performance.
Alternately, innovation performance can be positively impacted by process improvement and process design. Some new products are built off of existing platforms that do not require a radical redesign or a new process (Tushman and Anderson, 1986), but need improvements to existing processes. However, the competitive landscape for innovative firms is always changing and the assumptions that the existing processes are built on may no longer be correct, thus requiring the development of new processes (Hammer and Champy, 1993). Process design is necessary for radical technology changes which support innovation (Benner and Tushman, 2003)
Process
management
and innovation
339
and is essential for innovative plants to remain competitive (Evans and Lindsay, 2005). Even for products that require new technology or processes, process improvement may still be necessary (Tyre and Hauptman, 1992). Incremental process improvements can be beneficial during the transfer or scale up of a newly designed process into a manufacturing setting. Process improvement and design practices support the flexibility and experimentation that is needed to foster innovation:
H4. Process control negatively influences innovation performance.
H5. Process improvement positively influences innovation performance.
H6. Process design positively influences innovation performance.
Impact of competitive intensity
The seminal work of Katz and Kahn (1978) and Lawrence and Lorsch (1967) brought to the forefront the important role of the environment and its effect on the design and work of organizations. Katz and Kahn (1978) highlighted organizations as open systems impacted by and responsive to environmental factors. Thus, it is essential that the environment is reflected in organizational processes. Lawrence and Lorsch (1967) extended systems theory and proposed that organizational effectiveness is influenced by the degree of fit between an organization’s structure and processes and its environment. The basic tenet of this contingency theory is that the processes of an organization must match its environmental context in order to be effective (Drazin and Van de ven, 1985). In a dynamic environment, the existing structures and processes may no longer be suitable and organizational performance may suffer. In order to remain competitive, organizations are forced to change to achieve the necessary level of fit to enhance their performance (Donaldson, 2001). Dynamic competitive environments exist in organizations that compete on either low cost or differentiation (Porter, 1980). Competitive pressures reside in different strategic settings requiring organizations to understand their competitive environment and choose processes that are most effective within that context.
Each element of process management can help to achieve gains in efficiency, but the magnitude of these gains is contingent on the environment. In highly competitive environments, it is more difficult to achieve competitive priorities of cost, quality, delivery, flexibility, innovation, and service (Ward and Duray, 2000). When operating in a highly competitive environment, organizations have to implement management initiatives that are going to result in greater productivity. Gains in efficiency can occur by producing a consistent product and continually improving existing processes. But as competition increases, these aspects of process management become even more necessary. In failing to adopt these practices, a plant is unlikely to keep pace with productivity gains achieved by competitors who are implementing better processes and utilizing superior equipment and technologically advanced tools.
In a competitive environment, plants may also be forced to create new or redesigned processes more frequently as they try to thrive in a rapidly changing environment (Donaldson, 2001). However, plants in a less competitive environment will not have to create new processes as often. Plants in a fiercely competitive environment should experience a greater operational benefit from process management than plants in a less competitive environment:
BPMJ
20,2
H7. Competitive intensity will positively moderate the relationship between process control and efficiency performance.
H8. Competitive intensity will positively moderate the relationship between process improvement and efficiency performance.
H9. Competitive intensity will positively moderate the relationship between process design and efficiency performance.
Process management has been criticized as a management system that focuses too heavily on reducing variation and errors in a process. Process control is focused on maintaining stability in an organization through carefully monitoring existing processes. Organizations have limited resources and capabilities, and when firms focus on efficiency-supportive activities, it leaves less room for innovation-supportive activities. Process control restricts an organization’s ability to be flexible to changes and can negatively influence innovation performance. This negative relationship will be exaggerated in a highly competitive environment where change is essential to survival. Changing processes and creating new processes are essential to adapting to technological change and competitive pressures. This is heightened in a dynamic competitive environment where the level of adaptation needed is higher than in a static environment. So, process improvement and design should have an even stronger effect on innovation performance as the intensity of competition increases:
H10. Competitive intensity will negatively moderate the relationship between process control and innovation performance.
H11. Competitive intensity will positively moderate the relationship between process improvement and innovation performance.
H12. Competitive intensity will positively moderate the relationship between process design and innovation performance.
Methods
Data collection
Data were collected from 238 manufacturing plants as part of the high performance manufacturing (HPM) global research project. This is an international study that contains data from eight countries across the machinery, electronics, and transportation parts supplier industries. These three industries cover a range of market and product characteristics, which increases the opportunity to generalize results. In addition, manufacturing plants serve as a more mature setting for studying process management. Plants are randomly selected from a number lists such asIndustry WeekBest Plant Award winners, Shingo Prize winners, and industry lists. The countries were chosen because they represent much of the industrialized manufacturing in the world. Sample summary is listed in Table I. A collection of surveys is sent to each facility in order to gather data at multiple levels of the plant to increase reliability of responses.
The response rate across countries is about 65 percent. This is due to obtaining consent to participate in the study was obtained from plants prior to mailing questionnaires. Non-response bias was examined by comparing early respondents to late respondents (Armstrong and Overton, 1977). A two-samplet-test was conducted on sample characteristics of total number of employees, total sales value of production,
Process
management
and innovation
341
market share, and the independent and dependent variables in this study. There were no significant differences (p.0.05) between early and late respondents. In addition, the issue of common respondent bias between the independent and dependent measures is minimized since the measures have multiple and different respondents and are measured on different Likert scales (Maruyama, 1998).
Independent variables
The scales for process design, process control, and process improvement were developed based on a similar two step approach used by Menor and Roth (2007). An extensive literature search on measuring process management was conducted to generate a list of scale items. Subject matter experts in business process management used a Q-sort procedure to narrow down measurement items and provide content validity. A validation sample was used to confirm the scale items for the three factors. The psychometric properties for process design, process control, and process improvement are also listed in Appendix 1. Three factors emerged using principal components analysis with varimax rotation (Hairet al., 2006). Measurement items loaded on the anticipated factor with no significant cross-loadings and all loadings were greater than 0.40. The reliability measure of Cronbach’s a for process design, process control, and process improvement are acceptable at 0.73, 0.86, and 0.76, respectively, (Cronbach, 1951).
The items, measured on 1-7 Likert scale of strongly disagree to strongly agree, can be found in Appendix 1. There were multiple respondents for each measurement item. The respondents included direct laborers, supervisors, a quality manager, a process engineer, a plant superintendent, and a plant manager. The respondents work closely with the manufacturing process and would have adequate knowledge of the plant’s process management activities. There was an average of eight respondents per plant for each process management measurement item. Inter-rater agreement was examined to determine whether responses should be aggregated (Boyer and Verma, 2000). All scales were above the criteria of 0.70 for the within-group agreement metric ( Jameset al., 1984), therefore responses were aggregated to the plant level for each scale.
Competitive intensity scale is measured on a 1-7 Likert scale of strongly disagree to strongly agree. Boydet al.(1993) noted that subjective measures of the environment can possibly introduce a large degree of error because the measure relies on the ability of the respondent to accurately assess the environment. To reduce the perceptual bias, multiple respondents (plant manager, plant superintendent, and process engineer) answered the measurement items. Inter-rater agreement is above 0.70, and Cronbach’sais 0.69.
Dependent variables
The measurement item responses for innovation and efficiency were obtained from the plant manager and are listed in Appendix 2. Innovation is measured by items
Austria Finland Germany Italy Japan Korea Sweden USA Total
Electronics 10 14 9 10 10 10 7 9 79 Machinery 7 6 13 10 12 10 10 11 79 Transportation parts suppliers 4 10 19 7 13 11 7 9 80 Total 21 30 41 27 35 31 24 29 238 Table I. Sample summary
BPMJ
20,2
342
related to new product introduction and product innovation similar to Devarajet al.
(2001). Efficiency is measured by common operations measurement items related to speed, cost, and quality (Ahmad and Schroeder, 2011; Flynnet al., 1995). All items are measured on a 1-5 Likert scale of low to superior relative to global, industry competition. Principal component analysis with varimax rotation revealed two dimensions. The resulting factor structure can be found in Appendix 2 with all factor loadings greater than 0.40. Cronbach’s a for innovation performance is 0.77 and 0.72 for efficiency performance.
Control variables
Country and industry are included in the analyses as control variables to take into consideration differences in performance that may be due to location or industry characteristics. Additionally, plant size, measured as the natural logarithm of total number of employees, is included as a control variable. Process type is also included as a control variable. It is based on the approach of Devarajet al.(2001), which creates a process index (1-5) based on the percentages of various process types (one of a kind, small batch, large batch, line flow, or continuous flow) operating in the facility.
Descriptive statistics and correlations are shown in Table II.
Analyses
Hierarchical regression analysis using ordinary least squares (OLS) was used to assess the impact of process design, control, and improvement on innovation and efficiency performance and the moderating effect of competitive intensity. This analysis technique will test whether the moderating variable additional explains variation in the dependent variable after accounting for direct effects. Several regression models were tested for each dependent variable. The base model includes control variables. The second model includes the control variables plus main effects of process design, process improvement, process control, and competitive intensity. The third full model includes all of the previous variables plus the interactions of competitive intensity with each element of process management. At each regression step, the significance in the change in R2 was tested to determine overall significance of the added variables.
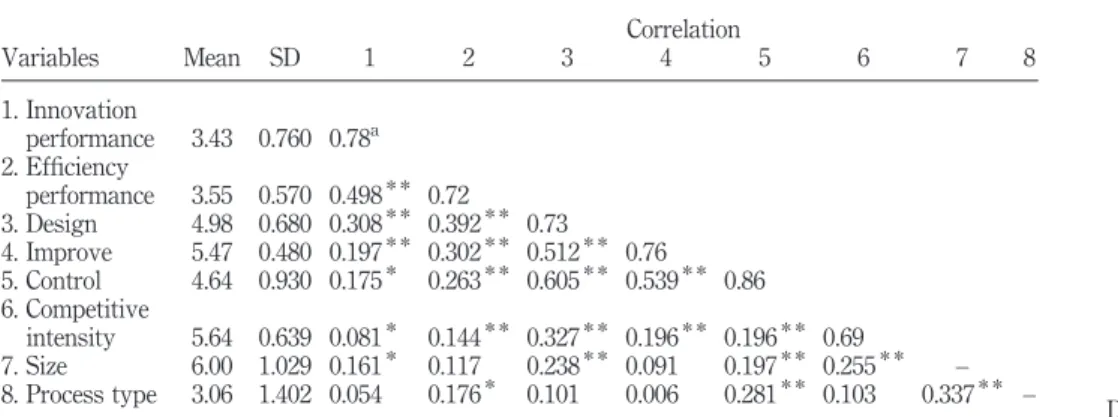
Correlation Variables Mean SD 1 2 3 4 5 6 7 8 1. Innovation performance 3.43 0.760 0.78a 2. Efficiency performance 3.55 0.570 0.498* * 0.72 3. Design 4.98 0.680 0.308* * 0.392* * 0.73 4. Improve 5.47 0.480 0.197* * 0.302* * 0.512* * 0.76 5. Control 4.64 0.930 0.175* 0.263* * 0.605* * 0.539* * 0.86 6. Competitive intensity 5.64 0.639 0.081* 0.144* * 0.327* * 0.196* * 0.196* * 0.69 7. Size 6.00 1.029 0.161* 0.117 0.238* * 0.091 0.197* * 0.255* * – 8. Process type 3.06 1.402 0.054 0.176* 0.101 0.006 0.281* * 0.103 0.337* * –
Notes:Significant correlations at: *p,0.05 and * *p,0.01;aCronbach’sais displayed along the diagonal for measurement scales; it does not apply to size and process type
Table II.
Descriptive statistics, correlations, and scale reliabilities
Process
management
and innovation
343
A significant change in R2 means that moderation may exist. In that case, the significance and direction of theb-coefficients were examined to test the hypotheses. Significant interactions were further studied using two interaction-probing techniques of conditional effect plots (Kutner et al., 2005) and simple slope analysis ( Jaccardet al., 1990).
Homoscedasticity, normality, presence of outliers, and multicollinearity were examined prior to performing the regression analyses (Hairet al., 2006). Analyses of the residuals plotted against the predicted values exhibited no violation of homoscedasticity, and a plot of the standardized residuals supported the normality assumption. An examination of the independent and dependent variables shows that there were no observations with a standard score ^2.5, indicating that there were no outliers present (Kutneret al., 2005). The data were mean-centered prior to creating the interaction terms to reduce the effect of multicollinearity (Kutner et al., 2005). Additionally, the variance inflation factor was found to be less than 3.0 indicating no multicollinearity issues (Cohenet al., 1983).
Results
Efficiency performance
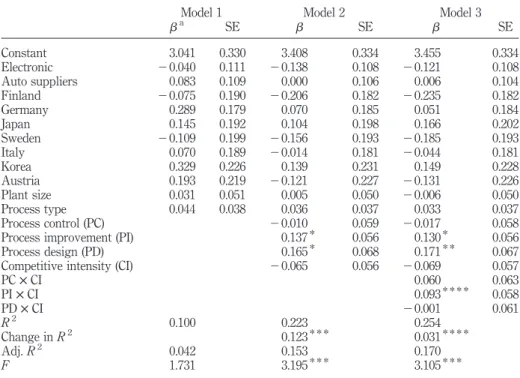
The regression results for the relationship between process design, improvement, and control and efficiency performance can be found in Table III. For full model 3,
Model 1 Model 2 Model 3
ba SE b SE b SE Constant 3.041 0.330 3.408 0.334 3.455 0.334 Electronic 20.040 0.111 20.138 0.108 20.121 0.108 Auto suppliers 0.083 0.109 0.000 0.106 0.006 0.104 Finland 20.075 0.190 20.206 0.182 20.235 0.182 Germany 0.289 0.179 0.070 0.185 0.051 0.184 Japan 0.145 0.192 0.104 0.198 0.166 0.202 Sweden 20.109 0.199 20.156 0.193 20.185 0.193 Italy 0.070 0.189 20.014 0.181 20.044 0.181 Korea 0.329 0.226 0.139 0.231 0.149 0.228 Austria 0.193 0.219 20.121 0.227 20.131 0.226 Plant size 0.031 0.051 0.005 0.050 20.006 0.050 Process type 0.044 0.038 0.036 0.037 0.033 0.037 Process control (PC) 20.010 0.059 20.017 0.058
Process improvement (PI) 0.137* 0.056 0.130* 0.056
Process design (PD) 0.165* 0.068 0.171* * 0.067
Competitive intensity (CI) 20.065 0.056 20.069 0.057
PC£CI 0.060 0.063 PI£CI 0.093* * * * 0.058 PD£CI 20.001 0.061 R2 0.100 0.223 0.254 Change inR2 0.123* * * 0.031* * * * Adj.R2 0.042 0.153 0.170 F 1.731 3.195* * * 3.105* * *
Notes: Significant at: *p#0.05, * *p#0.01, * * *p#0.005 and * * * *p#0.1; aunstandardized b-coefficient reported
Table III.
Regression results for efficiency performance
BPMJ
20,2
the addition of the interaction terms of competitive intensity and each element of process management yielded an overall significant regression model and change inR2
with an adjustedR2of 17 percent. Results show that that neither the interaction terms of competitive intensity with process control nor process design is significant. The interaction term of competitive intensity with improvement (H8) and the main effect of process improvement (H2) are both significant at the p#0.05 level. The main effect of process control is not significantly related to efficiency performance; however, process design is significantly positively related to efficiency performance (p#0.01) and supportive ofH3.
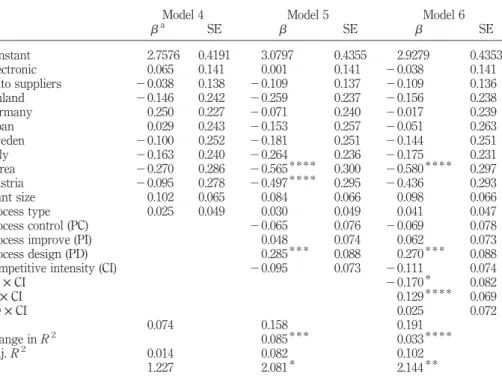
Innovation performance
The results for the overall significance and change inR2for the hierarchical regression models with innovation performance as the dependent variable are listed in Table IV. The change inR2is statistically significant as main effects and interactions are added to the model. The full model, model 6, is significant with an adjustedR2of 10.2 percent. Both the interaction terms for competitive intensity with control and with improvement are statistically significant in their respective predicted directions, providing support forH10andH11. The interaction of competitive intensity with process design is not significant; however, the main effect of process design is highly significant at the
p#0.005 level, supportingH6.
Model 4 Model 5 Model 6
ba SE b SE b SE Constant 2.7576 0.4191 3.0797 0.4355 2.9279 0.4353 Electronic 0.065 0.141 0.001 0.141 20.038 0.141 Auto suppliers 20.038 0.138 20.109 0.137 20.109 0.136 Finland 20.146 0.242 20.259 0.237 20.156 0.238 Germany 0.250 0.227 20.071 0.240 20.017 0.239 Japan 0.029 0.243 20.153 0.257 20.051 0.263 Sweden 20.100 0.252 20.181 0.251 20.144 0.251 Italy 20.163 0.240 20.264 0.236 20.175 0.231 Korea 20.270 0.286 20.565* * * * 0.300 20.580* * * * 0.297 Austria 20.095 0.278 20.497* * * * 0.295 20.436 0.293 Plant size 0.102 0.065 0.084 0.066 0.098 0.066 Process type 0.025 0.049 0.030 0.049 0.041 0.047 Process control (PC) 20.065 0.076 20.069 0.078
Process improve (PI) 0.048 0.074 0.062 0.073
Process design (PD) 0.285* * * 0.088 0.270* * * 0.088
Competitive intensity (CI) 20.095 0.073 20.111 0.074
PC£CI 20.170* 0.082 PI£CI 0.129* * * * 0.069 PD£CI 0.025 0.072 R2 0.074 0.158 0.191 Change inR2 0.085* * * 0.033* * * * Adj.R2 0.014 0.082 0.102 F 1.227 2.081* 2.144* *
Notes: Significant at: *p#0.05, * *p#0.01, * * *p#0.005 and * * * *p#0.1; aunstandardized b-coefficient reported
Table IV.
Regression results for innovation performance
Process
management
and innovation
345
Analysis of interaction effects
Significant interaction effects in multiple regressions should be further explored to better understand the meaning of the interaction ( Jaccardet al., 1990; Aiken and West, 1991). The previous analysis provides statistical evidence of the existence of interactions, but additional analytic techniques are needed to address the strength and nature of the effect ( Jaccardet al., 1990).
There are several probing procedures for interactions, but the simple slope analysis is most widely used (Bauer and Curran, 2005). In this procedure, the slope and intercept are calculated for specific intervals of the moderator variable. Moderator variable values at the first, 50th, and 99th percentile of the observed data are used to represent low, medium, and high values, allowing examination of the statistical significance of the interaction at the complete range of scale values. A computational tool developed by Preacheret al.(2006) is used to compute and test the significance of the slopes using a
t-statistic.
The results of the post hoc analyses of the significant interactions are listed in Table V and graphically displayed using conditional effects plots in Figures 2-4. Conditional effects plots are often used to visually show the relationship between the independent and dependent variables conditioned on different levels of the moderator variable (Kutneret al., 2005).
Probing the impact of competitive intensity on the relationship between process improvement and efficiency shows that at each level (low, medium, and high), the increasing regression coefficient shown in Table V is statistically significant atp#0.05, supportingH8. Figure 2 illustrates this relationship which shows that as competitive intensity increases, the relationship between process improvement and efficiency becomes stronger. Likewise in Table V, the results show that the interaction of competitive intensity with process control is statistically significant (p#0.05) at all three levels of competitive intensity. In Figure 3, as the moderator variable of competitive intensity moves from low to high, the slope becomes more negative.
Y¼efficiency, X¼process improvement Y¼innovation, X¼process control Y¼innovation, X¼process improvement Simple slope SE t p Simple slope SE t p Simple slope SE t p Low competitive intensity (first percentile) 0.490 0.221 2.217 0.027 20.730 0.327 22.235 0.027 0.561 0.282 1.991 0.048 Medium competitive intensity (50th percentile) 0.665 0.322 2.065 0.040 21.050 0.479 22.193 0.030 0.804 0.409 1.965 0.051 High competitive intensity (99th percentile) 0.760 0.377 2.016 0.045 21.223 0.562 22.176 0.031 0.935 0.479 1.952 0.053 Table V. Results of simple slope analysis
BPMJ
20,2
346
This supports the earlier finding for H10 that process control has a greater negative impact on innovation as competitive intensity increases.
Interestingly, in Table V, the correlation between process improvement and innovation moves from significant (p#0.05) to marginally significant (p.0.05) as competitive intensity increases. At low levels of competitive intensity, there is a significant positive relationship between process improvement and innovation. However, at the medium and high levels of competitive intensity, the relationship is
Figure 2.
Impact of competitive intensity moderating the relationship between process improvement and efficiency Ef ficiency Process improvement Low CI Med CI High CI Figure 3. Impact of competitive intensity moderating the relationship between process control and innovation Inno v a tion Process control Low CI Med CI High CI
Process
management
and innovation
347
still positive as shown in Figure 4, but is less statistical significant. In this situation, another method called the “regions of significance” can provide additional information as to “over what range of the moderator the effect of the focal predictor is significantly positive” (Bauer and Curran, 2005). First developed by Johnson and Newman (1936), a region of significance procedure identifies the moderator values at a selected statistical criteria level ofa. Choosingaof 0.05 and using Preacheret al.(2006), it is determined that inside the region where competitive intensity is between 1.65 and 5.1 on a scale from 1 to 7, there is a statistically significant positive relationship between process improvement and innovation. Outside of this range, competitive intensity does not significantly moderate the relationship between process improvement and innovation at the 0.05 significance level. This means at higher levels of competitive intensity, process improvement does not have statistically significant positive relationship with innovation. Table VI provides a summary of the outcomes of the tested hypotheses. Discussion
The objective of this study was to examine the impact competitive intensity has on the relationship between the elements of process management and plant level efficiency and innovation performance. The results indicate that process control is not related to competitive efficiency performance. These findings are similar to prior studies that also found no significant relationship between process control practices and operational performance (Nair, 2006; Samson and Terziovski, 1999; Powell, 1995). This does not provide any indication that process control is not critical to operational performance; it is more likely that process control is a necessary condition for operations. Evans and Lindsay (2005) noted that process control is an essential element to have in place prior to improving and re-designing processes. Process control is the
Figure 4.
Impact of competitive intensity moderating the relationship between process improvement and innovation Inno v a tion Process improvement Low CI Med CI High CI
BPMJ
20,2
348
foundational piece to overall process management making it a necessary for organizations, yet it is not enough to provide a competitive advantage.
Process design is positively related to efficiency performance. Oftentimes, plants decide to design new processes with the aim of become more efficient. This can be triggered by competition, advances in technology, or problems with the current process. Newer processes may include increased automation or other productivity saving mechanisms (Hill, 2000). Additionally, when new products are introduced, “design for manufacturing requirements in terms of labor-cost reduction through increase automation and other labor-saving opportunities” are investigated during the process design phase (Hill, 2000). The intensity of competition does not significantly alter the relationship between process design and efficiency performance, giving support for the notion that this element of process management is universally beneficial, regardless of competitive environment.
Process improvement is also related to efficiency performance. When competitive intensity increases, process improvement has a greater impact on efficiency performance. This is aligned with previous research studies. In competitive environments, organizations are forced to compete on the dimensions of cost, quality, and delivery (Ward and Duray, 2000). To be competitive, they must be able to manage their cost, improve their quality, and/or deliver product to the market quickly and on-time. Continuous improvement of processes is vital to beating the competition on these performance dimensions (Flynnet al., 1995). Incremental changes can keep an organization competitive (Bensonet al., 1991).
With regard to innovation performance, process design efforts are positively related to innovation performance, in spite of the level of competitive intensity. The success of new products can be affected by the design of the manufacturing process. Over time, more organizations are moving to concurrent engineering, where new products and processes are designed simultaneously (Koufteroset al., 2001). Process design draws on higher levels of learning that require exploration to create the new processes that may go along with the new products. Effective process design aids in getting higher quality products to the market faster, resulting in an advantage over the competition (Hill, 2000). Process control was found to have a more negative impact on innovation performance as the level of competition increases. Trying to maintain existing processes in a highly competitive environment can result in decreased innovation performance.
Hypothesis Result
H1 Process control is positively related to efficiency Not supported H2 Process improvement is positively related to efficiency Supported H3 Process design is positively related to efficiency Supported H4 Process control is negatively related to innovation Not supported H5 Process improvement is positively related to innovation Not supported H6 Process design is positively related to innovation Supported H7 Competitive intensity positively moderates control and efficiency Not supported H8 Competitive intensity positively moderates improvement and efficiency Supported H9 Competitive intensity positively moderates design and efficiency Not supported H10 Competitive intensity negatively moderates control and innovation Supported H11 Competitive intensity positively moderates improvement and innovation Partially supported H12 Competitive intensity positively moderates design and innovation Not supported
Table VI. Summary of tested hypotheses
Process
management
and innovation
349
In rapidly changing environments, time spent maintaining processes may not be advantageous. Organizations that spend a lot of time on process control are weakened because they are maintaining processes that will soon be outdated, instead of developing new processes that will keep them competitive.
Under low to moderate levels of competitive intensity, process improvement has a positive effect on innovation performance. This is interesting because it suggests that process improvement can improve innovation performance in environments in which competitive pressures are present but not at extremely high levels of competitive intensity. This result supports similar findings from Kimet al.(2012) which found that innovation performance can be enhanced by process improvement capabilities. However, additional we found that in a fierce competitive environment, process improvement does not significantly influence innovation performance. This finding partially supports prior management literature that suggests that process improvement hinders a firm’s ability to focus on innovation through exploration (Benner and Tushman, 2003). These results aid in further understanding the complex relationship between process improvement and innovation. One explanation for this finding may be that, at lower levels of competitive intensity, more incremental innovation occurs. This type of innovation can benefit from process improvement, since it places more attention on exploiting the existing processes. However, at high levels of competitive intensity, organizations are often forced to compete with more radical innovation because of the new products and processes introduced by others in the industry. In this context, as the dynamics of the market rapidly change, organizations may need to implement newer processes. Plants in an intensively competitive environment should focus more on process design, which will impact innovation performance.
Conclusion
Research contribution
The main contribution of this essay is the examination of process management as a multidimensional phenomenon that can have a varied effect on performance, depending on the level of competitive intensity. Scholars have discussed process management as consisting of distinct elements ( Juran and Godfrey, 1999; Silver, 2004; Hammer, 2002), but this is one of the few studies to empirically examine process management as three core elements. Previous studies utilized a single construct of process management or multiple manufacturing practices such as customer/supplier involvement, statistical quality control, process focus, and cross-functional teams to measure process management. Using this measurement approach demonstrates how process management can influence both efficiency and innovation. In addition, this study provides further insight into the paradoxical outcomes of previous studies. The inclusion of competitive intensity as a contingency variable helps to explain the contextual situation of when the elements of process management can significantly impact efficiency and innovation.
Even though there may appear to be a conflict between innovation and efficiency, organizations can pursue both performance goals (Kotha and Swamidass, 2000; Rosenzweig and Easton, 2010). The findings support the perspective that process management can be tailored to achieve a certain type of performance (Sutcliffeet al., 2000). When process management is broken down into the components of design, control, and improvement, organizations do not have to sacrifice innovation performance. Instead, they should shift their emphasis among the three dimensions
BPMJ
20,2
of process management depending on the level of competitive intensity. This study provides evidence that environmental context matters when investigating the impact of process management and should be considered in future studies. In addition, this work provides empirical support for the notion that process management is beneficial for organizations that encounter the more flexible situations often associated with innovative organizations. Although process control can hinder innovation, it is the design of new processes and the improvement of existing processes that give the plant the ability to be effective at efficiency and innovation. Organizations like Motorola have demonstrated that process management and innovation can co-exist in the same organization (Crockett, 2006).
Practical implications
In addition to the research contributions, this study has practical implications. Process design is becoming increasingly important for plants that focus on new product development and innovation. As firms engage in activities like concurrent engineering, a process management program that focuses on process design, such as design for Six Sigma, can support these efforts. But the key insight from this study is that process management can be an effective tool if the levels of process design, control, and improvement are a fit with the competitive environment. In terms of today’s process management programs like Six Sigma (which focuses on process improvement and process control) and design for Six Sigma (which focuses on process design), the two programs can coexist in a healthy fashion in a plant. With process management, organizations do not have to sacrifice innovation performance. Levels of process design, control, and improvement can be customized to enhance innovation and/or efficiency performance, which is an important aspect of managerial decision-making. Limitations and future research
There are several limitations associated with this study that can generate exciting future research opportunities. First, our analysis uses only perceptual measures of performance. Ketokivi and Schroeder (2004a) showed that perceptual measures were valid proxies for objective measures, but objective measures are relatively free from measurement error (Devarajet al., 2001). Subsequent studies could include objective measures for innovation and efficiency performance.
Second, this study uses cross-sectional data. It is probable that the introduction of a new process or process improvement does not immediately result in better efficiency (Repenning and Sterman, 2002). The delay due to learning or noise from process disruption may not diminish for some time (Adler and Clark, 1991). A longitudinal study would be able to monitor the effects of process management on efficiency over a period of time.
Additionally, the environment was proposed as a moderating variable using contingency theory. Contingency theory is based on the concept of fit, and there are many types of fit that can be tested (Venkatraman, 1989). Although the model tested in this study is warranted, alternate models of moderation and mediation should be explored. For example, environmental characteristics may not only moderate the relationship between practices and performances, but also drive practices. Strategic and structural variables may have a similar relationship (Ketokivi and Schroeder, 2004b).
Process
management
and innovation
351
Finally, this study does not distinguish the type of competitive environment. For example, using Porter’s (1980) conceptualization of strategic focus, one could position Wal-Mart and UPS in low-cost competitive environments, where Motorola and 3M are in differentiation-focused competitive environments. These may impact the level of process design, process control, and process improvement. Future research should consider exploring the mediating and/or moderating role of organizational structure, plant level strategy, and other aspects of environmental dynamism. Through these additional studies, researchers can provide managers with more information on the appropriate management initiatives to advance under various organizational contexts. In spite of these limitations, this research study has established that elements of process management have a diverse impact on efficiency and innovation performance. More importantly, it shows that organizational context does play a role in the effectiveness of process management. Using process design, control, and improvement as a means to study process management is a significant contribution to the literature. With this approach, additional research can be performed that may provide more valuable insights on process management and its relationship to other operations management concepts.
References
Aboelmaged, M.G. (2012), “Harvesting organizational knowledge and innovation practices: an empirical examination of their effects on operations strategy”, Business Process Management Journal, Vol. 18 No. 5, pp. 712-734.
Abu Baker, L. and Ahmad, H. (2010), “Assessing the relationship between firm resources and product innovation performance: a resource-based view”,Business Process Management Journal, Vol. 16 No. 3, pp. 420-435.
Adler, P.S. and Clark, K.B. (1991), “Behind the learning curve: a sketch of the learning process”,
Management Science, Vol. 37 No. 3, pp. 267-281.
Adler, P.S., Goldoftas, B. and Levine, D. (1999), “Flexibility versus efficiency? A case study of model changeovers in the Toyota production system”,Organization Science: A Journal of the Institute of Management Sciences, Vol. 10 No. 1, pp. 43-68.
Ahire, S.L. and Dreyfus, P. (2000), “The impact of design management and process management on quality: an empirical investigation”,Journal of Operations Management, Vol. 18 No. 5, pp. 549-575.
Ahmad, S. and Schroeder, R. (2011), “Knowledge management through technology strategy: implications for competitiveness”, Journal of Manufacturing Technology Management, Vol. 22 No. 1, pp. 6-24.
Aiken, L. and West, S. (1991),Multiple Regression: Testing and Interpreting Interactions, Sage, Newbury Park, CA.
Argyris, C. (1976), “Single-loop and double-loop models in research on decision making”,
Administrative Science Quarterly, Vol. 21 No. 3, p. 363.
Armstrong, J.S. and Overton, T.S. (1977), “Estimating nonresponse bias in mail surveys”,Journal of Marketing Research, Vol. 14, pp. 396-402.
Auh, S. and Menguc, B. (2005), “Balancing exploration and exploitation: the moderating role of competitive intensity”,Journal of Business Research, Vol. 58, pp. 1652-1661.
Barnett, W. (1997), “The dynamics of competitive intensity”,Administrative Science Quarterly, Vol. 42, pp. 128-160.
BPMJ
20,2
Bauer, D. and Curran, P. (2005), “Probing interactions in fixed and multilevel regression: inferential and graphical techniques”, Multivariate Behavioral Research, Vol. 40 No. 3, pp. 373-400.
Becker, M.C. (2004), “Organizational routines: a review of the literature”,Industrial & Corporate Change, Vol. 13 No. 4, pp. 643-677.
Benner, M.J. and Tushman, M.L. (2002), “Process management and technological innovation: a longitudinal study of photography and paint industries”, Administrative Science Quarterly, Vol. 47 No. 4, pp. 676-706.
Benner, M.J. and Tushman, M.L. (2003), “Exploitation, exploration, and process management: the productivity dilemma revisited”,Academy of Management Review, Vol. 28 No. 2, pp. 238-256.
Benson, P.G., Saraph, J.V. and Schroeder, R.G. (1991), “The effects of organizational context on quality management: an empirical investigation”,Management Science, Vol. 37 No. 9, pp. 1107-1124.
Boyd, B.K., Dess, G.G. and Rasheed, A.M.A. (1993), “Divergence between archival and perceptual measures of the environment: causes and consequences”, Academy of Management Review, Vol. 18 No. 2, pp. 204-226.
Boyer, K. and Verma, R. (2000), “Multiple raters in survey-based operations management research: a review and tutorial”,Production and Operations Management, Vol. 9 No. 2, pp. 128-140.
Brown, S.L. and Eisenhardt, K.M. (1997), “The art of continuous change: linking complexity theory and time-paced evolution in relentlessly shifting organizations”, Administrative Science Quarterly, Vol. 42, pp. 1-34.
Chavez, R., Gimenez, C., Fynes, B., Wiengarten, F. and Yu, W. (2013), “Internal lean practices and operational performance: the contingency perspective of clock speed”, International Journal of Operations & Production Management, Vol. 33 No. 5, pp. 562-588.
Choo, A., Linderman, K. and Schroeder, R. (2007), “Method and psychological effects on learning behavior and knowledge creation in quality improvement projects”,Management Science, Vol. 53 No. 3, pp. 437-450.
Cohen, J., Cohen, P., West, S. and Aiken, L. (1983), Applied Multiple Regression/Correlation Analysis for the Behavioral Sciences, Lawrence Erlbaum Associates, Inc., Mahwah, NJ. Crockett, R. (2006), “Six Sigma still pays off at Motorola”,BusinessWeek, December 4. Cronbach, L. (1951), “Coefficient alpha and internal structure of tests”,Psychometrica, Vol. 16,
pp. 297-334.
Das, S.R. and Joshi, M.P. (2011), “Process innovativeness and firm performance in technology service firms: the effect of external and internal contingencies”,IEEE Transactions on Engineering Management, Vol. 99, pp. 1-14.
Deming, W.E. (1986),Out of the Crisis, MIT Press, Cambridge, MA.
Devaraj, S., Hollingworth, D.G. and Schroeder, R.G. (2001), “Generic manufacturing strategies: an empirical test of two configurational typologies”,Journal of Operations Management, Vol. 19 No. 4, pp. 427-452.
Donaldson, L. (2001),The Contingency Theory of Organizations, Sage, Thousand Oaks, CA. Drazin, R. and Van de ven, A.H. (1985), “Alternative forms of fit in contingency theory”,
Administrative Science Quarterly, Vol. 30 No. 4, p. 514.
Eisenhardt, K.M. and Tabrizi, B.N. (1995), “Accelerating adaptive processes: product innovation in the global computer industry”,Administrative Science Quarterly, Vol. 40 No. 1, p. 84.
Process
management
and innovation
353
Evans, J.R. and Lindsay, W.M. (2005),The Management and Control of Quality, South-Western, Cincinnati, OH.
Feldman, M.S. and Pentland, B.T. (2003), “Reconceptualizing organizational routines as a source of flexibility and change”,Administrative Science Quarterly, Vol. 48 No. 1, pp. 94-118. Fiol, C.M. and Lyles, M.A. (1985), “Organizational learning”,Academy of Management Review,
Vol. 10 No. 4, pp. 803-813.
Flynn, B.B., Schroeder, R.G. and Sakakibara, S. (1995), “The impact of quality management practices on performance and competitive advantage”,Decision Sciences, Vol. 26 No. 5, pp. 659-691.
Hackman, J.R. and Wageman, R. (1995), “Total quality management: empirical, conceptual, and practical issues”,Administrative Science Quarterly, Vol. 40 No. 2, pp. 309-342.
Hair, J.F., Anderson, R.E., Tatum, R.L. and Black, W.C. (2006),Multivariate Data Analysis, 6th ed., Prentice-Hall, Englewood Cliffs, NJ.
Hammer, M. (2002), “Process management and the future of Six Sigma”,MIT Sloan Management Review, Vol. 43 No. 2, pp. 26-32.
Hammer, M. and Champy, J. (1993),Reengineering the Corporation: A Manifesto for Business Revolution, Harper Business, New York, NY.
Hill, T. (2000),Manufacturing Strategy: Text and Cases, McGraw-Hill, New York, NY. Jaccard, J., Turrisi, R. and Choi, K. (1990),Interaction Effects in Multiple Regression, 2nd ed.,
Sage University Paper Series on Quantitative Applications in the Social Sciences, Sage, Newbury Park, CA.
James, L.R., Demaree, R.L. and Wolf, G. (1984), “Estimating within-group interrater reliabilities with and without response bias”,Journal of Applied Psychology, Vol. 69, pp. 85-98. Johnson, P.O. and Newman, J. (1936), “Tests of certain linear hypotheses and their applications to
some educational problems”,Statistical Research Memoirs, Vol. 1, pp. 57-93.
Juran, J.M. (1992),Juran on Quality by Design: The New Steps for Planning Quality into Goods and Services, The Free Press, New York, NY.
Juran, J.M. and Godfrey, A.B. (1999),Juran’s Quality Handbook, McGraw-Hill, New York, NY. Katz, D. and Kahn, R. (1978),Social Psychology of Organizations, Wiley, New York, NY. Ketokivi, M.A. and Schroeder, R.G. (2004a), “Perceptual measures of performance: fact or
fiction?”,Journal of Operations Management, Vol. 22 No. 3, pp. 247-264.
Ketokivi, M.A. and Schroeder, R.G. (2004b), “Strategic, structural contingency and institutional explanations in the adoption of innovative manufacturing practices”, Journal of Operations Management, Vol. 22 No. 1, pp. 63-89.
Kim, D., Kumar, V. and Kumar, U. (2012), “Relationship between quality management practices and innovation”,Journal of Operations Management, Vol. 30 No. 4, pp. 295-315. Klassen, R.D. and Menor, L.J. (2007), “The process management triangle: an empirical
investigation of process trade-offs”, Journal of Operations Management, Vol. 25 No. 5, pp. 1015-1034.
Kotha, S. and Swamidass, P.M. (2000/4), “Strategy, advanced manufacturing technology and performance: empirical evidence from US manufacturing firms”,Journal of Operations Management, Vol. 18 No. 3, pp. 257-277.
Koufteros, X.A., Vonderembse, M.A. and Doll, W. (2001), “Concurrent engineering and its consequences”,Journal of Operations Management, Vol. 19, pp. 97-115.
Kutner, M., Nachtsheim, C., Neter, J. and Li, W. (2005), Applied Linear Statistical Models, McGraw-Hill, New York, NY.
BPMJ
20,2
Lawrence, P. and Lorsch, J. (1967),Organizations and Environment, Harvard Business School Press, Boston, MA.
Leonard-Barton, G. (1988), “Implementation as mutual adaptation of technology and organization”,Research Policy, Vol. 17, pp. 251-267.
March, J. (1999),The Pursuit of Organizational Intelligence, Blackwell, Malden, MA. Maruyama, G. (1998),Basics of Structural Equation Modeling, Sage, Thousands Oaks, CA. Menor, L.J. and Roth, A.V. (2007), “New service development competence in retail banking:
construct development and measurement validation”,Journal of Operations Management, Vol. 25 No. 4, pp. 825-846.
Mukherjee, A.S., Lapre, M. and Wassenhove, L. (1998), “Knowledge driven quality improvement”,Management Science, Vol. 44 No. 11, pp. S35-S49.
Nair, A. (2006), “Meta-analysis of the relationship between quality management practices and firm performance – implications for quality management theory development”,Journal of Operations Management, Vol. 24 No. 6, pp. 948-975.
Nelson, R.R. and Winter, S.G. (1982),An Evolutionary Theory of Economic Change, Belknap Press of Harvard University Press, Cambridge, MA.
Porter, M. (1980),Competitive Strategy, The Free Press, New York, NY.
Powell, T.C. (1995), “Total quality management as a competitive advantage: a review and empirical study”,Strategic Management Journal, Vol. 16 No. 1, pp. 15-37.
Prajogo, D.I. and Hong, S.W. (2008), “The effect of TQM on performance in R&D environments: a perspective form South Korean firms”,Technovation, Vol. 28 No. 12, pp. 855-863. Preacher, K., Curran, J. and Bauer, D. (2006), “Computational tools for probing interaction effects
in multiple linear regression, multilevel modeling, and latent curve analysis”,Journal of Educational and Behavioral Statistics, Vol. 31, pp. 437-448.
Repenning, N. and Sterman, J. (2002), “Capability traps and self-confirming attribution errors in the dynamics of process improvement”, Administrative Science Quarterly, Vol. 47, pp. 265-295.
Rosenzweig, E. and Easton, G. (2010), “Tradeoffs in manufacturing? A meta-analysis and critique of the literature”, Production and Operations Management, Vol. 19 No. 2, pp. 127-143.
Samson, D. and Terziovski, M. (1999), “The relationship between total quality management practices and operational performance”,Journal of Operations Management, Vol. 17 No. 4, pp. 393-409.
Santos-Vijande, M.L. and A´ lvarez-Gonza´lez, L.I. (2007), “Innovativeness and organizational innovation in total quality oriented firms: the moderating role of market turbulence”,
Technovation, Vol. 27 No. 9, pp. 514-532.
Scott, W.R. (2001),Institutions and Organizations, Sage, Thousand Oaks, CA.
Silver, E. (2004), “Process management instead of operations management”,Manufacturing & Service Operations Management, Vol. 6 No. 4, pp. 273-279.
Singh, P.J. and Smith, A. (2004), “Relationship between TQM and innovation: an empirical study”,Journal of Manufacturing Technology Management, Vol. 15 No. 5, pp. 394-401. Sitkin, S.B., Sutcliffe, K.M. and Schroeder, R.G. (1994), “Distinguishing control from learning in
total quality management: a contingency perspective”,Academy of Management Review, Vol. 19 No. 3, p. 537.
Sousa, R. and Voss, C. (2001), “Quality management: universal or context dependent”,
Production and Operations Management, Vol. 10 No. 4, pp. 383-404.
Process
management
and innovation
355
Sutcliffe, K., Sitkin, S. and Browning, L. (2000), “Tailoring process management to situational requirements: beyond the control and exploration dichotomy”, in Cole, R. and Scott, W.R. (Eds),The Quality Movement and Organization Theory, Sage, Thousand Oaks, CA, pp. 315-330.
Tushman, M.L. and Anderson, P. (1986), “Technological discontinuities and organizational environments”,Administrative Science Quarterly, Vol. 31, pp. 439-465.
Tyre, M.J. and Hauptman, O. (1992), “Effectiveness of organizational responses to technological change in the production process”,Organization Science, Vol. 3 No. 3, pp. 301-320. Upton, D.M. and Kim, B. (1998), “Alternative methods of learning and process improvement in
manufacturing”,Journal of Operations Management, Vol. 16 No. 1, pp. 1-20.
Venkatraman, N. (1989), “The concept of fit in strategy research: toward verbal and statistical correspondence”,Academy of Management Review, Vol. 14 No. 3, pp. 423-444.
Ward, P.T. and Duray, R. (2000), “Manufacturing strategy in context: environment, competitive strategy, and manufacturing strategy”,Journal of Operations Management, Vol. 18 No. 2, pp. 123-138.
Wong, C.Y., Boon-itt, S. and Wong, C.W.Y. (2011), “The contingency effects of environmental uncertainty on the relationship between supply chain integration and operational performance”,Journal of Operations Management, Vol. 29 No. 6, pp. 604-615.
Further reading
Abernathy, W.J. (1978), The Productivity Dilemma, Johns Hopkins University Press, Baltimore, MD.
Dess, G.G. (1987), “Consensus on strategy formulation and organizational performance: competitors in a fragmented”,Strategic Management Journal, Vol. 8 No. 3, pp. 259-277. Dess, G.G. and Beard, D.W. (1984), “Dimensions of organizational task environments”,
Administrative Science Quarterly, Vol. 29, pp. 52-73.
Flynn, B.B., Sakakibara, S., Schroeder, R.G., Bates, K.A. and Flynn, E.J. (1990), “Empirical research methods in operations management”,Journal of Operations Management, Vol. 9 No. 2, pp. 250-284.
Hayes, R.H. and Wheelwright, S.C. (1984),Restoring Our Competitive Edge: Competing Through Manufacturing, Wiley, New York, NY.
Kaynak, H. (2003), “The relationship between total quality management practices and their effects on firm performance”,Journal of Operations Management, Vol. 21 No. 4, p. 405. Tsikriktsis, N. (2005/2012), “A review of techniques for treating missing data in OM survey
research”,Journal of Operations Management, Vol. 24 No. 1, pp. 53-62.
BPMJ
20,2
Appendix 1
Please indicate the extent to which you agree or disagree with each of the following statements about this plant and organization: 1 – strongly disagree, 2 – disagree, 3 – slightly disagree, 4 – neutral, 5 – slightly agree, 6 – agree, 7 – strongly agree.
Appendix 2
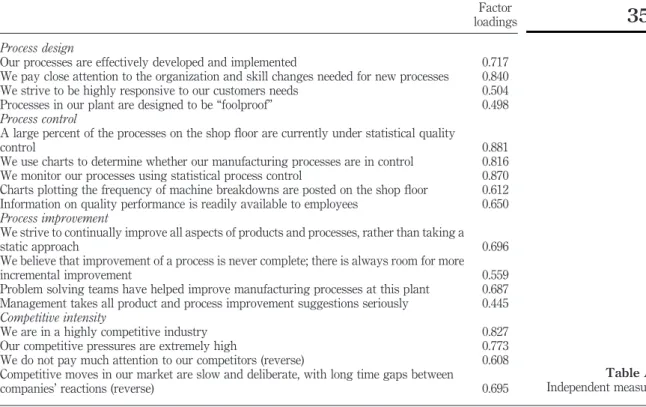
Indicate how your plant compares to its competition in your industry, on a global basis: 1 – poor, low end of industry, 2 – equivalent to competition, 3 – average, 4 – better than average, 5 – superior. Factor loadings Process design
Our processes are effectively developed and implemented 0.717 We pay close attention to the organization and skill changes needed for new processes 0.840 We strive to be highly responsive to our customers needs 0.504 Processes in our plant are designed to be “foolproof” 0.498 Process control
A large percent of the processes on the shop floor are currently under statistical quality
control 0.881
We use charts to determine whether our manufacturing processes are in control 0.816 We monitor our processes using statistical process control 0.870 Charts plotting the frequency of machine breakdowns are posted on the shop floor 0.612 Information on quality performance is readily available to employees 0.650 Process improvement
We strive to continually improve all aspects of products and processes, rather than taking a
static approach 0.696
We believe that improvement of a process is never complete; there is always room for more
incremental improvement 0.559
Problem solving teams have helped improve manufacturing processes at this plant 0.687 Management takes all product and process improvement suggestions seriously 0.445 Competitive intensity
We are in a highly competitive industry 0.827
Our competitive pressures are extremely high 0.773
We do not pay much attention to our competitors (reverse) 0.608 Competitive moves in our market are slow and deliberate, with long time gaps between
companies’ reactions (reverse) 0.695
Table AI.
Independent measures
Factor loadings Efficiency performance
Unit cost of manufacturing 0.623
Conformance to product specificationsa
On time delivery performance 0.589
Inventory turnover 0.838
Cycle time (from raw materials to delivery) 0.794
Innovation performance
Speed of new product introduction into the plant 0.843
On time new product launch 0.749
Product innovativeness 0.826
Note:aItem was delete
Table AII. Dependent measures
Process
management
and innovation
357
About the authors
Janine L. Sanders Jones is an Assistant Professor in the Operations and Supply Chain Management Department at the University of St Thomas. She has a PhD in business administration with a concentration in operations management from the University of Minnesota. She worked as an Industrial Engineer and Process Engineer for Merck & Co. before joining academia. Currently, her research interests include quality management, process management, and organization culture. Her work has been published inDecision Sciences Journal. She is a member of Academy of Management Operations Management Division and Decision Sciences Institute. Janine L. Sanders Jones is the corresponding author and can be contacted at: [email protected]
Kevin Linderman is a Professor of supply chain and operations with a BA in mathematics and philosophy from Minnesota State University, MS in mathematics from Miami University, an MS in management science at Case Western Reserve University, and a PhD in operations from Case Western Reserve University. His research has been supported by a National Science Foundation. He has won a number of research awards including the Chan Hahn Distinguished Paper Award, Elwood S. Buffa Doctoral Dissertation Competition Winner (Co-Advisor), Carlson School of Management Research Award, and Journal of Operations Management Top Cited Article Award. His publications have appeared inManagement Science,Journal of Operations Management,
Decision Science,IIE Transactions,European Journal of Operations Research,Journal of Quality Technology, andJournal of Statistical Computation and Simulation. His research interests in supply chain and operations include quality management, Six Sigma, lean, innovation, knowledge management, high-tech organizations, and environmental operations.
BPMJ
20,2
358
To purchase reprints of this article please e-mail:[email protected] Or visit our web site for further details:www.emeraldinsight.com/reprints