http://iraj.in
CLASSIFICATION OF MOTOR IMAGERY USING PCA FEATURES
FOR BRAIN-COMPUTER INTERFACES
1
VACIUS JUSAS, 2SAM GILVINE SAMUVEL
1,2
Kaunas University of Technology, Studentu 50, Kaunas, LT-51390, Lithuania
Email: [email protected], [email protected]
Abstract— A human brain can communicate with the outside world through another proven way that is the brain computer interface (BCI). A BCI simply decodes the electroencephalogram (EEG) signals that are extracted from the brain activities and then sends the command to the concerned device. The device can be any interactive device like a wheelchair. The efficiency of the BCI completely depends on the process of decoding the EEG. In real world the EEG signals are polluted with different artifacts like electromyogram (EMG) and other background activity. This can cause poor decoding activity. In this paper we implement an algorithm that classifies four different motor imagery tasks where one of the body parts is involved: right hand, left hand, tongue and both feet. The electroencephalogram (EEG) data from the BCI Competition IV is used to test the three feature extraction techniques namely: time domain parameters, band power features and PCA features and with two classifiers: support vector machines (SVM) and linear discriminant analysis (LDA). In this combination of methods PCA allows to reduce the number of features and the results show that the combination of feature extraction such as band power, time domain parameters and PCA with SVM classifier assures the better results than in the case of the single feature extraction method.
Keywords: Band Power, Time Domain Parameters, Principal Component Analysis.
I.INTRODUCTION
The brain computer interfaces are used to convert the brain signals into a control signal that can control an electronic device. The classification of these brain signals is complicated in a real-world scenario. Some of the obstacles to be faced are nonlinearity, low signal to noise ratio and limited training data since it is difficult to collect these signals. There are various methods proposed to capture brain signals like: magneto electroencephalography (MEG), electroencephalography (EEG) and functional magnetic resonance imaging (fMRI). Among the different methods, EEG is the most commonly used approach to monitor the brain activity. EEG is non-invasive, and it does not require surgical involvement. It is also less expensive when compared with the other alternatives.
When it comes to BCI, the signals that are being used by the system for control must be significantly related to specific brain activities that can be created by the user independently. There are several brain states related signals that are being used in BCI control like the motor imagery, P300 and the finger movement [15]. We focus on the motor imagery (MI). This is a mental rehearsal of a motor act without any actual movement being involved. It is observed that it serves an important purpose for BCI by compensating on loss motor functions and it can also handle subjects to operate BCI systems that are based on MI. When we consider a typical application of BCI it involves one or more control states where expected MI events related with some command and various non-control
states, where is no command associated and hence the system must ignore such inputs. The partition of control and non-control states is complicated since there are large within-class variations in non-control, where the brain is not as well controlled as during MI and the BCI must consider it to avoid false detection of control states [15].
A brain-computer interface is a communication system that works well without any peripheral muscular activity [19]. BCI systems are efficient enough to just enable a subject to send commands to the connected electronic device only with the help of brain activity [21]. This kind of an interface can enable communication for people who are affected by a number of motor disabilities [12]. So, to control a BCI we need different brain activity patterns that can be identified by the system and then converted into commands. This involves a classification algorithm [14]. i.e., an algorithm that can automatically estimate the class of data as represented by a feature vector [5]. With the growing demand for EEG-based BCI there are many published results based on the investigation and the evaluation of the classification algorithms [19]. Though there are some interesting reviews of BCI being published [18] few studies are devoted to the review of classification algorithms used for BCI and their evaluation.
Motor imagery is a movement of the body which is imagined that is typically used in preparation for motor execution (or actual movement), where the muscles remain inactive. The hemodynamic response which is produced is very similar to the motor execution. There is smaller increase in blood flow and a mild delay in the activation time [20], as well.
http://iraj.in Motor imagery can give intuitive mapping for the BCI commands because the tasks required for this method are closely related to naturally produced muscle movement commands. This intuitive and natural mapping is helpful for commands and also increases the usability of a BCI system and decreases the mental strain involved in the operation.
Records show that there are various EEG- or fMRI-based studies that uses motor imagery as the sole input method involving two [8], three [3], or four [6] motor imagery classes. The primary and the most important motor imagery class that is used is the right hand vs. left hand. There are some studies that uses both feet together as a third class and tongue motor imagery as a fourth class [4].
As observed that most of the motor imagery (or motor execution) BCI studies focus on right vs. left hand classification, we have Kaiser et al. who studied on detecting right hand vs. both feet motor imagery [11]. Abibullaev et al. researched on the directional movements of the forearm [1]. Ito et al. proposed a four class BCI to differentiate left arm movement, right arm movement, lower leg movement, and the rest of the movements [10].
II.RELATEDWORK
The motor imagery EEG (MI-EEG), that represents one’s active movement intention. This approach has attracted increasing attention in rehabilitation therapy, and fast and accurate feature extraction is the key problem to several successful applications. Based on the SE-isomap and the wavelet packet decomposition (WPD), an adaptive feature extraction method is being proposed in this paper [13]. The MI-EEG is preprocessed to compute a more effective time interval through average power spectrum analysis. WPD then is applied to the selected segment of MI-EEG, and the subject-based optimal wavelet packets (OWPs) with top mean variance difference are obtained separately. The OWP coefficients are further used to compute the time-frequency features statistically and obtain the nonlinear manifold structure features, also the explicit nonlinear mapping, through SE-isomap. The hybrid features are obtained in a serial fusion way and computed by a k-nearest neighbor (KNN) classifier. In this paper they used a convolutional neural network to classify BCI tasks. The convolution neural network represents a deep learning technique; however, the substantial profit was not obtained [17].
The three independent components analysis (ICA) algorithms (FastICA, Infomax and SOBI). This technique is then compared with other preprocessing methods so as to find the extent of improving spatial filtering of EEG data. As reference methods the
author uses common spatial patterns (CSP) (a supervised method, whereas all ICA algorithms are unsupervised), original raw monopolar data and the bipolar derivations are used. With respect to principal component analysis (PCA) the numbers of components were reduced before calculating a spatial filter for Infomax and FastICA [2].
Here they proposed a statistical channel selection method to classify two motor imageries based on introducing l1 norm regularization term in the CSP algorithm that supports sparsity in the weights of the spatial filter. This method uses a filtering technique with a pre-specified subset channel selection strategy [22]. The EEG data is taken from five subjects (aa, av, al, aw, ay) using 118 channels and a 1 kHz sampling rate given by University of Medicine Berlin (Neurophysics Group) and Fraunhofer FIRST (Intelligent Data Analysis Group) with two classes: right foot and right-hand motor imageries. Each class consists of 140 trials. The proposed method was able to minimize the number of channels on average to 13 electrodes (of 118 electrodes), and also the average classification accuracy rate dropped from 77.3 to 73.5 % only. The value of the regularization parameter is subject-specific and was selected manually and hence it must be chosen automatically to generate reasonable results.
Here they proposed an adaptive neural-fuzzy analysis system for single-trial classification of motor imagery (MI) electroencephalogram (EEG) data. This method is associated with wavelet-fractal features and enhanced active segment selection and adaptive fuzzy neural network (AFNN) for recognition of right and left MI data. In addition, the 2D anisotropic Gaussian filter is also used along with the continuous wavelet transform (CWT) and Student’s two-sample t-statistics. Multi resolution fractal features are then extracted from wavelet data using the modified fractal dimension. At last the fractal features are discriminated by AFNN clustering. The system is then tested on two publicly available EEG datasets and compared with several other popular methods [9].
Here they presented the work mainly based on the multiple electrodes EEG recording, to consider a variety of brain stimulation mode and also to explore the temporal and spatial variations of electrical signals. This method is applied to the second-order blind identification, energy entropy of the signal analysis and phase synchronization methods to analyze imagine movement EEG signals processing, extract its features, and also uses the support vector machine (SVM) classification and the backpropagation (BP) neural network method for different types of EEG classification [23]. This approach can imagine movements and achieve higher classification accuracy and designed a BCI
http://iraj.in system based on motion imagination. This system helps participants to more freely imagine and control the virtual car movement or the mouse movement to the right or left. The very invention of this study is to imagine the brain movement and convert them into electrical signal as input signal of the brain-computer interface system. Since imagination is a very complicated process and the brain electrical signal characteristic is not so obvious, we need more feature extraction and classification algorithms.
III.METHODS A.Preprocessing
It is important to remove the artifacts from the EEG signals and keep the required brain-originated signal intact. The easiest technique to remove artifacts is the high-pass filtering of the signal. The eye artifacts take the frequency range of 0–4 Hz, and by filtering these components we reduce the EOG artifacts. The Fig2 shows an example of an EEG signal after filtering the eye artifact reduction. The functional model of BCI system is shown in Fig 3.
200 400 600 800 1000 1200 1400 -200 -100 0 100 200 time A m p litu d e
EEG input s ignal
200 400 600 800 1000 1200 1400 -200 -100 0 100 200 time A m p litu d e Filtered s ignal
Figure 1: Eye artifacts removes using a 7-30 Hz band-pass filter
Figure 2: A typical model of a BCI system
B.Common Spatial Patterns
Common spatial pattern is spatial filtering method to calculate new signals so that the variances of these components contain the most discriminative information considering the different motor imagery classes. This is done by jointly diagonalizing the two corresponding covariance matrices. Hence this method can only be applied to binary (i.e., two classes) problems. But there are extensions of these methods available to handle multiclass problems [2] by combining two or more spatial filters. Hence it reduces the multiclass problem to several binary decisions. In this study data is analyzed using four filters in a one-versus-the-rest scheme. These four matrices are calculated within a time segment of 4.5–
5.5 s inside a trial because a screening of different one-second time windows within a trial revealed this epoch to yield the best discriminability of the data. At the initial stage the raw data was bandpass filtered between 8 Hz and 30 Hz. This range is a good choice for EEG data [2]. So as to compare this method with other available methods the variance was computed within a one second time window. Three different feature subsets are created using the first and the last column of the filtered data for the first subset (in other words the projections consequent to the largest and smallest eigenvalues). The second set contains the second and second last columns and the third set comprises the third and third last columns. In contrast to ICA method, the data filtered with CSP is already ready to serve as input to the classifiers. All these above spatial filtering methods help to solve the problems mentioned above by creating new components from the original data channels. In conclusion, a spatial filter tries to estimate a so-called unmixing matrix W = [w1,..., wn] such that the obtained components y(t)=[y1(t),..., yn(t)] are as representative of the underlying sources as possible [2].
C.PCA Feature
Principal Component Analysis is an unsupervised method that can computes a linear mapping F in order to achieve a low-dimensional representation of the original data where the amount of variance is maximum [25]. PCA is applied in many scientific fields. PCA achieves dimension reduction by creating new, artificial variables called principal components. Each principal component is a linear combination of the observed variables. One of the keys behind the success of PCA is that in addition to the low-dimensional sample representation, it provides a synchronized low-dimensional representation of the variables. The synchronized sample and variable representations provide a way to visually find variables that are characteristic of a group of samples. The main purpose of PCA is to reduce feature or reduce dimensions of data. In terms of mathematics, PCA finds F that maximizes the cost function
(1)
Here S is the sample covariance matrix of X. This linear transformation is formed by an orthogonal basis from the top eigenvectors (i.e. principal components) of the data covariance matrix, in other words the eigenvectors corresponding to the r largest eigenvalues are selected or retained. The input data for this method has to be normalized first and then be applied by PCA in order to mitigate the effects of scale. It is also recommended to avoid computing S
http://iraj.in explicitly because it may be hard when D is very large.
D.Band Power
The literature study shows that there are various methods available for band power feature extraction with respect to EEG signals [16]. Here we use the method was implemented in the Biosig biomedical signal processing library. This calculates the band power by band-pass filtering the signal. According to this method, first the signal is filtered with a band-pass filter that is designed for a given frequency band. In case of a Biosig library a 4-th order Butterworth infinite impulse response (IIR) filter is used.
The next step is that each sample of the resulting signal x[t], which contains only the required frequency components, is being squared to attain the time course of power:
(2)
With the smoothing window size w, the below smoothing operation is applied to the signal that is obtained from the above step:
(3)
This means that the band power for sample n is equal to the average power of w previous samples. The final feature values are equal to ln(p[n]). This logarithm is applied to enhance the performance of linear classification [16].
E.Time Domain Parameters
Another feature extraction technique is the time domain parameters (TDP) that is used in this paper. The TDP as the variances of the first k derivatives of the signal. We use a variant of TDP that was implemented in the Biosig library that calculates time-varying power of the first k derivatives of the signal using the below equation:
(4)
The attained values are then smoothed using an exponential moving average window filter. This is implemented with the below infinite impulse response (IIR) filter:
(5)
Here p(i) is the input signal (i-th order derivative) and y is the filtering result. The u value is used as parameter to calculate the time domain parameters. The smaller the value of u is, the bigger the moving
average window. The final feature values are equal to ln(y[n]) [24].
IV.CLASSIFICATIONMETHODS
F.Linear Discriminant Analysis
Let’s have an example with a set of n data: as a two-dimensional feature space. This is defined using a unit vector w with the below equation (scalar projection of a vector a onto a unit vector w):
(6)
The result of the above equation will be a scalar and hence the projection is reduced from two dimensions to one dimension. Now let’s consider two classes namely∅ and ψ. When the first projection is applied, the data from the above classes can be separated using the threshold of the scalar b. In this case if the second projection was performed instead of the first then the data is inseparable. Linear discriminant analysis (LDA) is a classification algorithm that is used to find a direction w so that projecting the data onto w will increase the distance between the means and reduces the variance of the two classes. In simple terms LDA classifier reduces the below equation:
/ (7)
Where are the means and are
the standard deviations of both classes after projection of the sets onto w.
G.Support Vector Machine
A support vector machine (SVM) is another classifier that is used in this paper to classify the data set. The function in SVM has a hyper plane like projection defined in the below equation:
(8)
The hyper plane is also called as the decision border that divides the feature space into two parts and the classification results are classified into these two classes. The classification of an example to one of these classes depends on the side of the hyper plane in which the example lies.
A support vector machine is transferrable into a non-linear method if a non-non-linear kernel function is used upon it. A kernel function is a function to define a new feature vector of a given example x. This is done by calculating the similarity between the example x and some other example y. There are various similarity functions available, in this thesis we apply the Gaussian kernel that is defined as:
http://iraj.in
(9)
Its value lies between 0 and 1 depending on the similarity of x and y (1 if the two examples are equal). If the features are computed with Gaussian kernel, then non-linear class boundaries can be learned using the SVM classifier. The parameter (standard deviation) controls the width of the kernel function (the larger the value, the wider the function is). In order to achieve a wider Gaussian kernel functions, the examples that are far away from each other are considered to be more similar to each other. Thus, for larger kernel widths the over fitting effect of the algorithm must be reduced.
V.IMPLEMENTATION
The above classifications are evaluated and compared with the help of kappa coefficient. This takes value of 0 for a random classifier and 1 for a perfect classifier that always classifies correctly. The value of the kappa coefficient is computed using the below equation.
K=(po-pe)/(1-pe), (10)
Here po is the classification accuracy and pe is the hypothetical accuracy of a random classifier on the same data. In this paper we consider the value of pe = 0:25. Hence the above equation is written as:
k=(po-0.25)/0.75, (11)
The final measure of performance of a given algorithm is the maximum value of the kappa value from the calculated time-course.
The best results on the test set were obtained when band power features, time domain features and PCA features are used. The maximum kappa value on the testing set was equal to 0.81. PCA feature is used for reduction of dimension consisting of many variables correlated with each other. Initially band power features and time domain features are used for feature extraction. But after using the combination of BP+TDP+PCA features we got the better results. The accuracy and kappa values show that the improvement in the results.
This fact could possibly be used to further improve the accuracy because of less features, if at the cross-validation step the features giving the best accuracy would be chosen for each subject. Although the results obtained when testing all features using cross-validation were very similar to each other ranging from 0:18 to 0:81 kappa. This shows that different features are able to generalize the information
learned from the training set to the test set to various degrees.
VI.RESULTS
We use the 2a data set derived from the BCI Competition IV has proposed this dataset and it is available for download in the BCI Competition web page. It comprises of four-class motor-imagery data. H.Linear discriminant analysis (LDA) classifier In case of the first experiment we used a simple classification algorithm that implements time domain features, band power Features and PCA features using a linear discriminant analysis (LDA) classifier. The algorithm comprises of the following steps: 1. Preprocessing:
a) Reduction of the artifact using band-pass filtering (a 7–30 Hz fifth-order Butterworth bandpass filter was used).
2. Feature extraction:
a) Band power in 8–12 and 14–18 Hz frequency bands were considered as features (smoothing window size — 1 second).
b) Time domain feature extraction c) PCA dimensionality reduction
3. Classification done with linear discriminant analysis classifier. Table 1 demonstrates the results of the above algorithm when we applied on each subject.
I. Support vector machines (SVM) classifier
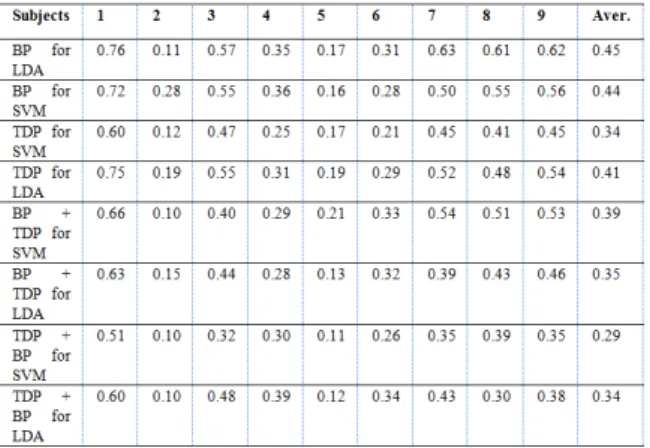
In this section of the paper we find if a change in the classifier used can further enhance the classification results. So, we changed LDA to the support vector machines (SVM) and replaced it with other classification algorithms. The results for each subject for two classifiers with three feature extraction algorithm are provided in Table 1. It is observed that the best results in most of the cases are achieved using the SVM classifier with Time domain feature, band power features and PCA. Using combination of different feature extraction methods, we can expect that the BCI system combines and exploits the corresponding information from each method and this could improve the classifications results. We performed the corresponding experiment.
We obtain the following results (lines 1-4 of table), if we apply the BP and TDP separately. We combine together BP and TDP and we obtain the following results (lines 7-10 of table). However, the number of features is increased. The classification of features requires more efforts and it may be become an obstacle to have a valid result. Therefore, we apply the PCA (lines 11 and 12 of table). We can see that the order of the algorithms has impact to the obtained
http://iraj.in result. We achieve the best result if we apply firstly BP, then TDP and finally PCA. The novelty of the approach is the application of the combination of the several algorithms.
Table 1 Final results of use methods
CONCLUSIONS
In this paper we implemented different feature extraction methods and classification methods. In order to achieve an efficient classification of data combination of several feature extraction methods and two classifiers are considered. To obtain the higher accuracy we consider the band power, time domain and PCA features. The logarithmic band power estimates are the one of the most popular feature extraction methods and it operates in the frequency domain. The time domain parameters are the generalization of the Hjorth parameters and they are defined in time domain. To obtain the higher accuracy we combine BP and TDP methods for feature extraction. The dimensionality of the obtained feature set is larger, in order to decrease the number of the features we apply the method of principal component analysis. Hence, we can drastically reduce the dimensionality of the data. Moreover, it will also enable us to identify what the most important variables in the original feature space are, that contribute the most important features. The SVM and LDA classifiers are used for the classification purpose. Support Vector Machines are perhaps one of the most popular classification methods. Linear discriminant analysis (LDA) is a simple but effective classification method. Among considered combination of the methods the combination of BP, TDP and PCA with SVM classifier showed the best performance.
REFERENCES
[1] Abibullaev B., An J., Jin S. H., Moon J. I., (2014) Classification of brain hemodynamic signals arising from visual action observation tasks for brain? Computer interfaces: A functional near-infrared spectroscopy study. Measurement, vol. 49, pp. 320–328.
[2] Brunner C., Naeem M., Leeb R., Graimann B., Pfurtscheller G. (2007) Spatial filtering and selection of optimized
components in four class motor imagery EEG data using independent components analysis. Elsevier Pattern Recognition Letters 28 (2007) 957–964.
[3] Chae Y., Jeong J., Jo S. (2012) Toward Brain-Actuated Humanoid Robots: Asynchronous Direct Control Using an EEG-Based BCI. IEEE Transactions on Robotics, vol. 28, no. 5, pp. 1131–1144.
[4] Choi B., Jo S. (2013) A Low-Cost EEG System-Based Hybrid Brain Computer Interface for Humanoid Robot Navigation and Recognition. PLoS ONE, vol. 8, no. 9, p. e74583. [5] Duda R. O., Hart P. E., Stork D. G. (2001) Pattern
Recognition, second edition. wileyinterscience.
[6] Doud A. J., Lucas J. P., Pisansky M. T., He B. (2011) Continuous Three-Dimensional Control of a Virtual Helicopter Using a Motor Imagery Based Brain-Computer Interface. PLoS ONE, vol. 6, no. 10, p. e26322.
[7] Müller K-R., Blankertz B. FIRST (Intelligent Data Analysis Group) and University of Medicine Berlin (Neurophysics Group). http://www.bbci.de/competition/iii/ desc_IVa.html, accessed on October 17, 2017.
[8] Fleur K. L., Cassady K., Doud A., Shades K., Rogin E., He B. (2013) Quadcopter control in three-dimensional space using a noninvasive motor imagery-based brain computer interface. Journal of Neural Engineering, vol. 10, no. 4, p. 46003. [9] Hsu W.Y. (2014) Motor Imagery Electroencephalogram
Analysis Using Adaptive Neural-Fuzzy Classification”, International Journal of Fuzzy Systems, Vol. 16, No. 1. [10] Ito T., Akiyama H., Hirano T. (2013) Brain Machine
Interface using Portable Near-InfraRed Spectroscopy - Improvement of Classification Performance based on ICA analysis and Self-proliferating LVQ. In IEEE/RSJ International Conference on Intelligent Robots and Systems, Tokyo, Japan, pp. 851–858.
[11] Kaiser V., Bauernfeind G., Kreilinger A., Kaufmann T., Kubler A., Neuper C., Putz G. R. M. (2014) Cortical effects of user training in a motor imagery-based brain computer interface measured by fNIRS and EEG. NeuroImage. [12] Kubler A., Kotchoubey B., Kaiser J., Wolpaw J. R.,
Birbaumer N. (2001) Brain-computer communication: unlocking the locked in. Psychology Bulletin, 127(3),358– 375.
[13] Li M., Zhu W., Liu H., Yang J. (2017) Adaptive Feature Extraction of Motor Imagery EEG with Optimal Wavelet Packets and SE-Isomap. Applied Sciences (ISSN 2076-3417; CODEN: ASPCC7).
[14] McFarland D. J., Anderson C. W., Muller K. R., Schlogl A., Krusienski D. J. (2006) Bci meeting 2005-workshop on bci signal processing: feature extraction and translation. IEEE Transactions on Neural Systems and Rehabilitation Engineering, 14(2),135 – 138.
[15] Piazentin D. R. M., Rosa J. L G. (2014) Motor imagery classification for Brain-Computer Interfaces through a chaotic neural network, International joint conference on neural networks, 1-8.
[16] T. Solis-Escalante, J. Faller, G. R. Muller-Putz. Broad band time-varying estimation of event-related synchronization for user-independent configuration of a brain switch, In Proceedings of 6th Annual International IEEE EMBS Conference on Neural Engineering San Diego, California, 6 - 8 November 2013, pp. 403-406.
[17] Uktveris T., Jusas V. (2017) Application of Convolutional Neural Networks to Four- Class Motor Imagery Classification Problem. ITC 2/46 Journal of Information Technology and controlVol.46/No.2.
[18] Vallabhaneni A., Wang T., He B. (2005) Brain computer interface, In He B (Ed): Neural Engineering, Kluwer Academic/Plenum Publishers, pages 85–122.
[19] Wolpaw J. R., Birbaumer N, D. McFarland J., Pfurtscheller G., Vaughan T. M. (2002) Brain computer interfaces for communication and control. Clinical Neurophysiology, 113(6), 767–791.
[20] Wriessnegger S. C., Kurzmann J., Neuper C. (2008) Spatio-temporal differences in brain oxygenation between movement execution and imagery: A multichannel near-infrared spectroscopy study. International Journal of Psychophysiology, vol. 67, no. 1, pp. 54–63.
http://iraj.in [21] Vaughan T. M., Heetderks W. J., Trejo L. J., Rymer W. Z.,
Weinrich M., Moore M., Kubler A., Dobkin B. H., Birbaumer N., Donchin E., Wolpaw W., Wolpaw J. R. (2003) Brain-computer interface technology: a review of the second international meeting. IEEE Transactions on Neural Systems and Rehabilitation Engineering, 11(2),94–109.
[22] Yong X., Ward R. K., Birch G. E. (2008) Sparse spatial filter optimization for EEG channel reduction in brain-computer interface. Proceedings of the IEEE International Conference on Acoustics, Speech and Signal Processing (ICASSP), (Las Vegas, Nevada USA).
[23] Zhou Y., Zhao J., Zhou X. (2013) Study on Brain Computer Interface based on Motor Imagery. International Journal of Signal Processing, Image Processing and Pattern Recognition Vol. 6, No. 4.
[24] P. Ofner, G. R. Muller-Putz, C. Neuper, C. Brunner. Comparison of Feature Extraction Methods for Brain-Computer Interfaces. In Proceedings of 5th International BCI Conference 2011, Graz, Austria, September 2011, pp. 1-4. [25] X. Yu, P. Chum, K.-B Sim. Analysis the effect of PCA for
feature reduction in non-stationary EEG based motor imagery of BCI system. Optik, 2014, 125(3), pp. 1498-1502.