FARM ACCOUNTANCY DATA NETWORK AS A TOOL FOR MEASURING EFFICIENCY OF APPLIED NEW TECHNOLOGIES
IN AGRICULTURE
Zorica Vasiljević1
, Vlado Kovačević2, Sladjan Stanković3
Abstract
The aim of the paper is to determine potential use of Farm Accountancy Data Network (FADN) as a tool for measuring efficiency of new technologies in agribusiness sector in EU and Serbia.
The paper provides a broader context for understanding the concept of new technologies as a Precision Agriculture and Smart Agriculture. Effective system for measuring results of applied new technologies in agriculture is analyzed in this paper both at the level of individual farms and agrarian policy.
FADN is the accountancy system uniform for all EU countries. As the FADN has same methodology in collecting and processing data for all EU countries, results are comparable for all EU countries and candidate countries. Serbia has started with FADN introduction in 2011 and an efficient system has been established so far.
Results of the paper are showing that FADN can be excellent tool for measuring effects of the new technologies’ application. The FADN data as e.g. the used working unit (AWU), fixed capital, variable expense, yields per hectare, profit margin can be used as indicators for effectiveness of the new applied technologies. In this paper there are suggested some new indicators which could be included within the FADN.
Keywords: Precision Agriculture, Smart Agriculture, FADN, Efficiency of new technologies.
1 Zorica Vasiljevic Ph.D, Full Professor, University of Belgrade – Faculty of
Agriculture, Nemanjina Street no. 6, 11080 Belgrade-Zemun, Serbia, Phone: +381 641439942, E-mail: vazor@agrif.bg.ac.rs
2
Vlado Kovačević, Ph.D., Special adviser to the Minister, Ministry of Agriculture and Environmental Protection of the Republic of Serbia, Nemanjina Street no. 22-26, 11000 Belgrade, Serbia, Phone: +381 64 65 81 519, E-mail: vlado.kovacevic@minpolj.gov.rs 3 Slađan Stanković PhD, Scientific associate, Institut for Science Application in
Agriculture, Despota Stefana 68b, 11000 Belgrade, Serbia, Phone: +381 64 84 35 327 , E-mail: ssladjan@beotel.net
Introduction
The Food and Agriculture Organization (FAO) estimates that there will be 9 billion people in the world by 2050. It will be needed 70% increase in food production compared to 2005 level to feed the aforementioned people. Thus we have to grow, harvest, distribute and consume our food more efficiently. Considering the fact that we are not gaining additional resources such as land or water, the only solution lies in introducing new technologies in agriculture (FAO, 2002).
One of the new technologies in agriculture the international scene has paid great attention to is the Precision Agriculture. Applications of precision agriculture include auto-guiding systems and variable-rate technology that allow for precise tillage, seeding, fertilization, irrigation, herbicide and pesticide application, harvesting and animal husbandry. Crop management and aspects of animal rearing are optimized thanks to the use of information collected from sensors mounted on-board agricultural machinery (soil properties, leaf area, animal internal temperature) or derived from high resolution remotely sensed data (plant physiological status). The benefits to be obtained include increased yields and profitability (mainly for arable farmers), increased animal welfare, and improvement of various aspects of environmental management (EU Directorate general for internal policies, 2014).
It is important for all countries to monitor the situation in the field of application of modern technologies in agriculture with aim that subsidies in new technologies be conceived to deliver optimal effects. Measuring of new technologies efficiency beside importance for the agrarian policy is important for farmers in order to measure efficiency of new technologies implemented at the farm level (Vasiljevic et al., 2012).
FADN is an important instrument in measuring the efficacy of new technology in agriculture in the EU and candidate countries with established FADN (Vasiljević, 2012).
The Farm Accountancy Data Network (FADN) is an instrument for evaluating the income of agricultural holdings and the impacts of the Common Agricultural Policy and national agricultural policies. The concept of the FADN was launched in 1965 when Council Regulation 79/65 established the legal basis for the organization of the network. It consists of an annual survey carried out by the Member States of the European Union. The services responsible in the Union for the operation of the FADN collect every year accountancy data from a sample of the agricultural holdings in the European
Union. Derived from national surveys, the FADN is the only source of microeconomic data that is harmonized, i.e. the bookkeeping principles are the same in all countries. Holdings are selected to take part in the survey on the basis of sampling plans established at the level of each region in the Union. The survey does not cover all the agricultural holdings in the Union but only those which due to their size are considered commercial. The applied methodology aims to provide representative data along three dimensions: region, economic size and type of farming. While the European Commission is the primary user of analyses based on FADN data, the aggregated data can be found in the Standard Results database (Regulation (EC) No 1166/2008). The aim of the network is to gather accountancy data from farms for the determination of incomes and business analysis of agricultural holdings. Currently, the annual sample covers approximately 80,000 holdings. They represent a population of about 5,000,000 farms in the EU, which covers approximately 90% of the total utilized agricultural area (UAA) and account for about 90% of the total agricultural production. The information collected, for each sample farm, concerns approximately 1,000 variables.
It is important to note that the collecting and processing methodology is the same for all EU countries thus the FADN data are comparable between them. FADN data can be used for monitoring of the situation in the fields of modern technologies in agriculture, as well as the effects of agricultural policy at the macro level. The farmers included in the FADN sample can use FADN Feedback form to monitor the effects of the applied new technologies on the farm.
FADN as a tool for measuring efficiency of applied new technologies in agriculture – macro level
At the macro level, the FADN allows EU member states to compare results of applied new technologies in agriculture. At the national level it measures the efficiency of agricultural policy (primarily subsidies) in the field of new technologies in agricultural production.
In this part of the paper there are presented indicators that have been already available within the FADN, as well as indicators that can be calculated from existing data.
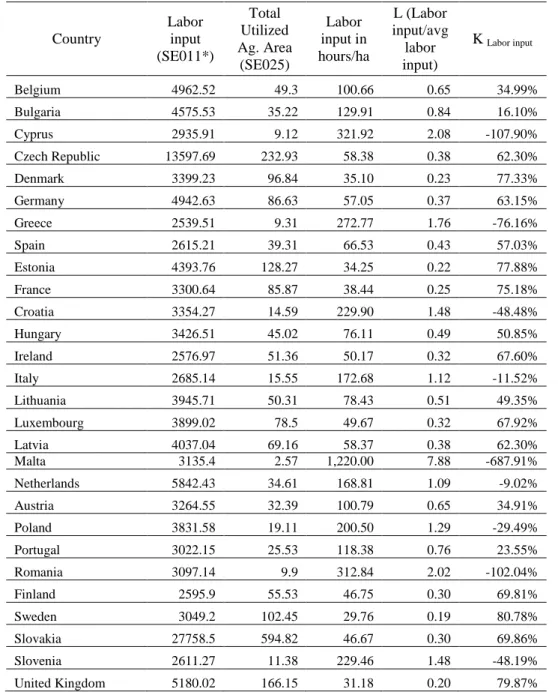
Table 1: Labor data as indicators of new technologies efficiency - FADN 2013 Country Labor input (SE011*) Total Utilized Ag. Area (SE025) Labor input in hours/ha L (Labor input/avg labor input) K Labor input Belgium 4962.52 49.3 100.66 0.65 34.99% Bulgaria 4575.53 35.22 129.91 0.84 16.10% Cyprus 2935.91 9.12 321.92 2.08 -107.90% Czech Republic 13597.69 232.93 58.38 0.38 62.30% Denmark 3399.23 96.84 35.10 0.23 77.33% Germany 4942.63 86.63 57.05 0.37 63.15% Greece 2539.51 9.31 272.77 1.76 -76.16% Spain 2615.21 39.31 66.53 0.43 57.03% Estonia 4393.76 128.27 34.25 0.22 77.88% France 3300.64 85.87 38.44 0.25 75.18% Croatia 3354.27 14.59 229.90 1.48 -48.48% Hungary 3426.51 45.02 76.11 0.49 50.85% Ireland 2576.97 51.36 50.17 0.32 67.60% Italy 2685.14 15.55 172.68 1.12 -11.52% Lithuania 3945.71 50.31 78.43 0.51 49.35% Luxembourg 3899.02 78.5 49.67 0.32 67.92% Latvia 4037.04 69.16 58.37 0.38 62.30% Malta 3135.4 2.57 1,220.00 7.88 -687.91% Netherlands 5842.43 34.61 168.81 1.09 -9.02% Austria 3264.55 32.39 100.79 0.65 34.91% Poland 3831.58 19.11 200.50 1.29 -29.49% Portugal 3022.15 25.53 118.38 0.76 23.55% Romania 3097.14 9.9 312.84 2.02 -102.04% Finland 2595.9 55.53 46.75 0.30 69.81% Sweden 3049.2 102.45 29.76 0.19 80.78% Slovakia 27758.5 594.82 46.67 0.30 69.86% Slovenia 2611.27 11.38 229.46 1.48 -48.19% United Kingdom 5180.02 166.15 31.18 0.20 79.87%
Source: FADN, Labor input in hours/ha, L (Labor input/avg labor input) and K Labor input
author’s calculation based on FADN data.
*Additional information on SE data can be found on FADN web page: http://ec.europa.eu/agriculture/rica/concept_en.cfm.
Information related to labor can be used as an indicator for new technologies application with assumption that new technologies will have lower labor input4.
First it is calculated Labor input in hours/ha, than for each country average labor input compared to EU. K Labor input is calculated as:
K Labor input = (1- Labor input/avg labor input)*100%
According to the table 1 more efficient technologies and lower labor hours/ha has Denmark with only 29.76 hours/ha, Labor input/avg labor input 0.19 (almost five times lower use of labor hours/ha compared to EU average) and K Labor input 80.78%. Malta has most hours/ha and more extensive production with 1,220 labor hours/ha.
Table 2: Production data as indicators of new technologies efficiency -FADN 2013 Country Yield of wheat (SE110) Dwheat Yield of maize (SE115) Dcorn Milk yield (SE125) Dmilk Belgium 90.38 71.14% 128.21 55.58% 6998.21 7.74% Bulgaria 42.75 -19.05% 68.86 -16.44% 3160.46 -51.34% Cyprus 3.97 -92.48% 67.7 -17.85% 7481.36 15.18% Czech Republic 57.62 9.11% 72.21 -12.38% 7348.07 13.13% Denmark 72.59 37.46% 79.52 -3.51% 8858.33 36.38% Germany 78.25 48.17% 81.25 -1.41% 7696.43 18.49% Greece 31.13 -41.05% 123.88 50.32% 6043.39 -6.96% Spain 33.92 -35.77% 116.08 40.86% 7073.13 8.89% Estonia 35.66 -32.47% / / 7961.83 22.58% France 73.45 39.08% 81.15 -1.53% 6890.09 6.08% Croatia 48.05 -9.01% 69.34 -15.86% 4051.33 -37.63% Hungary 47.49 -10.07% 57.43 -30.31% 6496.71 0.02% Ireland 85.65 62.19% / / 5362.06 -17.45% Italy 54.53 3.26% 97.08 17.80% 5797.92 -10.74% Lithuania 47.02 -10.96% / / 5561.06 -14.39% Luxembourg 63.64 20.51% 58.81 -28.64% 7025.11 8.15% Latvia 38.89 -26.36% / 5713.18 -12.04% Malta / / / 6516.82 0.33% Netherlands 88.11 66.84% 117.76 42.90% 7901.28 21.64% 4
Information on labor hours/ha and K coefficient should be analyzed with data from the table 3 output/ha.
Austria 51.35 -2.76% 93.65 13.64% 6493.81 -0.03% Poland 52.74 -0.13% 79.78 -3.19% 5107.38 -21.37% Portugal 20.86 -60.50% 77.2 -6.32% 7044.79 8.46% Romania 39.14 -25.89% 51.39 -37.64% 3357.34 -48.31% Finland 40.35 -23.59% / / 8665.06 33.40% Sweden 57.87 9.58% 65.01 -21.11% 8560.02 31.78% Slovakia 46.4 -12.14% 54.49 -33.88% 6260.45 -3.62% Slovenia 47.19 -10.64% 73.01 -11.41% 5122.35 -21.14% U. Kingdom 76.99 45.79% 99.3 20.50% 7324.62 12.77% EU Average 52.81 82.41 6495.45
Source: FADN, Dwheat,Dcorn, Dmilk, author’s calculation based on FADN data.
Assumption is that new technologies will lead to higher yield5. Dwheat,Dcorn, Dmilk are calculated:
Dyield = (Country yield/EU average yield-1)*100%
According to the table 2 the highest efficiency in applied technologies has Belgium for wheat and corn, while Denmark has the highest D coefficient for milk - 36.38%, and best technologies in milk production. Bulgaria and Romania are countries with the lowest D coefficients and the lowest technologies applied in agricultural production.
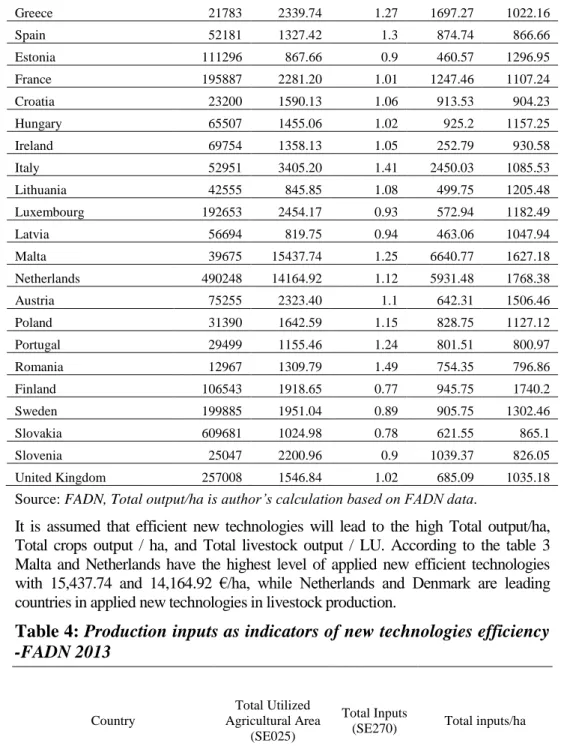
Table 3: Production output as an indicator of new technologies efficiency -FADN 2013 Country Total output (SE131) Total output/ha Total output / Total input (SE132) Total crops output / ha (SE136) Total livestock output / LU (SE207) Belgium 265975 5395.03 1.15 2008.89 1175.98 Bulgaria 38872 1103.69 0.96 782.4 927.14 Cyprus 40769 4470.28 1.18 1713.24 1773.62 Czech Republic 344709 1479.88 0.89 830.5 1230.44 Denmark 484484 5002.93 1.06 1526.62 1678.69 Germany 266707 3078.69 1.06 1261.14 1530.15 5
This indicator has to be followed with analysis on climate, soil fertility and water supply in compared countries.
Greece 21783 2339.74 1.27 1697.27 1022.16 Spain 52181 1327.42 1.3 874.74 866.66 Estonia 111296 867.66 0.9 460.57 1296.95 France 195887 2281.20 1.01 1247.46 1107.24 Croatia 23200 1590.13 1.06 913.53 904.23 Hungary 65507 1455.06 1.02 925.2 1157.25 Ireland 69754 1358.13 1.05 252.79 930.58 Italy 52951 3405.20 1.41 2450.03 1085.53 Lithuania 42555 845.85 1.08 499.75 1205.48 Luxembourg 192653 2454.17 0.93 572.94 1182.49 Latvia 56694 819.75 0.94 463.06 1047.94 Malta 39675 15437.74 1.25 6640.77 1627.18 Netherlands 490248 14164.92 1.12 5931.48 1768.38 Austria 75255 2323.40 1.1 642.31 1506.46 Poland 31390 1642.59 1.15 828.75 1127.12 Portugal 29499 1155.46 1.24 801.51 800.97 Romania 12967 1309.79 1.49 754.35 796.86 Finland 106543 1918.65 0.77 945.75 1740.2 Sweden 199885 1951.04 0.89 905.75 1302.46 Slovakia 609681 1024.98 0.78 621.55 865.1 Slovenia 25047 2200.96 0.9 1039.37 826.05 United Kingdom 257008 1546.84 1.02 685.09 1035.18
Source: FADN, Total output/ha is author’s calculation based on FADN data.
It is assumed that efficient new technologies will lead to the high Total output/ha, Total crops output / ha, and Total livestock output / LU. According to the table 3 Malta and Netherlands have the highest level of applied new efficient technologies with 15,437.74 and 14,164.92 €/ha, while Netherlands and Denmark are leading countries in applied new technologies in livestock production.
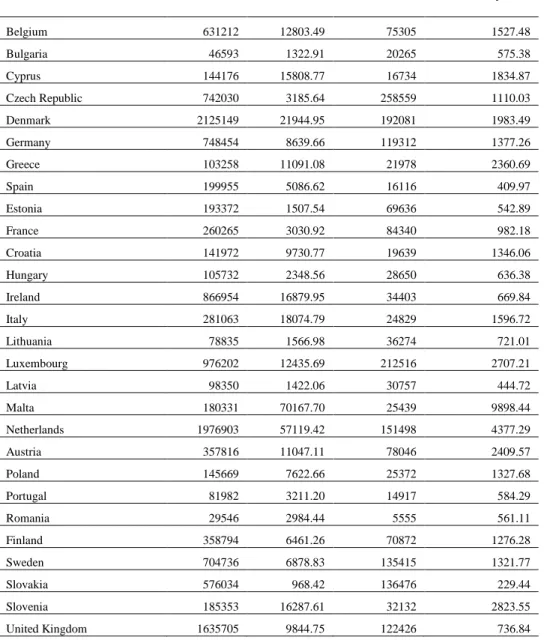
Table 4: Production inputs as indicators of new technologies efficiency -FADN 2013 Country Total Utilized Agricultural Area (SE025) Total Inputs
(SE270) Total inputs/ha
Belgium 49.3 231400 4693.71
Bulgaria 35.22 40647 1154.09
Czech Republic 232.93 387348 1662.94 Denmark 96.84 458104 4730.52 Germany 86.63 250848 2895.63 Greece 9.31 17171 1844.36 Spain 39.31 40213 1022.97 Estonia 128.27 123493 962.76 France 85.87 193424 2252.52 Croatia 14.59 21969 1505.76 Hungary 45.02 64056 1422.83 Ireland 51.36 66417 1293.17 Italy 15.55 37524 2413.12 Lithuania 50.31 39554 786.21 Luxembourg 78.5 206081 2625.24 Latvia 69.16 60233 870.92 Malta 2.57 31767 12360.70 Netherlands 34.61 436823 12621.29 Austria 32.39 68585 2117.47 Poland 19.11 27207 1423.70 Portugal 25.53 23860 934.59 Romania 9.9 8698 878.59 Finland 55.53 139104 2505.02 Sweden 102.45 223814 2184.62 Slovakia 594.82 780671 1312.45 Slovenia 11.38 27813 2444.02 United Kingdom 166.15 253070 1523.14 Source: FADN.
The highest output with higher level of technologies applied is followed by higher inputs.
Modern technologies are characterized by higher fixed costs and lover variable costs per production area.
According to the table 4, Malta and Netherlands have the highest implemented technologies with the highest inputs/ha, due to the large percentage of indoor production in these two countries.
Table 5: Farm value and income as indicators of new technologies efficiency - FADN 2013 Country Gross Farm Income (SE410) Gross Farm Income/ha Farm Net Value Added (SE415) Farm Net Value Added (SE415) Farm Net Income (SE420) Farm Net Income/h a Belgium 119795 2429.92 86559 1755.76 57678 1169.94 Bulgaria 24353 691.45 19483 553.18 8866 251.73 Cyprus 19462 2133.99 15876 1740.79 11248 1233.33 Czech R. 178006 764.20 138603 595.04 53979 231.74 Denmark 205377 2120.79 162003 1672.89 59011 609.37 Germany 127625 1473.22 95768 1105.48 49958 576.68 Greece 16413 1762.94 12811 1376.05 10487 1126.42 Spain 32019 814.53 28623 728.14 22059 561.15 Estonia 48373 377.12 32218 251.17 16716 130.32 France 95917 1117.00 62665 729.77 31580 367.77 Croatia 11436 783.82 7212 494.31 4702 322.28 Hungary 34911 775.46 28848 640.78 17083 379.45 Ireland 37256 725.39 28281 550.64 22172 431.70 Italy 33638 2163.22 26707 1717.49 20757 1334.86 Lithuania 24230 481.61 16404 326.06 14081 279.88 Luxembourg 120485 1534.84 65291 831.73 44908 572.08 Latvia 25630 370.59 16725 241.83 9861 142.58 Malta 15490 6027.24 12947 5037.74 11140 4334.63 Netherlands 199540 5765.39 147865 4272.32 66820 1930.66 Austria 47556 1468.23 30012 926.58 25402 784.25 Poland 16678 872.74 11951 625.38 9835 514.65 Portugal 19457 762.12 15765 617.51 13432 526.13 Romania 8564 865.05 7293 736.67 6133 619.49 Finland 55510 999.64 31387 565.23 17857 321.57 Sweden 79532 776.30 52615 513.57 16286 158.97 Slovakia 268247 450.97 176076 296.02 -8683 -14.60 Slovenia 13863 1218.19 5905 518.89 5711 501.85 United K. 116256 699.71 83846 504.64 46465 279.66
Source: FADN, Gross Farm Income/ha ad Farm Net Income/ha is author’s calculation based on FADN data;
Farm value and income can be indicators of new technologies efficiency. As the new modern technologies are costly higher, the farm value will indicate higher level of applied technologies. Income indicators are important in measuring new technologies efficiency as it is expected that applied technologies will lead to the higher farm income. According to the Gross Farm Income/ha indicator, Malta and Netherlands have the highest level and efficiency of implemented new technologies with 6,027.24 and 5,765.39 €/ha.
Table 6: Assets as indicators of new technologies efficiency - FADN 2013
Country Total fixed
assets (SE441) Total fixed assets/ha Machinery (SE455) Worth of Machinery/ha Belgium 631212 12803.49 75305 1527.48 Bulgaria 46593 1322.91 20265 575.38 Cyprus 144176 15808.77 16734 1834.87 Czech Republic 742030 3185.64 258559 1110.03 Denmark 2125149 21944.95 192081 1983.49 Germany 748454 8639.66 119312 1377.26 Greece 103258 11091.08 21978 2360.69 Spain 199955 5086.62 16116 409.97 Estonia 193372 1507.54 69636 542.89 France 260265 3030.92 84340 982.18 Croatia 141972 9730.77 19639 1346.06 Hungary 105732 2348.56 28650 636.38 Ireland 866954 16879.95 34403 669.84 Italy 281063 18074.79 24829 1596.72 Lithuania 78835 1566.98 36274 721.01 Luxembourg 976202 12435.69 212516 2707.21 Latvia 98350 1422.06 30757 444.72 Malta 180331 70167.70 25439 9898.44 Netherlands 1976903 57119.42 151498 4377.29 Austria 357816 11047.11 78046 2409.57 Poland 145669 7622.66 25372 1327.68 Portugal 81982 3211.20 14917 584.29 Romania 29546 2984.44 5555 561.11 Finland 358794 6461.26 70872 1276.28 Sweden 704736 6878.83 135415 1321.77 Slovakia 576034 968.42 136476 229.44 Slovenia 185353 16287.61 32132 2823.55 United Kingdom 1635705 9844.75 122426 736.84
Source: FADN, Total fixed assets/ha and Worth of Machinery/ha is author’s calculation
based on FADN data.
Data on average farm assets as indicators of new technologies efficiency are based on the fact that new technology is costly and higher value of asset is indicator of higher level of technologies applied. Higher worth of machinery is indicating higher level of technologies on farms. According
to the Worth of machinery, Malta has the highest level of applied technology and it is followed by Netherlands.
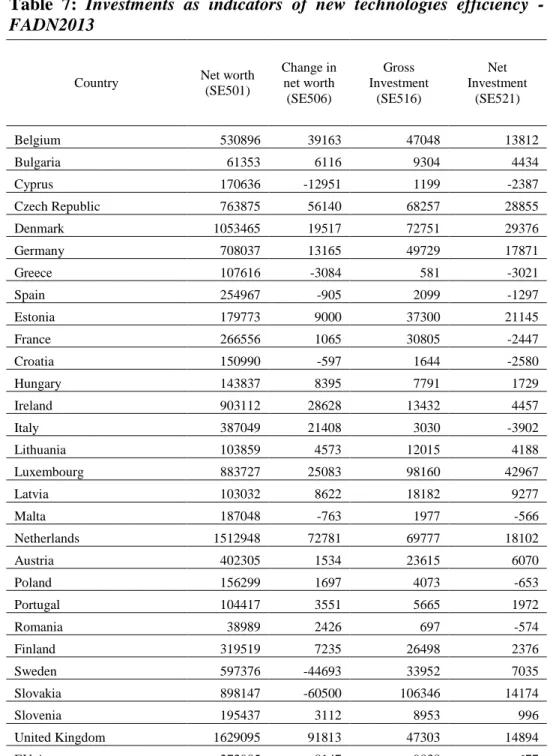
Table 7: Investments as indicators of new technologies efficiency - FADN2013
Country Net worth
(SE501) Change in net worth (SE506) Gross Investment (SE516) Net Investment (SE521) Belgium 530896 39163 47048 13812 Bulgaria 61353 6116 9304 4434 Cyprus 170636 -12951 1199 -2387 Czech Republic 763875 56140 68257 28855 Denmark 1053465 19517 72751 29376 Germany 708037 13165 49729 17871 Greece 107616 -3084 581 -3021 Spain 254967 -905 2099 -1297 Estonia 179773 9000 37300 21145 France 266556 1065 30805 -2447 Croatia 150990 -597 1644 -2580 Hungary 143837 8395 7791 1729 Ireland 903112 28628 13432 4457 Italy 387049 21408 3030 -3902 Lithuania 103859 4573 12015 4188 Luxembourg 883727 25083 98160 42967 Latvia 103032 8622 18182 9277 Malta 187048 -763 1977 -566 Netherlands 1512948 72781 69777 18102 Austria 402305 1534 23615 6070 Poland 156299 1697 4073 -653 Portugal 104417 3551 5665 1972 Romania 38989 2426 697 -574 Finland 319519 7235 26498 2376 Sweden 597376 -44693 33952 7035 Slovakia 898147 -60500 106346 14174 Slovenia 195437 3112 8953 996 United Kingdom 1629095 91813 47303 14894 EU Average 272905 8147 9838 677 Source: FADN.
Investments as indicators of new technologies efficiency are based on the fact that for new technologies investments are needed. Higher investment is needed for the higher level of technologies.
For agrarian policy related to new technologies it is important to analyze gross investment, net investment, net worth, as well as changes related to these indicators.
FADN as a tool for measuring efficiency of applied new technologies in agriculture on farms
Farmers can use FADN in measuring efficiency of applied new technologies on farms. There are two possibilities.
First, farmers included in the FADN are receiving on the annual level FADN Feedback form.
Feedback form contains farmer’s data compared with the average data for producers within the same line of production.
Second possibility for farmers not involved in the FADN is to use FADN public reports and compared with their own data.
Feedback form is not conditioned by the EU, thus each EU Member State decides on the Feedback forms.
Farmers not involved within the FADN can use FADN reports and FADN public database and compare their own data with FADN averages.
FADN indicators are giving to the farmers the answers to questions such as:
1. What are the effects of the application of new technologies on the farm?
2. Is there improvement in average operating result after applying the new technology?
3. Is the new technology improving the average operating results on farm compared to all the farmers involved in the same line of work in its own country and compared to other EU countries?
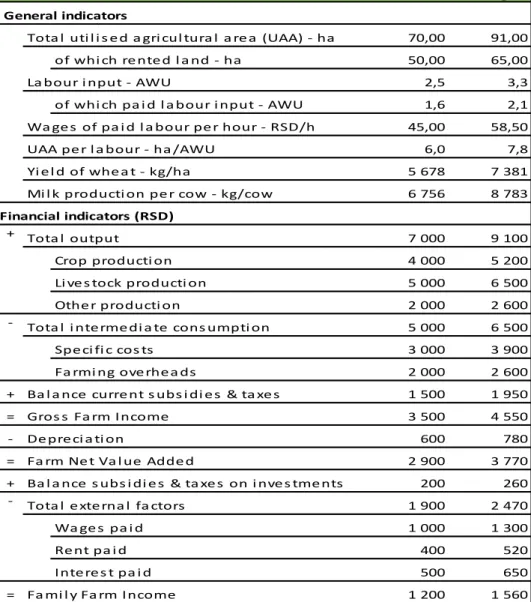
Table 8: An example of a Feedback form within the FADN system in Serbia
Farm data Group
average Formula General indicators
Tota l uti l i s e d a gri cul tura l a re a (UAA) - ha 70,00 91,00 SE025
of whi ch re nte d l a nd - ha 50,00 65,00 SE030
La bour i nput - AWU 2,5 3,3 SE010
of whi ch pa i d l a bour i nput - AWU 1,6 2,1 SE020
Wa ge s of pa i d l a bour pe r hour - RSD/h 45,00 58,50 SE370 / SE021
UAA pe r l a bour - ha /AWU 6,0 7,8 SE025 / SE010
Yi e l d of whe a t - kg/ha 5 678 7 381 SE110 x 100
Mi l k producti on pe r cow - kg/cow 6 756 8 783 SE125
Financial indicators (RSD)
Tota l output 7 000 9 100 SE131
Crop producti on 4 000 5 200 SE135
Li ve s tock producti on 5 000 6 500 SE206
Othe r producti on 2 000 2 600 SE256
Tota l i nte rme di a te cons umpti on 5 000 6 500 SE275
Spe ci fi c cos ts 3 000 3 900 SE281
Fa rmi ng ove rhe a ds 2 000 2 600 SE336
+ Ba l a nce curre nt s ubs i di e s & ta xe s 1 500 1 950 SE600
= Gros s Fa rm I ncome 3 500 4 550 SE410
- De pre ci a ti on 600 780 SE360
= Fa rm Ne t Va l ue Adde d 2 900 3 770 SE410
+ Ba l a nce s ubs i di e s & ta xe s on i nve s tme nts 200 260 SE405
Tota l e xte rna l fa ctors 1 900 2 470 SE365
Wa ge s pa i d 1 000 1 300 SE370 Re nt pa i d 400 520 SE375 I nte re s t pa i d 500 650 SE380 = Fa mi l y Fa rm I ncome 1 200 1 560 SE420 +
-Source: FADN Serbia.
In addition to the mandatory information required by the European Commission, each national FADN system may include information that is intended for use at national level. So it can be recommended an inclusion in the collection procedure, processing and Feedback form the direct data on application of new modern technologies. For example, it can be recommended to include the following:
Data on the use of alternative energy sources, solar, wind and biomass; Data on irrigation;
Information about using technologies like sensor automatic irrigation and fertilization, the use of satellite-guided machinery, etc.
Conclusion
According to the survey analyzed in this paper, it could be concluded based on the indicators used, that the highest level of applied technology in agricultural production have Malta and Netherlands, while the lowest level have Bulgaria and Romania (in 2013).
Given the growing importance of increase in average yields and environmental protection caused primarily by constant increase in the number of inhabitants in the world, application of new technologies are getting more and more important.
The tendency of governments is to create incentives aimed at development and application of new technologies. One of the basic conditions for a successful national agricultural policy as well as application of new technologies on the farm is to establish an effective system for monitoring the results of the new technologies’ application at the macro and micro level.
Analyses in this paper show that the FADN system can be useful for analyzing the efficiency of application of new technologies on the farm through the Feedback form and/or the public FADN database.
The recommendation could be given to the inclusion of information related to the application of new technologies within the national FADN.
References
1. EU Commission web page - FADN unit DGAGRI – Available at: http://ec.europa.eu/agriculture/ricaprod/ Accessed: 08.08.2015.
2. EU Directorate general for internal policies, (2014): Study: Precision Agriculture: An opportunity for EU farmers – potential support with the CAP 2014-2020, Rome.
3. European Union official FADN web Available at:
http://ec.europa.eu/agriculture/rica/legalbasis_en.cfm Accessed: 22.03. 2016. 4. FADN Serbia: Available at: http://www.fadn.rs/. Accessed: 05.04. 2016.
5. FAO (2002): World agriculture: towards 2015/2030, ISBN 92-5-104761-8, Rome.
6. Regulation (EC) No 1166/2008 of the European Parliament and of the Council of 19th November 2008 on farm structure surveys and the survey on agricultural production methods and repealing Council Regulation (EEC) No 571/88
7. Vasiljević, Z. (2012): Uspostavljanje mreže računovodstvenih podataka na porodičnim poljoprivrednim gazdinstvima u Srbiji, u časopisu za pravo i ekonomiju evropskih integracija “Izazovi evropskih integracija”, Tema broja “Poljoprivreda Srbije u procesu evropskih integracija”, Broj 18. Izdavač Javno preduzeće Službeni glasnik uz podršku GIZ, Urednik Nikola Jovanović, ISSN 1820-9459, COBISS.SR-ID 1511881740, UDK 657:631.115.11, pp. 27-40.
8. Vasiljevic, Z., Zaric, V., Ivkov, I. (2012): Recording of accountancy data at the family farms in Serbia. Third International Scientific Symposium "Agrosym Jahorina 2012". November 15-17, 2012, Jahorina, Faculty of Agriculture, ISBN 978-99955-751-0-6: COBISS.BH-ID 3336984: pp. 599-604.