Advanced Signal Processing Solutions for Brain-Computer
Interfaces: From Theory to Practice
Golnar Kalantar
A Thesis in
The Department of
Concordia Institute for Information Systems Engineering
Presented in Partial Fulfillment of the Requirements for the Degree of
Master of Applied Science (Quality Systems Engineering) at Concordia University
Montr´eal, Qu´ebec, Canada
June 2018
c
C
ONCORDIAU
NIVERSITY School of Graduate StudiesThis is to certify that the thesis prepared
By: Golnar Kalantar
Entitled: Advanced Signal Processing Solutions for Brain-Computer Interfaces: From Theory to Practice
and submitted in partial fulfillment of the requirements for the degree of
Master of Applied Science (Quality Systems Engineering)
complies with the regulations of this University and meets the accepted standards with respect to originality and quality.
Signed by the Final Examining Committee:
Chair Dr. Name of the Chair
External Examiner Dr. Name of External Examiner
Examiner Dr. Name of Examiner One
Supervisor Dr. Yong Zeng
Approved by
, Chair
Department of Concordia Institute for Information Systems Engi-neering
2018
Amir Asif, Dean
Abstract
Advanced Signal Processing Solutions for Brain-Computer Interfaces: From Theory to Practice
Golnar Kalantar
As the field of Brain-Computer Interfaces (BCI) is rapidly evolving within both academia and industry, the necessity of improving the signal processing module of such systems becomes of sig-nificant practical and theoretical importance. Additionally, the employment of Electroencephalog-raphy (EEG) headset, which is considered as the best non-invasive modality for collecting brain signals, offers a relatively more user-friendly experience, affordability, and flexibility of design to the developers of a BCI system. Motivated by the aforementioned facts, the thesis investigates several venues through which an EEG-based BCI can more accurately interpret the users’ inten-tion. The first part of the thesis is devoted to development of theoretical approaches by which the dimensionality of the collected EEG signals can be reduced with minimum information loss. In this part, two novel frameworks are proposed based on graph signal processing theory, referred to as the GD-BCI and the GDR-BCI, where the geometrical structure of the EEG electrodes are em-ployed to define and configure the underlying graphs. The second part of the thesis is devoted to seeking practical, yet facile-to-implement, solutions to improve the classification accuracy of BCI systems. Finally, in the last part of the thesis, inspired by the recent surge of interest in hybrid BCIs, a novel framework is proposed for cuff-less blood pressure estimation to be further coupled with an EEG-based BCI. Referred to as the WAKE-BPAT, the proposed framework simultaneously pro-cesses Electrocardiography (ECG) and Photoplethysmogram (PPG) signals via an adaptive Kalman filtering approach.
Acknowledgments
This thesis would not have been possible without the guidance, collaboration, and encourage-ment of several individuals who in one way or another contributed and extended their valuable assistance in the preparation and completion of my research work. It is a pleasure to convey my gratitude to them all in my humble acknowledgment.
First and foremost, I would like to thank my supervisor, Professor Arash Mohammadi, and express my great appreciation for his guidance, patience, and support during these two years of my Master studies. The door to Prof. Mohammadis office was always open whenever I ran into a trouble spot or had a question about my research or writing. I am grateful for all the encouragements during my Master’s degree and opportunities he sought to provide for me.
The journey of master’s studies would have not been the same without the thoughtful comments during each of the meetings I had with Professor Amir Asif. His deep knowledge and astute vision in science has always been an inspiration to me and my work. Also, I would like to specially thank Professor Nizar Bouguila, for teaching me how to employ quality methodologies in all aspects of my life, a lesson I have carried with me ever since my first semester at Concordia University, throughout my research work.
I gratefully acknowledge my fellow colleagues, Sourav Kumar Mukhopadhyay and Tim A. Maloney, for their constant help and support and active interest.
I must express my very profound gratitude to my parents, their prayers and positive energy has been a great spiritual support for me not to give up, ever. Words cannot express how thankful I am for their wise counsel, sympathetic ear, and all the sacrifices they made for my success.
Muhammad Nasir Shafique for being the realization of truth and honesty, keeping an eye on my well-being even if he was not physically present, and making sure I value my potentials and I am on my way of greater good. Second, Mahsa Mirgholami, for standing by my side regardless of what I was going through, and never stopped reassuring me to pave my desired path and reach the milestones. Mahsa and Nasir provided me with unfailing support and continuous encouragement throughout the process of researching and writing this thesis. This accomplishment would not have been possible without them. Thank you.
Contents
Acknowledgments iv List of Figures ix List of Tables xi Abbreviation 1 1 Thesis Overview 3 1.1 Outline . . . 3 1.2 Thesis Contributions . . . 41.3 Organization of the Thesis . . . 7
2 Background and Literature Review on Brain Computer Interfacing 8 2.1 Brain Computer Interfaces: Why and How? . . . 8
2.1.1 Introduction to the BCIs . . . 9
2.2 Electroencephalography (EEG) . . . 16
2.3 Data Dimensionality Reduction. . . 21
2.3.1 Principal Component Analysis (PCA) . . . 22
2.3.2 Singular Value Decomposition (SVD) and Percentage Root-mean-square Difference (PRD) . . . 23
2.4 Feature Extraction. . . 25
2.5 Classification . . . 29
3 Graph-based Frameworks for Spatio-Temporal Filtering and Dimensionality Reduc-tion in MI EEG-based BCIs 37 3.1 Introduction To Graph Signal Processing. . . 38
3.2 The GD-BCI Framework . . . 40
3.2.1 Framework Outline . . . 40
3.2.2 Pre-Processing . . . 41
3.2.3 Graph-based Spatio-Temporal Filtering . . . 42
3.2.4 Tangent Space Mapping and Feature Extraction . . . 45
3.2.5 Classification . . . 47
3.2.6 Simulations . . . 47
3.2.7 Conclusion . . . 49
3.3 GDR-BCI: Dimensionality Reduction of EEG Signals via Functional Clustering and Total Variation Measure. . . 50
3.3.1 Framework Outline . . . 50
3.3.2 Defining the Adjacency Matrix. . . 51
3.3.3 Total Variation Graph and Selection of best Clusters: Dimensionality Re-duction . . . 53
3.3.4 Feature Extraction and Classification . . . 54
3.3.5 Simulations . . . 55
3.3.6 Conclusion . . . 56
3.4 Summary . . . 56
4 Practical Solutions to Improve the Performance of EEG-based BCI systems 59 4.1 Progressive Fusion of Multi-rate MI Classification for BCIs. . . 60
4.1.1 Progressive Multi-rate MI Classification Outline . . . 60
4.1.2 Experimental Implementation of the Multi-rate MI Classification. . . 62
4.1.3 Conclusion . . . 66
4.2.1 Trimming Framework Outline and Simulation. . . 68
4.2.2 Conclusion . . . 69
4.3 Summary . . . 70
5 Applications of Hybrid BCIs and WAKE-BPAT Framework for Blood Pressure Esti-mation 72 5.1 Introduction to Hybrid BCIs . . . 72
5.2 WAKE-BPAT: Wavelet-based Adaptive Kalman Filtering for Blood Pressure Esti-mation via Fusion of Pulse Arrival Times . . . 75
5.2.1 Introduction. . . 75
5.2.2 Problem Formulation . . . 78
5.2.3 The Kalman Filter . . . 79
5.2.4 Proposed WAKE-BPAT . . . 83
5.2.5 Simulation and Results . . . 89
5.2.6 Conclusion . . . 91
5.3 Summary . . . 92
6 Summary and Future Research Directions 93 6.1 Summary of Contributions . . . 93
6.2 Future Work . . . 96
List of Figures
Figure 2.1 An example of 10-20 setting of EEG electrodes placement [30]. . . 19
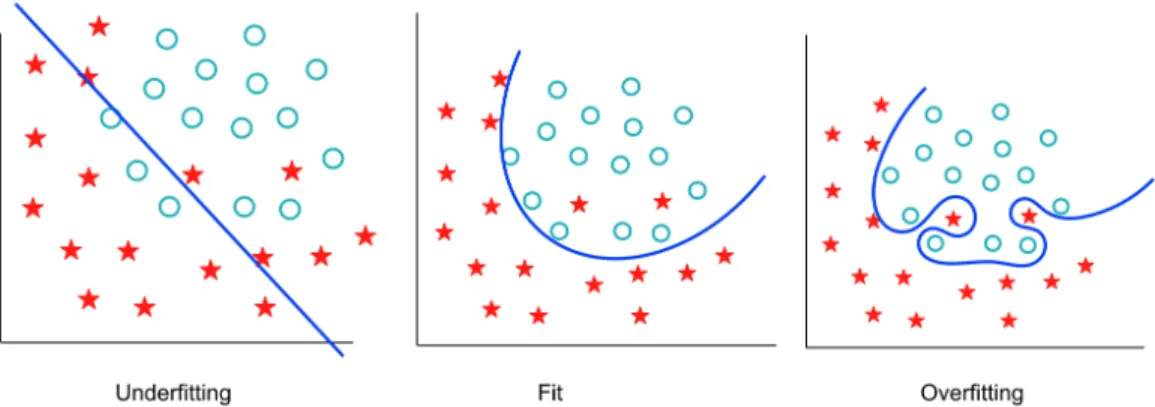
Figure 2.2 The problem of Underfitting and Overfitting. . . 33
Figure 2.3 An example of possible and optimal hyperplanes [50] . . . 36
Figure 3.1 Block diagram of the proposed graph-based spatio-temporal filtering frame-work for brain-computer interface (GD-BCI). . . 40
Figure 3.2 Functional clustering of human brain [60]. . . 51
Figure 3.3 Sparsity pattern of the EEG electrodes (2-dimensional projection). . . 53
Figure 4.1 (a) Emotiv Epoc headset. (b) Electrode placement and activation. . . 61
Figure 4.2 Arduino microcontroller used to turn BCI classifications into external actions like moving motors or controlling LEDs.. . . 62
Figure 4.3 (a) The visual stimulus shown to the subject as ‘Left Hand’. (b) The visual stimulus shown to the subject as ‘Right Hand’. . . 63
Figure 4.4 Scatter plots obtained from two Progressive Filters trained based on 90 and 110 epochs, respectively. . . 65
Figure 4.5 Classification results obtained from implementation of the proposed progres-sive and multi-rate framework based on data collected via Emotiv headset. . . 66
Figure 4.6 (a) The accuracies achieved via adding the trimming step to the conventional CSP algorithm. (b) The accuracies achieved via the conventional CSP algorithm. . 69
Figure 5.1 The main ECG waves within a heartbeat. . . 77
Figure 5.2 (a) Noisy ECG signal. (b) Denoised ECG signal. (c) Noisy PPG signal. (d) Denoised PPG signal. . . 84
Figure 5.3 (a) Denoised ECG. (b)QRS-coefdata. (c) Histogram analysis of theQRS-coef. (d)
Amplitude-band where the population of coefficients is maximum. (e) ModifiedQRS-coef data. (f) Detected
R-peaks. . . 85
Figure 5.4 The DWT-decomposition-tree of the PPG signal. . . 86
Figure 5.5 (a) Filtered PPG. (b) FD-PPG signal where marked samples are the ones within the threshold value. (c) Detected MSP and systolic-peaks. . . 87 Figure 5.6 (a) The PPG-onset detection technique. (b) The Gen-1 Device for PPG recordings developed
recently by Marefat and Mohseniet al.[92]. . . 88
Figure 5.7 Estimated versus the actual BP. (a) Based on [89], i.e., Model 3. (b) Based on the proposed WAKE-BPAT and Model 1. . . 90
List of Tables
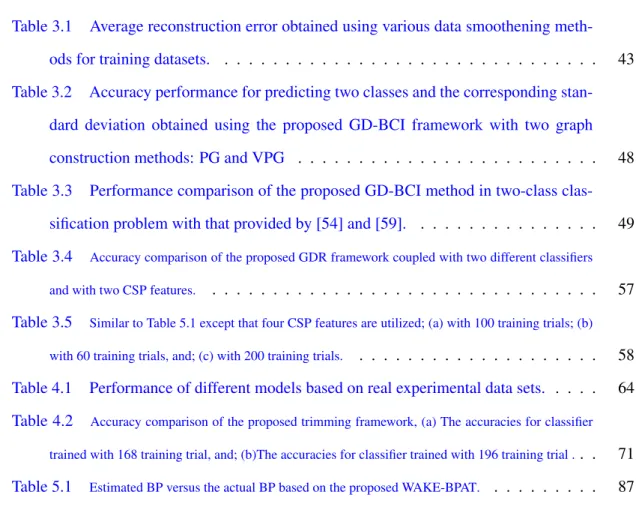
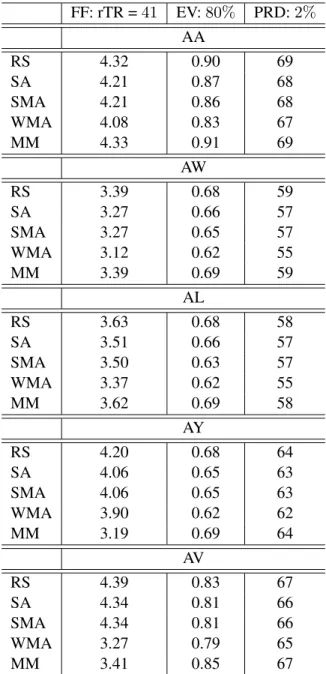
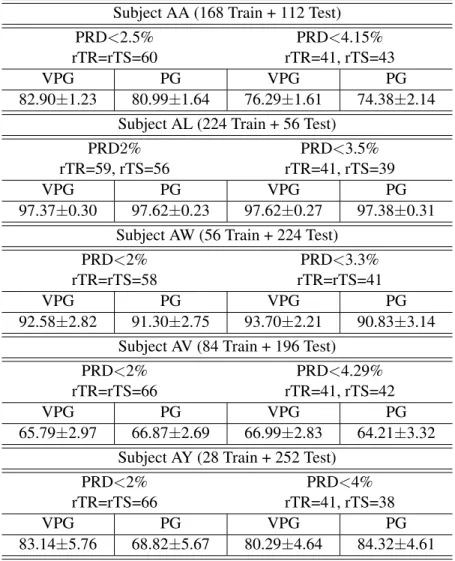
Table 3.1 Average reconstruction error obtained using various data smoothening meth-ods for training datasets. . . 43 Table 3.2 Accuracy performance for predicting two classes and the corresponding
stan-dard deviation obtained using the proposed GD-BCI framework with two graph construction methods: PG and VPG . . . 48 Table 3.3 Performance comparison of the proposed GD-BCI method in two-class
clas-sification problem with that provided by [54] and [59]. . . 49 Table 3.4 Accuracy comparison of the proposed GDR framework coupled with two different classifiers
and with two CSP features. . . 57
Table 3.5 Similar to Table 5.1 except that four CSP features are utilized; (a) with 100 training trials; (b) with 60 training trials, and; (c) with 200 training trials. . . 58
Table 4.1 Performance of different models based on real experimental data sets. . . 64 Table 4.2 Accuracy comparison of the proposed trimming framework, (a) The accuracies for classifier
trained with 168 training trial, and; (b)The accuracies for classifier trained with 196 training trial .. . 71 Table 5.1 Estimated BP versus the actual BP based on the proposed WAKE-BPAT. . . 87
Abbreviation
Abbreviation Description
BCI Brain-Computer Interfaces EEG Electroencephalography SNR Signal to Noise Ratio
fMRT functional Magnetic Resonance Imaging
MEG Magnetoencephalography
ECoG Electrocortiography SCP Slow Cortical Potentials ERP Event Related Potential
SSVEP Steady-State Visual Evoked Potentials ERN Error-related Negative
fNIRS functional Near-Infrared Spectroscopy PET Positron Emission Tomography
MI Motor Imagery
ECG Electrocardiography
PPG Photoplethysmogram
PCA Principal Component Analysis SVD Singular Value Decomposition
PRD Percentage Root-mean-square Difference CSP Common Spatial Patterns
QDA Quatratic Discriminant Analysis SVM Support Vector Machines GSP Graph Signal Processing TVG Total Variation Graph
hBCI Hybrid Brain-Computer Interface
WT Wavelet Transform
KF Kalman Filter
BP Blood Pressure
SBP Systolic Blood Pressure DBP Diastolic Blood Pressure
PAT Pulse Arrival Time
MSP Maximum Slope Point
Chapter 1
Thesis Overview
1.1
Outline
Inside our heads, weighing about 1.5 kg, is an astonishing living organ consisting of billions of tiny cells. It enables us to sense the world around us, to think and to talk. The human brain is the most complex organ of the body, and arguably the most complex thing on earth. Since the original demonstration that electrical activity generated by ensembles of cortical neurons can be employed directly to control a robotic manipulator, research on brain-computer interfaces has experienced impressive growth. Brain-computer interface is a device that translates neural activity of the brain into commands driving a machine. Such a system consists of three major parts:
(1) A device to record the natural activity of the brain. The nature of these recordings can impose certain constraints on the implementation and potential capabilities of the system;
(2) An effector, which is controlled by the neural signals. The effector can be anything from a visual signal to, e.g., complicated robotic or prosthetic system, and;
(3) An algorithm that analyzes and interprets the neural signals as control commands. This algo-rithm links the other two parts together. It determines which features of the recorded neural activity will be employed, and therefore, should be produced by the user, and which control commands can be created from the activity.
Since the latter item is the part which plays the main role in correct interpretation of thoughts-into-commands, the major and fundamental challenges in the field of brain-computer interfaces have been declared and argued for this module. To be more specific and in particular, EEG-based BCI systems often suffer from two main problems: (i) Low spatial resolution, though high temporal reso-lution; and, (ii) Practical approaches through which the final accuracy of users’ intention translation increases for BCI applications. The first propounded problem is more prominent while dealing with large datasets collected via EEG headsets, making attempts to extract the most informative parts of the data and to discard the rest, which calls for competent techniques to reduce the size of collected data (signals) with minimal loss of information. The second issue mentioned requires creative solu-tions to ensure the classifier is not defined too general, and is adaptive and robust enough in respect to each subject’s data.
1.2
Thesis Contributions
Inspired by the stated issues, I have made some contributions [1–6] during my thesis research work as briefly outlined below:
(1) The GD-BCI Framework [1]: This framework is a new graph-based approach, proposed to spatiotemporally filter the data by taking into account both geometrical structure of the EEG channels and the correlation between the EEG signals. The end goal is to identify the pattern of the brain activity using a robust method for pre-processing, processing, and classification of the EEG signals, with the main focus on data dimensionality reduction. The proposed approach seeks for the most significant feature vectors required for better classification of EEG signals, therefore, adaptively selects them through spectral decomposition of the data using the graph Laplacian matrix. Then, the tangent space mapping method is applied to vectorize the dimensionally reduced matrices and map them onto Euclidean space. After that, the linear support vector machine algorithm is employed for classification. Experiments are conducted on Dataset IVa from BCI Competition III, including data from five different subjects consisting of the right hand and right foot motor imagery actions, and the results show that the GD-BCI framework provides higher classification accuracy as compared to its
counterparts.
• Pros and Cons: The GD-BCI framework proposes a graph-based approach which brings about a higher classification accuracy, and configures the graph in a fashion that the impact of active regions of the brain on the signals is taken into account. How-ever, the impressive accuracies come with the price of an exhaustive search for a pair of constants required for adjustment of the graph, which is not preferable in real-world applications of BCI systems.
(2) The GDR-BCI Framework [2]: The GDR-BCI framework, is similar in nature to the GD-BCI, and it capitalizes on the fact that functionality of different connectivity neighbor-hoods varies based on the intensity of the performed activity and concentration level of the subject. Initial functional clustering of EEG electrodes is built by designing a separate adja-cency matrix for each identified functional cluster. A collapsing methodology is developed based on total variation measures on graphs, i.e., the overall model will eventually be reduced (collapsed) into two functional clusters. The experimental results based on the same Dataset IVa from BCI Competition III show that the proposed method can provide higher classifica-tion accuracy as compared to its counterparts
• Pros and Cons: The proposed framework offers two main superiorities over its state-of-the-art counterparts and the GD-BCI: (i) First, the resulting dimensionality reduction is subject-adaptive and respects the brain plasticity of subjects, and; (ii) Second, the proposed methodology identifies active regions of the brain during the motor imagery task, which can be used to re-align EEG electrodes to improve accuracy during consec-utive data collection sessions. The only drawback this framework is the longer time of processing as compared to its counterparts, as it includes the total variation graph loop that evaluates each cluster.
(3) The Progressive Fusion of Multi-rate MI Classification for BCIs [3]: This framework ad-dresses the issues arose in the case of limited number of training trials at hand. This approach consists of two filters running in parallel namely: (i)The Progressive Filter: An efficient filter
that performs both feature extraction and classification steps based on the set ofall arriving epochs to re-train progressively over time. (ii) The Active Filter: A simplified CSP-based feature extraction approach running online based on pre-trained classifiers, i.e., a lighter ver-sion of the Progressive Filter that runs faster than its counterpart. The proposed framework is evaluated both based on dataset IVa from the BCI competition III, and through real data collected via the Emotiv Epoc headset.
• Pros and Cons: The proposed framework is a great solution for practical BCI appli-cations, especially those that function in a real-time manner. However, depending on the capabilities of the implemented BCI system, this approach might be consuming relatively more energy/memory space, which would not be optimal with respect to its application.
(4) Improving the Accuracy of MI EEG-based BCIs Through Trimming the Epochs [4]: This method is proposed to readjust the recorded epochs in a manner that most informative parts of the signals are extracted and the segments of the epochs which do not include the response of the subjects to the stimuli would be discarded. This approach is robust to the different natures of the recorded datasets, and readjusts the data in a way that the most infor-mative time interval within each epoch would be processed and further on, classified.
• Pros and Cons: The implementation of the proposed method on the dataset IVa from the BCI competition III shows great potential for this approach, moreover, the processing time that this technique adds to an original code is very small. However, for the approach to be more robust regarding the final trimmed interval, it is important to take into account additional methods to ensure the classifier is of low bias and low variance at the same time, which might lead to an increase in the processing time.
(5) The WAKE-BPAT Framework [5]: The motivation behind this work was the recent urgency to design continuous and cuff-less blood pressure (BP) monitoring solutions, not only for the purpose of hybrid BCIs, but more importantly to prevent, detect, and treat hypertension. The WAKE-BPAT framework is a novel wavelet-based feature extraction algorithm coupled with
an adaptive and multiple-model Kalman filtering. This framework provides accurate and dynamic BP estimates by extraction and fusion of different pulse arrival time (PAT) features. Experimental evaluations of WAKE-BPAT based on a real dataset collected via Gen-1 device confirms the superiority of the proposed framework in comparison to its counterparts.
• Pros and Cons: The proposed approach exhibits great potential, the processing steps provide a solid robust framework to estimate the blood pressure through simultaneous ECG and PPG signals. However, the BP estimation methods have not been excessively tested as a module of hybrid BCI system and therefore, the effectiveness of such a system is to be investigated furthermore.
1.3
Organization of the Thesis
To provide the relevant context, the rest of the thesis is organized as follows:
• Chapter 1 provides an overview and a summary of important contributions made in the thesis.
• Chapter 2 presents a comprehensive background and literature review on bracomputer in-terfaces and their applications, as well as their modules and the corresponding processing methods.
• Chapter 3 considers the problem of dimensionality reduction. Different graph-based
dimen-sionality reduction methods are proposed, introducing the GD-BCI and GD-BCI frameworks.
• Chapter 4 introduces two practical solutions to increase the accuracy of classification of BCI
systems.
• In Chapter 5, a background is provided on hybrid BCI systems, and a cuffless blood pressure estimation framework, called the WAKE-BPAT, is proposed.
Chapter 2
Background and Literature Review on
Brain Computer Interfacing
2.1
Brain Computer Interfaces: Why and How?
How do people with severe motor disabilities and/or speech problems manage to perform the activities of their daily lives? You may have seen someone using a set of push buttons on a computer or tablet that speaks for him/her, or those who use specialized physical devices, such as a wheelchair or a robotic arm, to help them move around and do accomplish the tasks of their day. These devices are known as Augmentative and Alternative Communication technologies (AAC), aiding those who suffer from motor disabilities or severe speech problems to improve their quality of daily life, pos-sibly without requiring a caregiver. Despite the success and public acceptance of the conventional AAC, there have been people with certain need and requirements, due to their severe condition, who are not able to take advantage of these means of communication. For instance, those who are totally paralyzed, or “locked-in”, are restricted from both verbal and non-verbal communication, even though they are conscious and alert [7]. The inability of communicating, neither emotions and thoughts nor physical needs of one, calls for a technology capable of a deeper level of communica-tion and of reaching out to the thoughts of the impaired users [8]. This is essentially the origin of the recent upsurge in the field of Brain-Computer Interfaces (BCIs).
2.1.1 Introduction to the BCIs
The BCI systems, while requiring no peripheral muscular activity, enable a user to use solely his/her brain activities to send commands to an electrical device. BCI can be considered as a system for which the input is the brain activity and the output is a set of device control signals, therefore, the BCI system itself functions as a translator, measuring specific features of the brain signals. Jacques Vidal [9] was the first researcher who proposed the term “brain-computer interface” in 1973, when he presented a system that could interpret brain signals into computer control signals. BCI tech-nology initially used to be unattractive for serious scientific investigation due to false assumptions about its applications. The general public, as well as academia, often used to reject the idea of successfully deciphering thoughts or intentions by means of brain activity in the past, as strange and remote. Hence, investigation in the field of brain activity has usually been limited to the analysis of neurological disorders in a clinical setting or the exploration of brain functions in laboratories. In contrary, during the past two decades, experimental research into BCIs has expanded significantly, with promising results presented for healthy people and few successful and practical controlled clinical outcome studies for patients. BCIs are starting to prove their efficacy as assistive and reha-bilitative technologies in patients who suffer from severe motor impairments. Moreover, recently, several fruitful developments and expansions of its market for both healthy and unhealthy people have emerged. This sparked progress is driven by the advancements in terms of effectiveness and increase in the number of available technologies to record and process brain signals.
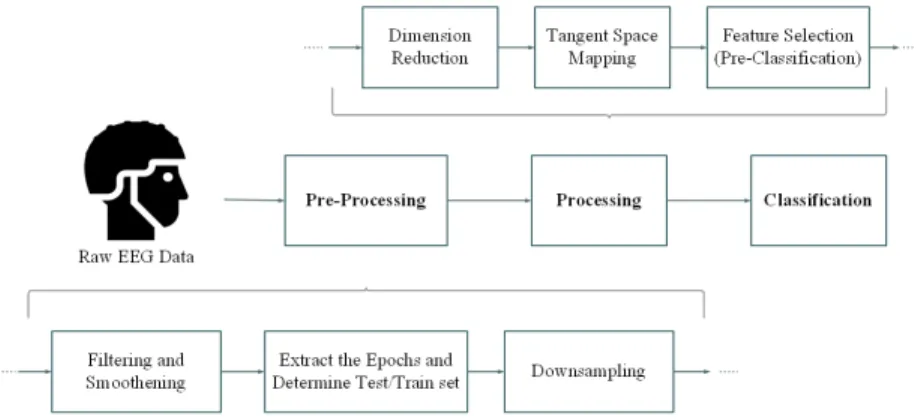
The BCI systems generally share the same principles, i.e. the detected brain signals are ampli-fied and recorded, then filtered, smoothed, and classiampli-fied according to relevant characteristics (e.g., sensorimotor rhythms over the motor cortex). After processing and decoding of the brain signals, the output of the BCI can be used to control the movement of a prosthesis, orthosis, wheelchair, robot or cursor, or to direct electrical stimulation of muscles [10]. Prior to naming the potential/active practical areas of the BCI technology, it is of great importance to clarify the difference between a tool, in this case a BCI, and an application. A tool in the present context is a device which is spec-ified by the manner in which it performs its function, and applies to a wide variety of applications. Its effectiveness and ease of use evaluates a tool’s performance, and its function remains the same,
regardless of the purpose it is serving. On the other hand, an application is primarily described by the purpose it serves, and its evaluation focuses on how well it fulfills serving the target purpose, while it may also be described regarding the tool it employs.
Having the above definitions in mind, it can be said that BCIs are tools that record and analyze brain activities, such as, Electroencephalography (EEG) signals, which will be discussed later in details in Subsection2.2. Moving a cursor, selection among two or more possible choices shown to the subject of the study, or controlling a robot, are some examples of BCIs employed as suitable and responsive tools to use. BCI applications are widely spread in various fields of research and medical industry. Generally speaking, BCI applications can be classified into the following six main categories:
(1)Medical; (2)Games and Entertainment;
(3)Educational and Self-Regulation; (4)Neuroergonomics and Smart Environment; (5)Neuromarketing and Advertising, and; (6)Security and Authentication.
These applications are mostly in experimental research state and not all of them have been well-established to be operable by general public. While working on either of these areas, the primary concern of BCI developers must be the needs and priorities of the anticipated user, and researchers must guard against the tendency to approach the parameters of the tools and their applications as an abstract design exercise. BCI development requires an optimized design with well-defined objectives, which should be based on not only a complete technical study, but also a thorough and comprehensive behavioral analysis that essentially addresses the needs, desires, and incentives of the users and their possible caregivers. Satisfying these conditions requires collaborative interactions with the users, who must know how to use the technology and be persuaded that the technology is both useful and safe. Also, essential is the cooperation of the relevant health care professionals, who must be persuaded that the risk/benefit ratio is favorable, that the technology is safe and useful, and that it is equal or superior to available alternatives.
In regards to the acquisition of brain activity and the modalities to do so, BCIs can be classified into the following two main categories:
• Invasive BCIs
Invasive BCIs are those that involve surgical implantation of electrodes, or multi-electrode grids in the brain. These systems are intended to measure patterns of neurons’ activities in or-der to enable the researchers to decode behaviourally relevant information from the acquired data. The reason for such a risky and expensive intervention is to gain high signal-to-noise ratio (SNR) electrical responses, recorded directly from the brain. This is in contrast to the signals recorded from over the scalp, which is usually contaminated by the high amount of noise, and these recordings are of low amplitude due to the nature of human scalp, result-ing in low SNR. However, there is not enough evidence to justify this brutal operation, and moreover, extensive work on brain plasticity [11] has shown that a plastic change in the adult nervous system through learning is possible, if the respective neuronal circuit participates functionally in the physiological tasks of that circuit. This implies that even if the advantages of invasive BCI would overweigh its disadvantages, since the function map of the brain is subject to change in response to the learning processes the person is exposed to, this approach will not remain favorable in the long run.
In regards to implementation of Invasive BCIs, there are a few, yet of utmost importance concerns that must be addressed prior to any practical experiment.
(1) Possible locations of implanted electrodes, number of electrodes to implant, and the nature of the signals to record: In most BCI applications and the majority of the cases in which BCI is used as a tool, the motor cortex of the brain is an obvious choice for recording the signals; reasons being direct relevance to motory tasks and the relatively better accessibility compared to other motor areas of the brain. In order to determine and identify the appropriate locations for implantation, functional Magnetic Resonance Imaging (fMRI), Magnetoencephalography (MEG), and other functional imaging tech-niques are admittedly helpful [24]. Moreover, the number of electrodes to implant has a direct relation with the location of the electrodes, the minimum SNR required for the study, and the functional use of the signals, i.e., the purpose of the study/application and the rate of information transfer to fulfill the specifications of the procedure.
(2) User groups who might be best suited for implanted electrodes and the stability of the recordings: Due to the severity operation required, it makes perfect sense to only pro-ceed with invasive BCIs for patients with extreme conditions and needs. Patients who are locked-in might benefit from invasive BCI technology if it is relatively safe and ef-fective. Selected individuals with stroke, spinal cord injury, limb prostheses and other conditions might Also benefit. It is of utmost importance to keep in mind that the in-dividuals’ preferences play a key role in specifications and decisions about implantable systems, in other words, a substantial functional advantage over the conventional non-invasive systems must be proved to justify the implantation of the non-invasive electrodes. Extensive researches on non-human subjects [12] has shown that stable recording has been maintained over months, and in selected instances over the years. Positive results regarding human subjects have also been observed sparsely in different research groups around the world, however, this field is still in its infancy, requiring more research and proven reliable outcomes. Also, prior to any implantation, tissue acceptance of the mi-croelectrode has to be ensured.
(3) The ethical issues that must be considered in implanting recording electrodes in human volunteers: It is perfectly clear that the patients must be informed of the risks and po-tential dangers of the operation. Also, all the popo-tential benefits of the system need to be clearly and forcefully explained to the volunteers, especially because volunteers with severe conditions tend to overestimate the benefits of the BCI, and they must be aware of exact aid and service they will be provided with. An ethicist should be involved in the earliest phases of any human research developing or testing invasive BCI methods.
Invasive BCIs are not the focus of this thesis, however, it is worth naming the following five main types of brain activity that can be measured with invasive BCIs: (i) Local field poten-tials (LFPs) [13]; (ii) Single-unit activity (SUA) [14]; (iii) Multi-unit activity (MUA) [15]; (iv) Electrocorticographic oscillations recorded from electrodes on the cortical surface (elec-trocorticography, ECoG) [16]; and, (v) Calcium channel permeability [17].
Noninvasive BCIs are implemented without any sort of surgical implantation, as they enable recording the brain signals from the external surface of the scalp. These systems are the most widely researched BCIs due to their minimal risk and the relative convenience of conducting studies and recruiting volunteers to participate in the study. Noninvasive interfaces are able to detect seven types of brain signals.
(1) Slow cortical potentials
Slow cortical potentials (SCPs) are shifts in the cortical electrical activity lasting from several hundred milliseconds to several seconds. These shifts might be initiated and trig-gered by an external event, or induced by self. Their moderating impact on information processing has been demonstrated in numerous studies, such as in [18].
(2) P300 Event Related Potential:
The P300 (P3) wave is an Event-Related Potential (ERP) component elicited in the process of decision making. These waves’ occurrence does not link to the physical attributes of a stimulus, but to a person’s reaction to it. In other words, the P300 is known to reflect processes involved in stimulus evaluation or categorization. When recorded by EEG, it surfaces as a positive deflection in voltage with a latency (delay between stimulus and response) of roughly 250 to 500 ms.
(3) Steady-State Visual Evoked Potentials:
The Steady-State Visual Evoked Potentials (SSVEPs) are natural responses of the brain to visual stimulation at specific frequencies. The brain starts generating electrical signals at the frequencies ranging from 3.5 Hz to 75 Hz, or multiples of them, when the retina is excited by a visual stimulus at the same frequencies. SSVEPs are useful in research because of the excellent signal-to-noise ratio and relative immunity to artifacts [19]. (4) Error-related Negative Evoked Potentials:
The Error-related Negative (ERN) is a sharp negative going signal which begins about the same time an incorrect motor response begins, (response-locked event-related po-tential), and typically peaks from 80-150 milliseconds (ms) after the erroneous response begins (or 40-80 ms after the onset of electromyographic activity). The ERN is observed
after errors are committed during various choice tasks, even when the participant is not explicitly aware of making the error.
(5) Blood-oxygen-level Dependent Contrast Imaging:
The firing of neurons causes a need for more energy to be provided quickly. Through a process called the hemodynamic response, blood releases oxygen to the active neurons at a greater rate than to inactive ones. This causes a change of the relative levels of oxyhemoglobin and deoxyhemoglobin (oxygenated or deoxygenated blood) that can be detected by their magnetic properties. This event can be measured by fMRI method. (6) Cerebral Oxygenation Changes:
The Near-Infrared Spectroscopy (NIRS), as a methodology for functional neuroimaging, is based on the fact that unlike visible light, near-infrared light (wavelength from 700 to 1000 nm) easily passes through biological tissues and is mainly absorbed by few chro-mophores like hemoglobin with different absorption spectra for their oxygenationdeoxy-genation states. The activation of brain regions causes an increased oxygen metabolic rate and to initial deoxygenation of the tissue which is followed by increased regional cerebral blood flow (rCBF). These metabolic changes enable researchers to study emo-tional and cognitive tasks of the brain via measurements of funcemo-tional NIRS [20]. (7) Sensorimotor rhythms
A Sensorimotor Rhythm (SMR) is a brain wave, the oscillatory idle rhythm of syn-chronized electric brain activity. These brain waves appear in the recordings over the sensorimotor cortex via modalities such as EEG. For most individuals, the frequency of the SMR is in the range of 13 to 15 Hz, in cortical regions outside of the motor strip. These frequencies relate to relaxed attention such as reading or engaging in a relaxing hobby such as knitting.
Out of all the types above of noninvasive BCI signals, the focus of this thesis is on Sen-sorimotor Rhythms. Such BCIs have been used with relatively satisfactory success, for in-stance, Wolpaw and McFarland published the results of their study in 2004 [23], in which they showed that patients with locked-in syndrome or high spinal cord lesions were able to
use sensorimotor rhythms to control cursor movements or select letters or words from a com-puter menu. EEG-based BCIs with the focus on sensorimotor rhythms will be fully discussed throughout the remainder of the thesis. This completes an outline of invasive and noninvasive BCIs.
As previously stated, BCIs fall into the category of communication and control systems and there-fore, a BCI has an input, an output, and a translation algorithm that converts the former to the latter. BCI input consists of a particular feature (or features) of brain activities and the methodology used to measure that features. BCIs may focus on frequency-domain features (Spectral), time-domain features (Temporal), or the features measured in respect to the location of the events taken place on the scalp (Spatial). These features will be fully described and discussed later in Section2.4. Each BCI uses a particular algorithm to translate its input into output control signals. Due to the high number of available techniques, the translation algorithm might include linear or nonlinear models, or neural network, to name a few, or a hybrid combination of them. In many cases, BCIs incorporate continual adaptation of important parameters to key aspects of the input provided by the user in order to improve the accuracy of capturing the intention and its translation corresponding to the cognitive learning curve the user takes while using the BCI system. BCI outputs can be cursor movements, letter or icon selection, controlling a robot arm, or another form of device control, and provide the feedback that the user and the BCI can use to adapt to optimize communication.
In addition to the three main components of a BCI, as a system, it has other distinctive charac-teristics as well, which may be the reference of BCI’s evaluation, or comparison to its peer systems. These include a BCI’s response time, speed and accuracy, the information transfer rate, type and extent of user training required (which can be very crucial in terms of the target population of the intended BCI application), appropriate user population, and required feedback technique by which the user would remain motionless and well-understood by the system.
The focus of this thesis, although studying and practically experimenting input and output of a BCI (Chapter 4), is mostly on the translation algorithms of a BCI. A BCI translation algorithm is essentially a series of computations, arranged and formed in a fashion to most optimally turn BCI system input features derived by the signal processing stage into actual device control com-mands [24]. The diversity in translation algorithms is due in part to diversity in BCIs intended
real-world applications. Nevertheless, in all cases the goal is to maximize performance and practi-cability for the chosen application.
2.2
Electroencephalography (EEG)
The BCI systems, as the translators of the brain activities, evidently require at least one modality to detect the user’s intention. Either flavors of these activities, spontaneous in the absence of exter-nal stimuli, or evoked brain activity, as specific patterns elicited in the presence of exterexter-nal stimuli, can be captured by either “electrophysiological” or “hemodynamic”-based modalities. When infor-mation is exchanged between the electrochemical transmitters of the neurons, a set of electrophys-iological activities is generated. The neurons generate ionic currents which flow within and across neuronal assemblies. This flow, once large enough, causes electrical and magnetic fields, which can be measured by means of Electroencephalography (EEG), Electrocorticography (ECoG), and Magnetoencephalography (MEG). On the other hand, the hemodynamic response, is a process in which the blood releases glucose to active neurons at a greater rate than in an area of inactivity. This chemical change in the blood can be monitored by neuroimaging methods such as functional Magnetic Resonance Imaging (fMRI), functional Near Infrared Spectroscopy (fNIRS), and Positron Emission Tomography (PET) [25].
Hans Berger, a German psychiatrist, was the first to systematically study the electrical activities of the human brain and to invent EEG [26]. His invention brought about a revolution and to date, a considerable number of research results related to EEG-based BCIs have been reported in various international journals, covering biomedical engineering, clinical neurology, neuroscience, and neu-rorehabilitation, using EEG headsets. The reason for this popularity is that EEG, although owning a few yet significant drawbacks, outweighs other modalities due to its minimal risk and the relative convenience of conducting studies, as well as other technical distinct advantages, which will be discussed further in this section.
EEG as a medical tool has become a routine clinical practice to distinguish epileptic seizures from other types of spells, such as psychogenic non-epileptic seizures, syncope (fainting), sub-cortical movement disorders, and migraine variants, to differentiate “organic” encephalopathy or
delirium from primary psychiatric syndromes such as catatonia, to serve as an adjunct test of brain death, to prognosticate, in certain instances, in patients with coma, and to determine whether to wean anti-epileptic medications. However, EEG has been even more trending in research-related practices, especially and extensively in neuroscience, cognitive science, cognitive psychology, neu-rolinguistics, and psychophysiological research. The reason behind this trending interest, despite the relatively poor spatial sensitivity of EEG, is the several advantages it possesses over other its counterparts, as briefly outlined below.
EEG hardware is significantly and considerably more affordable by comparison with most other techniques. Also, immobility of modalities such as fMRI, PET, or MEG, limit the flexibility of ex-periment design and require a more complex, therefore costly, arrangements and setting at the data collection venue, while EEG sensors can be placed anywhere on the scalp not requiring any specific ambient conditions to work at. Moreover, EEG recordings hold a very high temporal resolution, on the order of milliseconds rather than seconds, thus, for clinical and research settings, EEG is commonly recorded at sampling rates above 250 Hz and up to 2000 Hz. Nowadays, modern EEG data collection systems are capable of recording at sampling rates above 20,000 Hz if desired. EEG, being absolutely silent while recording, enables researchers to not only study the responses to audi-tory stimuli, but also to investigate and track the brain changes during different phases of life, e.g., EEG sleep analysis can indicate significant aspects of the timing of brain development, including evaluation of adolescent brain maturation. Additionally, EEG, as a powerful tool to detect covert processing (i.e., processing that does not require a response), is non-invasive and can be used in sub-jects who are incapable of making a motor response. In contrast to all the useful advantages, EEG also possesses disadvantages that researchers must take into account before adopting this technique of recording as the tool by which they aim to answer the question of their study. The first drawback of EEG recordings is a poor spatial resolution on the scalp as compared to techniques such as fMRI, and in order to compensate for this downside, intense interpretation is required just to hypothesize what areas are activated by a particular response. The quality of EEG signals is affected by scalp, skull, and many other layers as well as background noise. Noise is key to EEG, insofar as it reduces the SNR and therefore the ability to extract meaningful information from the recorded signals.
BCI developments, especially since changes in cortical electrical activity resulting from mental stimulation occur faster than the accompanying changes in hemodynamics. Many studies, namely, [27] and [28], have reported successful utilization of EEG-based BCIs, particularly enabling able-bodied users to generate fast and reliable control signals. In the interesting work of Moghimiet al.[29], 39 studies reporting EEG-oriented BCI assessment by individuals with disabilities were identified in the past decade and investigated, which shows EEG has been the most commonly and widely used modality in BCIs.
In the interest of standardizing the placement of EEG electrodes, an internationally recognized method is established, known as “10–20 system”. The system is based on the relationship between the location of an electrode and the underlying area of cerebral cortex. The distances between adjacent electrodes are either 10% or 20% of the total front-back or right-left distance of the skull; that is the reason behind the name of this system. Each site has a letter to identify the lobe, and a number to identify the hemisphere location. “F” stands for frontal, “T” for temporal, “C” for central, “P” for parietal, and “O” for occipital. Even numbers refer to the electrodes placed on the right hemisphere, and the odd numbers are allocated to the electrodes located on the left hemisphere. To measure the distances and segmenting them, four anatomical landmarks are used: first, the nasion which is the point between the forehead and the nose; second, the inion which is the lowest point of the skull from the back of the head and is generally indicated by a prominent bump; the preauricular points are anterior to the ears. Considering these main instructions, an example of a 10-20 system EEG electrode placement is elucidated in Figure2.1.
To understand the studies employing EEG as a tool for recording brain signals, it is considerably important to be familiar with the EEG rhythmic activities and patterns. These activities are divided into frequency bands. These designations arose because rhythmic activity within a certain frequency range was noted to have a certain distribution over the scalp or a certain biological significance. The first frequency band commonly is considered to begin from 1 Hz and the last one is capped by 40 Hz, whereas activity below or above this range is likely to be artifactual. The following categories, provide an overview of the location and range of various meaningful and distinguishable brain signal patterns for data analysis.
Figure 2.1:An example of 10-20 setting of EEG electrodes placement [30].
• Delta Patterns
These patterns are ranged between 1–4 Hz with highest amplitudes and slowest waves. These signals are usually captured from frontal (in adults) and posterior (in children) part of the scalp. Delta waves are known as slow-wave sleep in adults and also are commonly observed in babies.
• Theta Patterns
These patterns are ranged between 4 – 7 Hz. Theta signals are mostly found at the locations of the scalp that are not related to the task at hand, therefore, they are normally considered as “idling” waveforms. This category of signals has also been found to spike in situations where a person is actively trying to repress a response or action. Moreover, this range has been associated with reports of relaxed, meditative, and creative states.
• Alpha Patterns
These patterns are ranged between 7–13 Hz. These signals are often generated at the posterior regions of the head (both sides) and are higher in amplitude on the dominant side. That is the reason why Hans Berger named this EEG activity as the “Alpha Wave” or the “posterior basic rhythm”. This category is famously known as resting/relaxing state, due to its generation while the eyes are closed. It is interesting to know that one of the ways for EEG researchers and engineers to test their application, is to ask the subjects to close their eyes and relax;
the frequency content observed during this time has to be mostly focused at Alpha rhythms. In addition to the basic posterior rhythm, there are other normal alpha rhythms such as the mu rhythm (alpha activity in the contralateral sensory and motor cortical areas) that emerges when the hands and arms are idle.
• Beta Patterns
These patterns are ranged between 14 – 30 Hz, and although being of high interest for cap-turing as a response to stimuli, this category is of low amplitude, multiple and varying fre-quencies are often associated with active, busy or anxious thinking and active concentration. Low amplitude of Beta pattern makes it notably susceptible to contamination by artifacts and noise. The location of signal generation on the scalp is at both sides, symmetrically dis-tributed, and most evidently towards the frontal side of the head. These waves are generated while the subject is actively calm and is focused and highly alert, thinking, especially, it is the dominant rhythm in patients who are alert or anxious or who have their eyes open, namely, the locked-in patients.
• Gamma Patterns
These patterns are seen at frequencies between 30–100 and are generated at the Somatosory cortex of the brain. This category of waveforms is displayed during cross-modal sen-sory processing (a perception that combines two different senses, such as sound and sight). Gamma patterns are thought to represent binding of different populations of neurons together into a network for the purpose of carrying out a certain cognitive or motor function. Also Gamma is appeared during short-term memory matching of recognized objects, sounds, or tactile sensations.
• Mu Patterns
These patterns are ranged between 8–13 Hz and partly overlapped with other frequencies. They are generated at the Sensorimotor cortex of the brain, and represent rest-state motor neurons.
when they are not engaged in processing sensory input or producing motor output. Computer-based analyses reveal that idling waves are distinguished from each other by location, frequency, and/or relationship to concurrent sensory input or motor output. These idling patterns are usually associated with 18-26 Hz (range of Beta) rhythms. While some Beta patterns are harmonics of Mu patterns, some are separable from them by topography and/or timing, and thus are independent brain signal features [22]. Beta and Mu waves are associated with those cortical areas most directly connected to the brains normal motor output channels, therefore, are leader choices for EEG-based BCIs which enable the subject to command movements to the BCI, without any peripheral muscle movement.
As the last not least concept outlined before closing the discussion on EEG, it is important to introduce the mental process, Motor Imagery (MI). MI is one of the most popular and widely used techniques for the BCI systems to be efficient, as they are supposed to be highly accurate and capable of well-interpretation by the quickest pace possible, regardless of the limitations of the end-user. The MI is defined as mere imagination of a limb movement, with no actual movement or peripheral (muscle) activation [31]. This mental execution of a movement is known to induce brain activity in the same way performing an actual movement brings about the firing of neurons in the brain [32]. According to this view, the main difference between performance and imagery is that in the latter case execution would be blocked at some corticospinal level [33]. The variation in brain activity is quantified from an Electrophysiological recording by EEG during the MI task. In MI-based BCIs, patients often receive visual or kinesthetic feedback in order to promote the brain response to the MI task. Increasing the accuracy of BCIs using this mental process is the focus of my thesis throughout the next chapter.
This completes a brief discussion on BCIs, EEG, and essential knowledge for understanding the applications of these two. Next, I will discuss the techniques and methods employed to process data for an EEG-based BCI system.
2.3
Data Dimensionality Reduction
Through the recent advances in statistics, signal processing, machine learning, and information theory, the size and the number of random variables, storing information regarding an ongoing study,
are experiencing significant growth. As a first step to proceed on the data understanding, researchers and engineers are often confronted with the problem of a proper and/or optimal selection of infor-mation among numerous patterns in a set of data. The superficial dimensionality of data, or the number of individual observations constituting one measurement vector, is often much greater than the intrinsic dimensionality, the number of independent variables underlying the significant non-random variations in the observations [34]. Therefore, to conclude the features and/or the attributes of a set of data, the first step required is to reduce the dimensionality of the data. Dimensionality reduction is defined as the process of reducing the number of random variables under consideration by obtaining a set of key variables. Dimensionality reduction not only allows us to shift the focus of processing on the more informative variables, but also results in, generally noticeably, speeding up the processing and classification phase.
In comparison with other sorts of biomedical signals, EEG is considered to be excessively com-plicated for an untrained observer to understand. Raw EEG signals are also extremely burden-some to be directly processed, mostly, as a consequence of the high temporal resolution of EEG technique and the spatial mapping of functions onto different regions of the brain and electrode placement. Hence, prior to applying other processing methods to extract features and classify the recorded data, dimensionality reduction is commonly used to determine a reduced feature set, in-cluding only (more or less) the data needed for further quantifications, in respect to a negligible loss of information during this process.
Principal Component Analysis (PCA) [35] and Singular-Value Decomposition (SVD) [36] are known to be well-established methods for the purpose of dimensionality reduction. Percent Root-mean-square Difference (PRD) [37] is also a method based on SVD which has been well-regarded in Electrocardiography (ECG) processing and applies to EEG signals. This subsection serves to provide an overview of the techniques above.
2.3.1 Principal Component Analysis (PCA)
The PCA is one of the most traditionally used techniques in EEG signal processing and BCI module design [25]. This technique is a leader choice method both for dimensionality reduction and feature extraction among its similar techniques in many fields of computer science as well. In
the PCA, we seek to represent a givenn-dimensional data in a lower-dimensional space. This will reduce the degrees of freedom; reduce the space and time complexities. The objective is to represent data in a space that best expresses the variation in a sum-squared error sense. The PCA functions significantly better if an estimation of the number of independent components is known apriori.
The basic approach in principal components is theoretically rather simple. First, then-dimensional mean vectorµandn×ncovariance matrixΣare computed for the full data set. Next, the
eigen-vectors and eigenvalues are computed, and as the eigenvalues{λ1 ≥λ2 ≥...≥λn}are sorted in
a descending order, so are the eigenvectors{e1,e2, ...,en}accordingly. Subsequently, a subset of
eigenvectors associated with the largest eigenvalues is chosen. In practice, this is done by looking at the spectrum of eigenvectors. Often there is a clear distribution within the spectrum, implying an inherent dimensionality of the subspace governing the signal. The other dimensions are noise. Form a (m×m) matrixAwhose columns consist of themeigenvectors. Preprocessing of the data is performed as follows
ˆ
X =AT ×(X −X¯), (1)
where superscriptT denotes transpose operator andX¯ is the matrix of PCA essentially rotates the set of points around their mean in order to align with the principal components. This moves as much of the variance as possible (using an orthogonal transformation) into the first few dimensions. The values in the remaining dimensions, therefore, tend to be small and may be dropped with minimal loss of information. The PCA has the distinction of being the optimal orthogonal transformation for keeping the subspace that has the largest variance.
2.3.2 Singular Value Decomposition (SVD) and Percentage Root-mean-square Dif-ference (PRD)
Several (if not all) data dimensionality reduction techniques are based on the decomposition of a key matrix, into its eigenvectors and eigenvalues. The reason behind this approach is the fact that through a canonical representation, there can be information retrieved that are just not obvious to a researcher by a glance at the original matrix, information such as: the underlying probability distribution of the matrix; similarities of random variables; the dependencies of random variables
onto each other; and, many other useful key information [38]. In linear algebra, the SVD is a factorization of a real or complex matrix. SVD is proposed as the generalization of the conventional eigendecomposition of a positive semidefinite normal matrix (e.g., a symmetric matrix with positive eigenvalues) to any (m×n) matrix via an extension of the polar decomposition. It has several useful applications in signal processing and statistics, namely, computing the pseudoinverse, least squares fitting of data, multivariable control, matrix approximation, and determining the rank, range and null space of a matrix. However, in biomedical engineering, this approach can be the first step taken towards dimension reduction of the data at hand. To outline the method, supposeX is an (m×n) matrix which contains real or complex numbers. Then, there exists a factorization, called a singular value decomposition ofX, of the form
X=UΣVH, (2)
where
• U is an (m×m) unitary matrix;
• Σis a diagonal (m×n) matrix with non-negative real numbers on the diagonal;
• V is an (n×n) unitary matrix andVH is the Hermitian (conjugate) transpose ofV.
Throughout the development of this thesis, I have been employing the SVD technique along with a well-regarded yet straightforward measure, PRD, to evaluate the optimality of the dimensionality reduction step. PRD is widely known for its noteworthy application for Electrocardiography (ECG) signal processing techniques, for instance in [39] and [40]. While illustrating notable results in ECG, during my thesis research work, PRD turned to be practically applicable for EEG signal processing, once applied alongside the dimensionality reduction step. PRD can be considered as a quality control measure, to address the main concern of the dimensionality reduction techniques, which is the preserving the target parts of the signals while removing the redundant and irrelevant information. PRD ensures that the signals matrices are reduced in size up to a certain amount of information loss. For instance, suppose we have an estimation of irrelevant data contained within the recorded signals, which is aboutp%of the entire data. PRD, utilizing SVD, decomposes the signals
Algorithm 1 SVD–PRD DIMENSIONALITYREDUCTION
Input: {Original EEG (OEEG) signals X (Channels as the variables each containing same length of time series signals) and the Percentage of acceptable errorp%.
Output: {Minimum number of variables (channels) required to maintain the signals’ quality in respect to the aforementioned error percentage.
1: Decompose OEEG by SVD:[U,S,V]= svd(X). Number of columns taken into account (k) inU andV is set to 1.
2: Reconstruction Loop:
• First k diagonal element(s) of S and first k column(s) from U and V are chosen to reconstruct the EEG Signal asXˆ (REEG), as per Equation2.
•The PRD is computed as follows
P RD=
v u u
tPi,j(Xi,j −Xˆi,j)2
P i,j(Xi,j)2 ×100. (3) •Evaluation If: P RD6p% break; else: k=k+ 1;
3: Number of Variables Required: Finalkwill be the output of the function as the minimum number of variables (channels) required for a more accurate dimension reduction.
and begins reconstructing them variable by variable. Every time data of each variable is added, the reconstructed signals are evaluated and compared to the original one, and the error of compatibility is computed. The algorithm keeps adding variables until the error is qual or less thanp%. In order
to clarify the way PRD functions as described, the Algorithm2.3.2, presents the pseudocode of the PRD approach in details.
2.4
Feature Extraction
As discussed previously, different thinking activities result in different patterns of brain signals and these mental tasks are of utmost importance while designing an experiment or an application for BCIs. From this outlook, BCI is seen as a pattern recognition system that classifies each pattern into a class according to its features. To elucidate this matter more clearly, it is important to define a “feature”. During a phenomenon which is under observation of a machine learning/pattern recog-nition outline, a feature is an individual measurable property or characteristic of that phenomenon
under study. In other words, a feature is supposedly a variable/attribute which together with other pearly chosen features can represent the data statistically and, if selected suitably, will contribute to rather accurate classification of the entire dataset. However, choosing informative, discriminating and independent features is a crucial step for the development of effective algorithms in pattern recognition, classification and regression. Having said that, “feature extraction” is the process of starting from an initial set of measured data and building the derived values (features), aiming to provide a suitable feature set that would be informative, facilitating the subsequent learning and generalization steps, and in some cases leading to better human interpretations.
BCIs extract some features from brain signals that reflect similarities to a certain class as well as differences from the rest of the classes. The extracted features should be measured or derived from the properties of the signals which contain the discriminative information needed to distinguish their different types. However, the challenging issue of feature extraction in BCIs is that it is interwoven with the fact that the information of interest in brain signals is hidden in a highly noisy environment, and brain signals comprise a large number of simultaneous sources. A signal that may be of interest could be overlapped in time and space by multiple signals from different brain tasks. For that reason, in many cases, it is not enough to use simple methods such as a bandpass filter to extract the desired band power.
From a signal processing point of view, feature extraction is done after preprocessing and data dimension reduction, as an important step in the construction of any pattern classification and aims at the extraction of the relevant information that characterizes each class. These feature vectors are then used by classifiers to recognize the input unit with target output unit. The classifier’s task is much more facilitated if it is to classify between different classes by looking at these features as it allows fairly straightforward to distinguish. However, before concatenated into a single feature vector, multiple features can be selected from different channels and from various time segments, although, it is not desirable to process high dimensional features. In several neuroimaging studies, the sample size, or the number of the subjects of the study, is often much less than the size of scanned samples. Therefore, the number of features greatly outnumbers the number of the subjects. This challenge is known as“curse of dimensionality”or“small-n-large-p”[41]. In order to choose the most suitable features, one may attempt to examine all the possible subsets for the features,
although, as the number of possibilities grows exponentially, this approach becomes more and more impractical and exhaustive method of search. Obviously, there are more efficient and optimal feature extraction methods to replace this exhaustive search.
Before moving forward to describing the feature extraction technique used in this thesis, it is worth viewing feature extraction and classification from a big picture. The classification step, as the final step of recognizing the patterns, can be done in three different ways: (i) Supervised; (ii) Unsupervised; and, (iii) Semi-Supervised, which will be discussed more in details throughout the next section. Note that the feature extraction techniques utilized for different parts of my thesis are all chosen with regards to a supervised classification method. In order to select the most appropriate classifier for a given BCI system, it is essential to clearly understand what features are used, what their properties are and how they are used. The next two subsections are allocated to provide a brief overview on Common Spatial Patterns (CSP) method.
2.4.1 Common Spatial Patterns
The Common spatial patterns is a particularly popular and powerful signal-processing technique used for feature extraction in EEG-based BCIs. Originally, CSP has been designed for the analysis of multichannel data belonging to 2-class problems. Nevertheless, some extensions for multiclass BCIs have also been proposed, e.g., [42], which is not the focus of this thesis, thus, is not explained. The CSP, as a mathematical algorithm, computes spatial filters that aim at achieving optimal discrimination by separating a multivariate signal into additive subcomponents which have maxi-mum differences in variance between two classes. Hence, the signal-to-noise ratio is increased and adverse effects of volume conduction is reduced [43]. In other words, CSP projects multichannel EEG signals into a subspace, where the differences between classes are highlighted and the similar-ities are minimized. It aims to make the subsequent classification much more effective. The main idea of the CSP approach is to employ a linear transform to project the multi-channel EEG data onto a low-dimensional spatial subspace. The rows of the projection matrix which serves to this goal consist of the associated weights of the channels. The CSP method is based on simultaneous diagonalization of the covariance matrices of both classes. The Algorithm2describes the steps of implementation of CSP.
Algorithm 2 COMMONSPATIALPATTERNSSTEP BYSTEP(FOR FEATURE VECTORS OF SIZE2)
Input: {(a)Original EEG (OEEG) signals as a tensor of sizeNc×Nt×Ne;Ncbeing the number
of EEG channels,Ntdenotes the number of time samples within each trial of performing the
task by the subject, andNerepresents the number of times subject performed the task;(b)Labels
of OEEG, that indicate to which class each trial belongs.}
Output: {Feature Vectors, ready to be classified}
1: Covariance Matrices: Computing the sample covariance matrix corresponding to each trial
Xias follows:
Ci =
XiXiT
Trace(XiXiT)
(4)
The superscriptT indicates the transpose of the matrix.
2: Class Distinguisher Loop: Trial by trial, eachCiis assigned to its corresponding class, using
the labels. 3: Class Averages:
•The covariance matrices of each class are averaged resulting inC¯1andC¯2.
•The composite spatial covarianceCcis computed as follows.
Cc=C¯1+C¯2. 4: Whitening Matrix:
•The composite spatial covariance is decomposed to its eigenvalues and eigenvectors , in respect to the average covariance matrix of the first class, i.e.,
[EV ec,EV al] =eig(C¯c,C¯1).
•Whitening matrix is composed as follows. W(:,1) =EV ec(:,1);
W(:,2) =EV ec(:, end);
5: Finalizing the feature vectors:
•The Whitening matrix is applied to each trial of the original data, i.e., Zi =Wt×Xi×Xit×W.
•Feature vector corresponding to each trial’sZis computed as follows.
fi= logdiagonal
(Zi)
trace(Zi)
. (5)
The aforementioned algorithm is constructed for the case where it is preferred to utilize feature vectors each including two elements. In the case where more elements are required, at Step 4, symmetrically, an equal number of eigenvectors are retrieved and put together to build the whitening matrix. This completes a brief outline over feature extraction. Throughout the next chapters, the additional feature extraction methods will be described. Next section is allocated to explanation of classification, the last step of processing data in any desired BCI.
2.5
Classification
As stated previously, the primary goal of a BCI is to translate the intent of a subject directly into control commands for a computer application, a neuroprosthesis, or any other external device. In BCIs which take advantage of training data to build a model for translation of the features (su-pervised learning), users are provided with instructions on how to perform a task as a response to a stimulus. Thereafter, an often significant number of trials are required to calibrate a BCI and prepare it for successful further analysis and interpretation. In most existing BCIs, this identification relies on a classification algorithm, i.e., an algorithm that aims at automatically estimating the class of data as represented by a feature vector. This objective can be accomplished by a statistical analysis of a calibration measurement in which the subject performs well-defined mental acts, such as imagined movements [44].
Classification is defined as the problem of statistically identifying to which of a set of categories a new observation belongs. This problem attempts to learn the relationship between a set of feature variables and a target variable of interest. Since many practical problems can be expressed as associations between feature and target variables, this provides a broad range of applicability of this model [45]. In the importance of clarification of the classification terminology, it is essential to define a few terms used throughout this thesis:
• Trial & Epoch: During a run/experiment with an EEG-based BCI, the subject is asked to perform the task related to the stimulus a certain number of times, each of these observations is called a trial. The set of signals recorded during a trial is called an epoch.
• Label: In the event of knowing the intent of the subject associated with a trial beforehand, this information is considered as a label.
• Training Data/Trials: The training data, as a part of collected data, consists of labeled trials utilized to construct a classification model. These trials together are also called the training data/dataset.
• Test Data/trials: The test trials, the rest of collected data, are those that are evaluated using the generated model via the training trials, and the classification model assigns a label to each
unlabeled test trial.
• Classification Accuracy: In the case that the grand truth, i.e. labels of the test data, is avail-able, it is compared against the estimated label and overall performance of the classification model is reported as the classification accuracy, often in percentage.
Based on the stated definition, a classifier is defined as a function or an algorithm that maps every possible input available in the calibration (training) dataset to a finite set of decisions. In other words, given a set of training data points along with their associated training labels, a classifier determines the class label for an unlabeled test instance. Class

![Figure 2.1: An example of 10-20 setting of EEG electrodes placement [30].](https://thumb-us.123doks.com/thumbv2/123dok_us/391925.2543563/30.918.264.712.130.379/figure-example-setting-eeg-electrodes-placement.webp)
![Figure 2.3: An example of possible and optimal hyperplanes [50]](https://thumb-us.123doks.com/thumbv2/123dok_us/391925.2543563/47.918.294.679.120.453/figure-example-possible-optimal-hyperplanes.webp)
![Table 3.3: Performance comparison of the proposed GD-BCI method in two-class classification problem with that provided by [54] and [59].](https://thumb-us.123doks.com/thumbv2/123dok_us/391925.2543563/60.918.161.857.175.400/table-performance-comparison-proposed-method-classification-problem-provided.webp)
![Figure 3.2: Functional clustering of human brain [60].](https://thumb-us.123doks.com/thumbv2/123dok_us/391925.2543563/62.918.407.570.129.264/figure-functional-clustering-of-human-brain.webp)
