A simple maximum power point tracker for thermoelectric generators
1Alexandros Paraskevas, Eftichios Koutroulis1 2
School of Electronic and Computer Engineering, 3
Technical University of Crete, 4
Chania, GR-73100, Greece 5
Abstract: ThermoElectric Generators (TEGs) are capable to harvest the ambient thermal energy for
6
power-supplying sensors, actuators, biomedical devices etc. in the µW up to several hundreds of Watts range.
7
In this paper, a Maximum Power Point Tracking (MPPT) method for TEG elements is proposed, which is based
8
on controlling a power converter such that it operates on a pre-programmed locus of operating points close to
9
the MPPs of the power-voltage curves of the TEG power source. Compared to the past-proposed MPPT
10
methods for TEGs, the technique presented in this paper has the advantage of operational and design simplicity.
11
Thus, its implementation using off-the-shelf microelectronic components with low-power consumption
12
characteristics is enabled, without being required to employ specialized integrated circuits or signal processing
13
units of high development cost. Experimental results are presented, which demonstrate that for MPP power
14
levels of the TEG source in the range of 1-17 mW, the average deviation of the power produced by the
15
proposed system from the MPP power of the TEG source is 1.87 %.
16
Keywords:Thermoelectric generator, Maximum Power Point Tracking, Boost converter, Energy harvesting.
17
1. Introduction 18
The application of energy harvesting technologies has emerged during the last years for satisfying the
19
power-supply requirements of power-autonomous devices, by scavenging the mechanical, waste heat,
20
biological etc. energy, which is available in their surrounding environment [1]. The harvested energy is then
21
interfaced to a microelectronic energy management system for conversion to a form suitable for
22
power-supplying the target electronic load. Among the energy harvesting alternatives, the ThermoElectric
23
Generators (TEGs) comprise multiple semiconductor thermocouples (e.g. constructed using Bismuth Telluride
24
with p- and n-doping), which are capable to generate electric energy when subject to a temperature difference
25
1
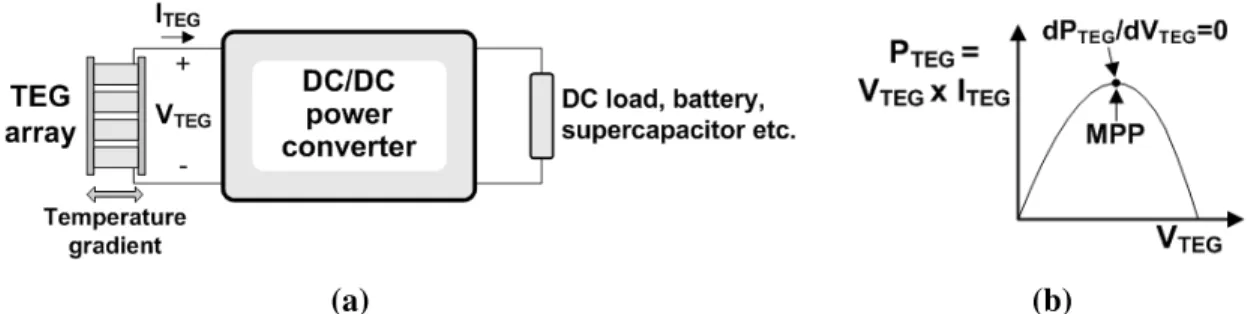
(a) (b)
Fig. 1 A thermoelectric energy harvesting system: (a) a generalized block diagram and (b) an example of the power-voltage characteristic of a TEG module.
across their hot and cold sides [2]. The TEGs feature high reliability, do not contain moving parts [3] and
26
exhibit compactness, long-lifetime and low-weight features. Thus, they are suitable for installation on surfaces
27
where thermal flows are developed (e.g. human body, pipes of hot liquids, combustion engines, vehicle
28
exhausts etc.). The TEG devices are capable to power supply, in the µW up to several hundreds of Watts range,
29
medical devices, wearable and wireless sensors, remote actuators, interplanetary space flight systems etc.
30
(e.g. [4-8]).
31
A generalized block diagram of a thermoelectric energy harvesting system is illustrated in Fig. 1(a). The
32
TEG power source is connected to a DC/DC power converter, which interfaces the generated power to the
33
system load or an energy storage unit (rechargeable battery or super-capacitor) [9]. An example of the
34
power-voltage characteristic of a TEG module is depicted in Fig. 1(b), indicating that the TEG power source
35
exhibits a point where the generated power is maximized (i.e. Maximum Power Point, MPP). The necessary
36
condition that must be satisfied by a Maximum Power Point Tracking (MPPT) process for maximizing the
37
power generated by the TEG source, is the following:
38 0 TEG TEG P V ∂ = ∂ (1) 39
where PTEG (W), VTEG (V) is the TEG output power and voltage, respectively.
40
A wide variety of techniques have been proposed in the past for performing the MPPT process in TEG-based
41
energy harvesting systems, as analyzed in the following.
42
The Perturbation and Observation (P&O) or hill-climbing MPPT technique is based on the result of
43
comparison of successive measurements of the TEG output power [10, 11], which are performed before and
after, respectively, the duty cycle of the power converter has been perturbed. The Incremental-Conductance
45
(InC) algorithm is based on the principle that at the MPP of the TEG generator, it holds that [11]:
46
(
)
0 TEG TEG 0
TEG TEG TEG TEG
TEG TEG
TEG TEG TEG TEG TEG
I V P I I I I V V V V V V ∂ ⋅ ∂ ∂ ∂ = ⇒ = + = ⇒ = − ∂ ∂ ∂ ∂ (2) 47
where ITEG (A) is the TEG output current.
48
Thus, by measuring and comparing the values on the two sides of (2), the TEG operating point is progressively
49
moved to the MPP. A voltage-trend detection circuit has been designed in [12], where the gradient of a
50
Boost-converter output power is detected by measuring the corresponding output voltage, thus achieving a
51
low-power implementation of the hill-climbing MPPT approach. The MPPT efficiency of the P&O and InC
52
algorithms is affected by circuit noise, as well as by the accuracy of calculating the TEG output power or
53
current gradient. As discussed in [11], increasing the perturbation step results in a high steady-state oscillation
54
around the MPP, which reduces the TEG power production. On the other hand, increasing the accuracy of the
55
power or gradient measurements, increases the complexity and power consumption of the MPPT control unit.
56
This operational characteristic is especially crucial in low-power TEG applications where the power production
57
of the TEG source and the power consumption of the control-unit are of the same order of magnitude.
58
For performing the MPPT process in [13, 14], the TEG power source is periodically disconnected from the
59
power converter in order to measure its open-circuit voltage, , 0
TEG TEG oc TEG I
V =V = . Then, SEPIC- and Boost-type
60
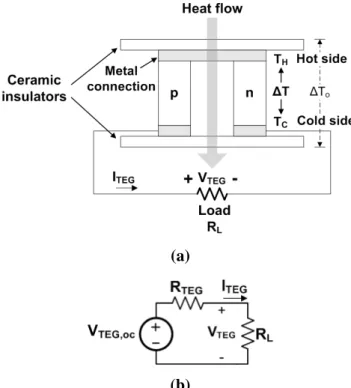
DC/DC power converters, respectively, are controlled such that the TEG source operates at VTEG oc, / 2, which
61
corresponds to the MPP. This technique is usually referred to as the “fractional open-circuit voltage” (FOCV)
62
MPPT method. Similarly, in the “fractional short-circuit current” (FSCC) MPPT method, the TEG source is
63
periodically set to operate under a short-circuit condition and the corresponding short-circuit output current,
64 , TEG sc I , is measured (i.e. , 0 TEG TEG sc TEG V
I =I = ) [11, 15]. The power stage is then controlled such that the TEG
65
output current is equal to the half of the previously measured short-circuit TEG current, thus achieving
66
operation at the MPP. Despite their operational simplicity, the FOCV and FSCC MPPT methods are not able to
67
track the short-term changes of the MPP, which occur between successive measurements of the open-circuit
68
voltage or short-circuit current. Else, the sampling frequency of the open-circuit voltage or short-circuit current
should be substantially increased, resulting in power loss, since the power production of the TEG device is
70
suspended during the open-circuit voltage or short-circuit current measurements. In order to avoid interrupting
71
the TEG source operation for measuring the open-circuit voltage, the FOCV technique has been implemented in
72
[1] by employing a pair of temperature sensors for measuring the temperature gradient developed across the hot
73
and cold sides, respectively, of the TEG source and estimating the corresponding open-circuit voltage of the
74
TEG source. However, this approach has the disadvantage that the temperature sensors employed increase the
75
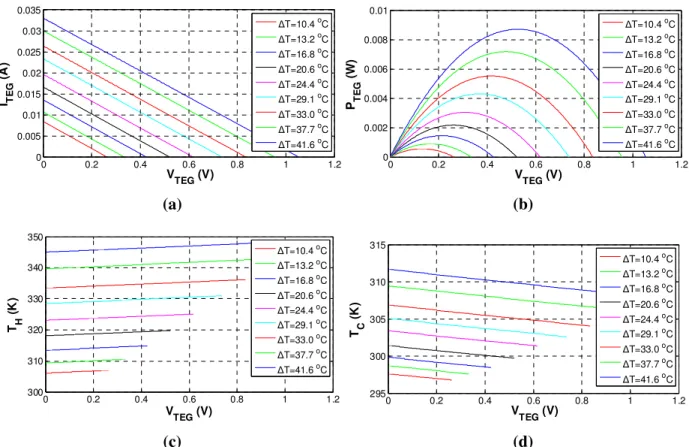
cost of the MPPT system, especially in the case that the operating temperature range of the TEG source is high
76
(e.g. in combustion engine applications).
77
A single-sensor MPPT approach for TEGs is proposed in [16]. The inductor current of a Boost-type DC/DC
78
power converter is measured and used to estimate the MPP of the TEG power source by using a model of the
79
power converter according to the state-space averaging technique. In order to apply this method, a Digital
80
Signal Processing (DSP) unit must be employed for performing the calculations dictated by the power converter
81
model during the MPPT process.
82
In another class of TEG MPPT techniques, the internal resistance of TEGs is considered approximately
83
constant over the entire span of operating temperature gradients [17]. Based on this operating principle, the
84
input impedance of a Boost-type DC/DC converter operating in the discontinuous-conduction mode, Rin, is
85
tuned in [17] to match the TEG series-resistance [i.e. “Impedance Matching” (ImpM) MPPT method], such that
86
the TEG source always operates at the MPP. The input impedance tuning is implemented by selecting the
87
switching frequency, fs and ON-time, t1, of the converter power switch, given the value of the power
88
converter inductance, L, as follows:
89 in 2 1 s 2 L R = t f ⋅ ⋅ (3) 90
A similar approach has also been employed in [18]. The ImpM method has the following disadvantages: i) the
91
efficiency of the MPPT process is affected by the accuracy of setting the inductance, incorporated in the power
92
converter, to the desired value (due to inductance value tolerance, as well as its variation with the operating
93
temperature), ii) it does not enable tuning the inductance and switching frequency to the appropriate values,
94
which would optimize the power converter performance in terms of metrics such as the power conversion
efficiency and cost and iii) the power converter operation in the discontinuous-conduction mode is not desirable
96
at higher power levels, since power semiconductors of a high current rating would be required in that case.
97
The Extremum Seeking Control (ESC) MPPT technique, which is proposed in [19], is based on the
98
implementation of a feedback control loop, where a sinusoidal perturbation is applied to the duty cycle of the
99
DC/DC converter control signal, resulting in a perturbation of the TEG-generated power. Then, the output
100
power of the TEG source is measured and the resulting signal is demodulated, indicating the gradient of the
101
TEG power-voltage curve at the corresponding operating point. This information is used to derive the new
102
duty-cycle perturbation, which will force the TEG operating point to move towards the MPP of the TEG source,
103
where condition (1) holds. The disadvantage of the ESC MPPT method is that in order to operate successfully,
104
the values of multiple parameters of the control loop must be properly adjusted.
105
In this paper, an alternative MPPT method for TEG devices is proposed, which is based on controlling a
106
power converter such that it operates on a preprogrammed locus of operating points, which reside close to the
107
MPPs of the power-voltage curves of the TEG power source. Compared to the past-proposed MPPT methods
108
described above, the technique presented in this paper has the advantage of offering more operational and
109
design simplicity. These features enable to avoid the use of specialized signal-processing and control units and
110
implement the TEG MPPT system using low-cost and off-the-shelf microelectronic components, thus reducing
111
the development cost of the overall MPPT system. Therefore, a universal MPPT method for TEGs is proposed
112
in this paper, which is suitable for application in both low-power energy harvesting applications, where it is
113
crucial to reduce the power consumption of the MPPT control unit, as well as high-power TEG-based energy
114
production systems.
115
This paper is organized as follows: the modeling and operational characteristics of TEG devices are
116
described in Section 2; the proposed MPPT system is presented in Section 3 and the experimental results are
117
presented in Section 4; a comparison of the hardware requirements for implementing the proposed and prior-art
118
MPPT methods is presented in Section 5 and, finally, the conclusions are discussed.
119
2. Modeling and operational characteristics of TEGs 120
A TEG device consists of multiple thermocouple elements that are connected electrically in series and
121
thermally in parallel [20]. The basic structure of a thermocouple element is presented in Fig. 2(a) [21]. The
TEG structure consists of two heavily doped semiconductors with their edges connected to conductors, thus
123
creating an electrical loop. During operation, different temperatures are applied on these junctions [i.e. TH and
124
C
T in Fig. 2(a)] causing electrons and holes in the n-type and p-type semiconductors, respectively, to flow from
125
the hot to the cold side. This process results in the development of an electric field across the p and n
126
semiconductors, due to the Seebeck effect. The voltage VTEG oc, (V), which is produced at the cold junction of
127
Fig. 2(a) under open-circuit conditions (i.e. in case that the thermoelectric element load resistance is RL = ∞),
128
is proportional to the temperature difference between the hot and cold junctions, ∆T (oC), according to the
129 following equation [21]: 130 , TEG 0 ( ) TEG oc TEG I pn H C pn V =V = =α ⋅ T −T =α ⋅ ∆T (4) 131
where αpn (V /oC) is the Seebeck coefficient between the p and n semiconductors and TH ( o
C), TC ( o
C) are
132
the temperatures of the hot and cold side, respectively.
133
The p and n semiconductors have positive and negative Seebeck coefficients, respectively. Thus, parameter αpn
134
is positive. The values of T H and TC in (4) are calculated as analyzed in [21], taking into account: (i) the Joule
135
effect and (ii) the heat transfer rates from the thermal source to the hot junction through the top ceramic plate
136
and from the cold junction to the environment through the bottom ceramic plate [as shown in Fig. 2(a)] due to
137
the thermal conductance of the ceramic plates.
(a)
(b)
Fig. 2 A TEG element: (a) structure and (b) equivalent circuit.
The equivalent circuit of a TEG element is depicted in Fig. 2(b). Assuming that a load, RL, is connected to
139
the terminals of the thermoelectric element, then the output power of the thermoelectric generator is calculated
140 using (4), as follows: 141
(
)
2 , 2 2 2 L TEG oc pn L TEG L TEG L TEG L R V T R R R P R R R α ⋅ + ∆ = = + (5) 142where RTEG (Ω) is the internal electric resistance of the thermoelectric element.
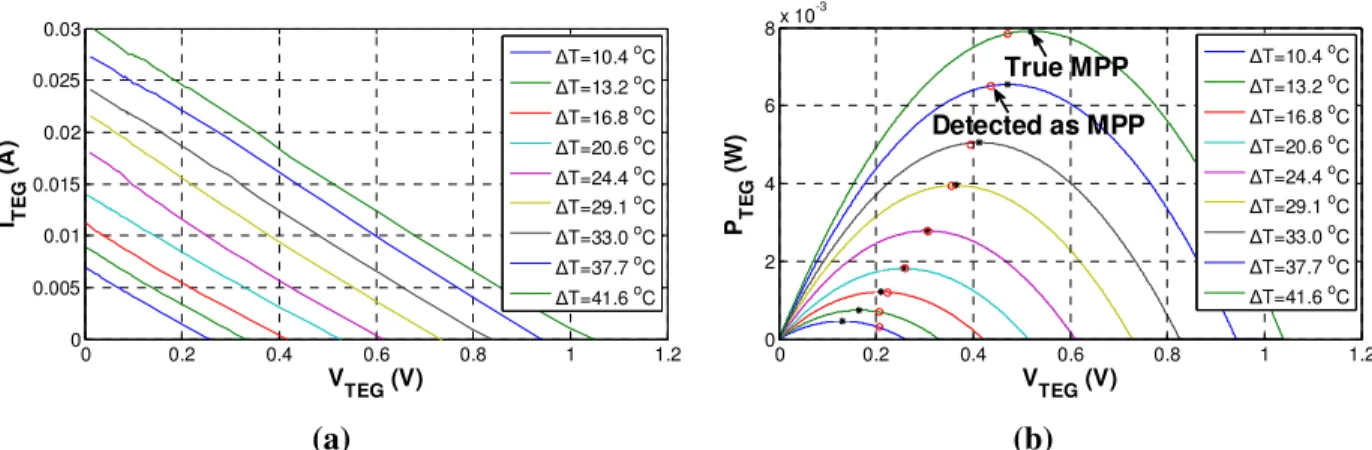
143
Using ceramic plates with a high thermal conductance enables the development of a temperature gradient across
144
the outside surfaces of the TEG element [i.e. ∆To in Fig. 2(a)], which is close to ∆T, thus maximizing the
145
power production of the thermoelectric energy conversion device.
I TE G ( A ) VTEG (V) 0 0.2 0.4 0.6 0.8 1 1.2 0 0.005 0.01 0.015 0.02 0.025 0.03 0.035 ∆T=10.4 οC ∆T=13.2 οC ∆T=16.8 oC ∆T=20.6 oC ∆T=24.4 oC ∆T=29.1 oC ∆T=33.0 oC ∆T=37.7 oC ∆T=41.6 oC 0 0.2 0.4 0.6 0.8 1 1.2 0 0.002 0.004 0.006 0.008 0.01 PT E G ( W ) VTEG (V) ∆T=10.4 oC ∆T=13.2 oC ∆T=16.8 oC ∆T=20.6 oC ∆T=24.4 oC ∆T=29.1 oC ∆T=33.0 oC ∆T=37.7 oC ∆T=41.6 oC (a) (b) 0 0.2 0.4 0.6 0.8 1 1.2 300 310 320 330 340 350 T H ( K ) VTEG (V) ∆T=10.4 oC ∆T=13.2 oC ∆T=16.8 oC ∆T=20.6 oC ∆T=24.4 oC ∆T=29.1 oC ∆T=33.0 oC ∆T=37.7 oC ∆T=41.6 oC 0 0.2 0.4 0.6 0.8 1 1.2 295 300 305 310 315 T C ( K ) V ΤΕG (V) ∆T=10.4 oC ∆T=13.2 oC ∆T=16.8 oC ∆T=20.6 oC ∆T=24.4 oC ∆T=29.1 oC ∆T=33.0 oC ∆T=37.7 oC ∆T=41.6 oC (c) (d)
Fig. 3 The theoretically calculated characteristics of a TEG device for various values of ∆T: (a) current-voltage, (b) power-current-voltage, (c) hot junction temperature-voltage and (d) cold junction temperature-voltage.
The maximum power transfer from the TEG source to the load is achieved under the condition that
147
TEG L
R =R . In this case, the power transferred to the load is calculated using the following equation:
148 ax 2 2 ,m 4 p E EG n T G T T P R α = ∆ (6) 149
To further explore the operational characteristics of thermoelectric generators, a TEG device with
150
0.026 /o
pn V C
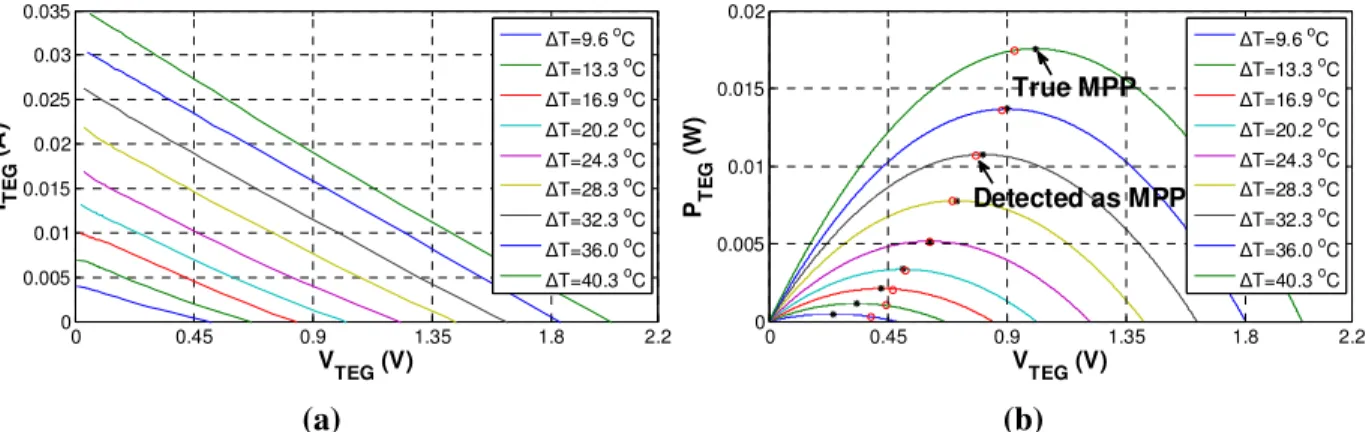
α = , VTEG oc, =0.63V , ITEG sc, =0.02A and PTEG,max =3.19mW for 25 o
T C
∆ = , has been
151
considered. A software program operating under the MATLAB platform has been developed, which calculates
152
the current-voltage and power-voltage characteristics of the TEG element based on the modeling of TEG
153
devices presented above. Examples of the theoretically calculated current-voltage and power-voltage
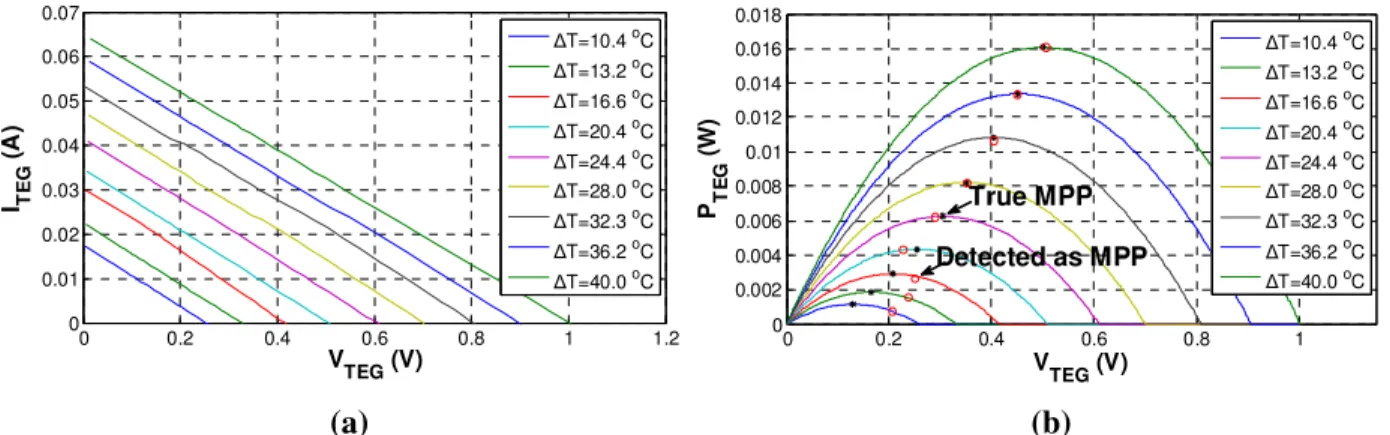
154
characteristics of the TEG device under consideration for various values of ∆T , are depicted in Figs. 3(a)
155
and (b). The corresponding values of T H and TC are shown in Figs. 3(c) and (d), respectively. It is observed
156
that for each value of ∆T, a unique MPP is exhibited by the corresponding power-voltage characteristic of the
TEG source. Due to the linearity of the TEG element equivalent circuit, consisting of a voltage source
158
connected in series with a resistance [Fig. 2(b)], an array formed by multiple such TEG elements connected in
159
series and parallel is also modeled by an equivalent circuit of the same form. Thus, such a TEG array exhibits a
160
power-voltage curve with a single MPP for each value of ∆T , without any local MPPs. This has also been
161
verified through the experimental results, which will be presented in the following.
162
The modeling and operational characteristics of TEGs, which have been presented above, have been
163
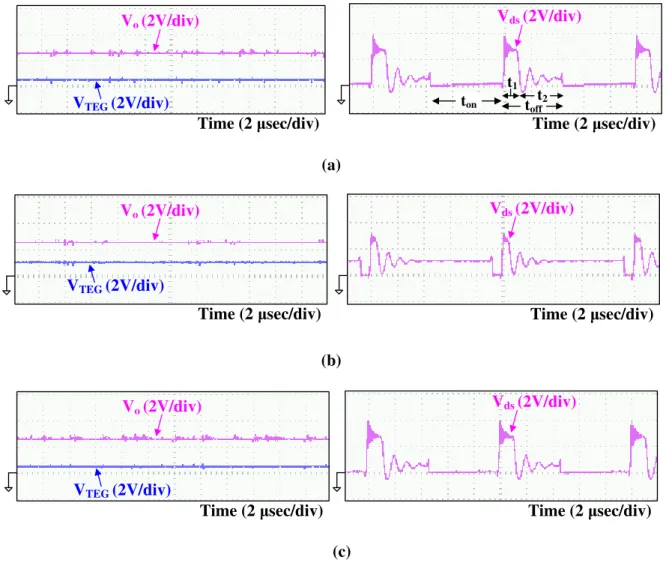
exploited for the development of a new MPPT method for TEG devices, as analyzed next.
164
3. The proposed MPPT system 165
According to the equivalent circuit of the TEG element, which is illustrated in Fig. 2(b), for each value of
166
the temperature gradient ∆T it holds that:
167
,
1
TEG TEG TEG oc TEG TEG
TEG TEG I V V I R V R ∂ = − ⋅ ⇒ = − ∂ (7) 168
In low-power energy harvesting applications, the power consumption of the MPPT control unit may become
169
comparable to the power generated by the power source. Thus, it is indispensable to optimally explore the
170
trade-off between increasing the accuracy of the MPPT system and reducing the power consumption of the
171
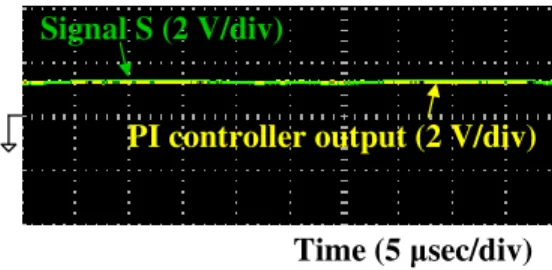
microelectronic subsystem, which executes the MPPT control operation. In order to simplify the
172
implementation of the MPPT control system and reduce its power consumption, in the proposed MPPT method
173
the variation of RTEG with temperature (which is also a function of the TEG output current due to the Joule
174
effect [21]) is assumed negligible, as also considered in [17] and [18]. In such a case, the value of RTEG
175
remains constant to RTEG =RTEG c, for all values of ∆T, where RTEG c, is the constant value of the TEG resistance.
176
Thus, considering (7), in the proposed MPPT method the value of TEG TEG I V − in (2) is compared with , 1 TEG c R − 177 instead of TEG TEG I V ∂
∂ , which is used in the InC method and the condition for convergence to the TEG source MPP
178
under any temperature gradient conditions is the following:
179 , 1 0 TEG TEG TEG c I V R − = (8) 180
The actual resistance of the TEG source deviates from the (constant) value of the TEG resistance, which is
181
considered in (8), due to the temperature sensitivity of the TEG resistance, the tolerance with respect to the
182
datasheet value etc. The output power of the TEG source, which results for each value of ∆T when operating at
183
the operating points defined by (8), PTEG o, , is calculated by setting RL =RTEG c, in (5), as follows:
184
(
)
2 2 , , 2 , pn TEG c TEG o TEG TEG c T R P R R α ∆ = + (9) 185where RTEG is the actual resistance of the TEG source for each value of ∆T.
186
For commercially available TEG devices, the value of RTEG changes by approximately 0.3 0.75 %− per 1 o
C
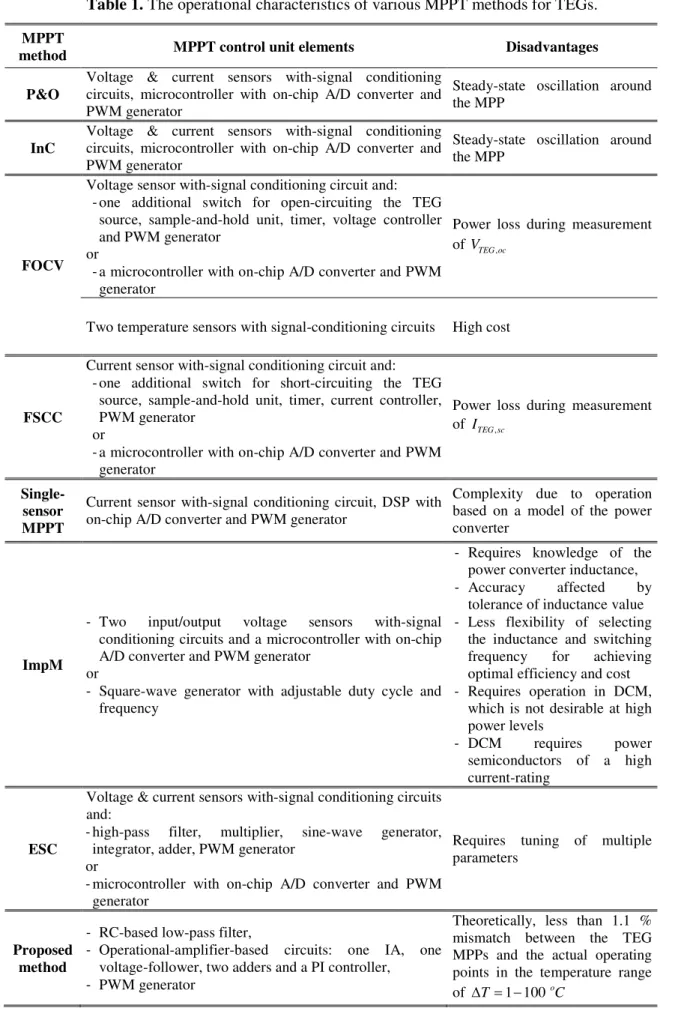
187
increase of the average temperature between the hot and cold sides. Additionally, a 12 % maximum drift of
188
TEG
R with the temperature gradient ∆T has been reported in [14]. In these cases, by setting RTEG c, equal to the
189
value of RTEG at the middle of the temperature-gradient range, the resulting deviation of PTEG o, from the
190
corresponding MPP power of the TEG source, PTEG,max , which is given by (6), is less than 0.41 % for
191
temperature gradients in the range of ∆ = −T 1 40 oC. This deviation is increased to 1.1 % for ∆ = −T 1 100oC.
192
Thus, by following the TEG source operating points defined by (8), without considering the effect of
193
temperature on the TEG resistance value, the resulting deviation of the generated power from the actual MPP
194
power remains at an acceptable level and, simultaneously, the hardware complexity and power consumption of
195
the MPPT controller are reduced. For avoiding the MPPT accuracy degradation due to deviation of the actual
196
value of RTEG with respect to the information provided in the manufacturer datasheet, the value of RTEG c,
197
applied in (8) may be derived experimentally. This process may be implemented by applying a characterization
198
process of the TEG device to be employed in the target application, as described in [21]. The drift of RTEG due
199
to aging may be compensated by applying such a characterization process periodically and then re-tuning the
200
proposed MPPT system [through (8)] to operate with the new value of RTEG c, .
(a)
(b)
Fig. 4 The proposed MPPT system: (a) block diagram and (b) the MPPT tracking process.
A block diagram of the power conversion system, which implements the proposed MPPT method described
202
above, is depicted in Fig. 4(a). The topology of the power-processing circuit (i.e. Buck, Boost, Buck-Boost etc.)
203
is selected according to the magnitudes of the DC input and output voltages [22]. The proposed MPPT system
204
has been designed to operate with TEG input power sources which generate a low DC output voltage. Thus, a
205
Boost-type DC/DC power converter is employed to interface the TEG-generated power to a battery bank. The
206
Boost-type DC/DC converter may be configured by the designer to operate either in the
Continuous-207
Conduction Mode (CCM), or in the Discontinuous-Conduction Mode (DCM) [22]. In the former case, the input
208
and output voltage levels, Vin (V) and Vo (V), respectively, are related according to the following equation:
209 1 1 o in V V D = ⋅ − (10) 210
where D is the duty cycle of the power-switch control signal and 0≤D≤1.
For operation in DCM, a lower value of inductance L may be employed in the Boost-type DC/DC converter.
212
This results in an increase of the power conversion efficiency and a reduction of the inductor cost, but the
213
resulting peak currents of the power MOSFET and diode [i.e. Sm and Ds, respectively, in Fig. 4(a)] are higher
214
than in CCM. The power MOSFET type is selected such that the conduction and switching power losses during
215
the MPPT operation remain at an acceptable level. Also, a Schottky diode is used for obtaining a low voltage
216
drop across the diode, as well as a fast recovery time. The capacitors C1 and C2 in Fig. 4(a) are used for
217
eliminating the ripple of the TEG source output current and DC/DC converter output voltage, respectively.
218
The current flowing through the input inductor of the Boost-converter consists of an AC ripple imposed on a
219
DC component [22], which is equal to the DC current generated by the TEG source [i.e. ITEG in Fig. 4(a)]. The
220
average values of the AC current ripple of the converter input current and voltage developed across L are equal
221
to zero under steady-state conditions [22]. Thus, as shown in Fig. 4(a), in the proposed control unit the TEG
222
output current, ITEG, is calculated by passing the voltage vr L, through an RC low-pass filter with a 3-dB cut-off
223
frequency, which has been set equal to 1% of the Boost-converter switching frequency. The generated signal is
224
proportional to ITEG and it is amplified by connecting it to the AD8236 micro-power instrumentation amplifier
225
[i.e. IA in Fig. 4(a)], in order to obtain a high common-mode rejection ratio. Thus, the TEG current is measured
226
with an overall gain, Gid, which depends on the series resistance of the power inductor, rL (Ω) and the IA gain,
227 a G , as follows: 228 , o IA id L a TEG V G r G I = = ⋅ (11) 229
where Vo IA, (V) is the IA output voltage.
230
The TEG output voltage is measured using a resistive voltage divider with an attenuation coefficient equal to
231
vd
G , which is connected to an operational-amplifier-based voltage-follower. The measured current and voltage
232
signals are then added, resulting in the production of the following signal:
233
vd
id TEG vd TEG id TEG TEG
id G S G I G V G I V G = ⋅ − ⋅ = ⋅ − ⋅ (12) 234
In order to perform the MPPT process in the proposed technique, the value of vd id
G
G in (12) is set to a constant
235
value, which is equal to
,
1
TEG c
R , thus implementing (8). As described above, the series resistance of the TEG
236
power source, RTEG, is either derived by the datasheet information provided by its manufacturer or it may be
237
measured experimentally for achieving a higher accuracy. As shown in Fig. 4(b), the value of S in (12), is
238
positive on the left side of the TEG power-voltage characteristic, negative on its right side and zero at the TEG
239
MPP. According to Fig. 4(a), in the proposed MPPT system the signal S is compared with 0 V and the
240
resulting error is interfaced to a PI-controller, which then drives a Pulse Width Modulation (PWM) generator
241
for producing the variable duty-cycle / constant-frequency control signal of the Boost-type DC/DC converter
242
power MOSFET. During operation, the value of S in (12) is progressively reduced to zero. Thus, irrespectively
243
of the initial operating point [i.e. point A or B in Fig. 4(b)], the proposed process is capable to ensure
244
convergence close to the corresponding MPP for any temperature gradient developed across the surfaces of the
245
TEG source [e.g. P and 1 P in Fig. 4(b)]. 2
246
In order to avoid battery damage due to overcharging, a protection circuit has been designed and
247
implemented. As shown in Fig. 4(a), when the battery bank has been charged to the desirable level, then the
248
overcharge protection system connects the inverting input of the adder to 0 V. As a consequence, the PWM
249
signal is set to zero and the Boost converter operation is suspended. The control unit is power-supplied by the
250
battery bank, which is connected at the output of the DC/DC converter. Alternatively, a super-capacitor may
251
also be used for storing the TEG-generated energy. In the proposed system it has been assumed that when the
252
operation of the MPPT system must be initiated, the charge existing in the output energy-storage device
253
(i.e. battery or super-capacitor) is adequate to ignite the operation of the MPPT control unit.
254
In TEG applications where this condition does not apply, then start-up mechanisms such as those presented in
255
[18, 23] for thermoelectric energy harvesting systems, may also be incorporated in the proposed MPPT system
256
in order to provide the initial energy required by the MPPT control unit to start operating. However, since this
257
study is focused on the design and operation of the TEG MPPT system, this issue was not further investigated.
258 259
4. Experimental results and discussion 260
An experimental prototype of the proposed system has been constructed for evaluating its performance for
261
various TEG configurations and operating conditions. The Nextreme eTEG HV56 thermoelectric generators
262
have been employed as energy sources, while the proposed MPPT system has been built using discrete parts of
263
commercially-available, low-voltage and low-power integrated circuits. Two Ni-MH batteries connected in
264
series with a total nominal voltage of Vo=2.4 V have been connected at the output terminals of the Boost-type
265
DC/DC converter shown in Fig. 4(a). The Boost converter constructed, comprises a 28 µH inductor with a
266
series resistance of rL =5.55 mΩ, a ΒΑΤ60Α Schottky diode and a Sir802dp power MOSFET, which
267
correspond to components L, Ds and Sm, respectively, in Fig. 4(a). The input and output filter capacitors of
268
the Boost converter were set at C1=470µF and C2=1000µF, respectively. A planar core has been employed
269
in the power inductor of the Boost-type power converter [i.e. L in Fig. 4(a)] for reducing the size of the power
270
processing subsystem. After performing calculations for various planar-core types and switching frequency
271
values, the R-41805 EC-type ferrite planar core, as well as a switching frequency of 100 kHz, have been
272
selected for minimizing the power loss of the inductor. The voltage-follower, adder and PI-controller, which are
273
depicted in Fig. 4(a), have been built using the LMP2234 micro-power precision operational amplifier. The
274
PWM generator, comprising a comparator and a triangular wave generator, is based on the AD8515 low-power
275
operational amplifier. However, alternative types of components may also be employed by the designer for
276
implementing the proposed MPPT system, such that specific requirements of the target application are satisfied
277
(e.g. in terms of power rating, output voltage level etc.).
278
The experimental current-voltage curves of one TEG device for temperature gradients in the range of
279
10.4-41.6 oC , which are developed in heat harvesting applications on aircrafts, hot liquids, human
280
body etc. [5, 16, 24], are illustrated in Fig. 5(a). These current-voltage curves have been measured by disabling
281
the operation of the MPPT control unit and iteratively modifying the DC/DC Boost converter duty cycle over
282
the 0-100 % range with a 3 % step through an external square-wave generator. Due to non-linear operation
283
exhibited by the control system [Fig. 4(a)] at low input voltage levels, small amplitude ripples are observed in
284
Fig. 5(a) in the region between 0.08 V and 0.1 V, where the duty cycle value is close to 80 %. The
0 0.2 0.4 0.6 0.8 1 1.2 0 0.005 0.01 0.015 0.02 0.025 0.03 ITE G ( A ) V ΤΕG (V) ∆T=10.4 oC ∆T=13.2 oC ∆T=16.8 oC ∆T=20.6 oC ∆T=24.4 oC ∆T=29.1 oC ∆T=33.0 oC ∆T=37.7 oC ∆T=41.6 oC PT E G ( W ) V ΤΕG (V) 0 0.2 0.4 0.6 0.8 1 1.2 0 2 4 6 8x 10 -3 ∆T=10.4 oC ∆T=13.2 oC ∆T=16.8 oC ∆T=20.6 oC ∆T=24.4 oC ∆T=29.1 oC ∆T=33.0 oC ∆T=37.7 oC ∆T=41.6 oC True MPP Detected as MPP (a) (b)
Fig. 5 Experimental characteristics for one TEG device: (a) current-voltage and (b) power-voltage.
Fig. 6 The power deviation between the actual MPPs of the TEG power-voltage curve and the operating points detected as MPPs by the proposed system for various values of ∆T.
corresponding experimental power-voltage curves are depicted in Fig. 5(b). The operating points detected
286
experimentally as MPPs by the proposed MPPT system and the corresponding actual MPPs of the
power-287
voltage curves are also depicted in that figure. In order to perform the MPPT process, the control unit was then
288
configured such that it operates with a value of RTEG c, =25.7Ω in (8). This value is equal to the experimentally
289
measured internal resistance of the TEG device at ∆ =T 0oC. Next, the tracking accuracy of the proposed
290
system at various temperature levels has been evaluated. The percentage deviation between the actual MPPs
291
exhibited by the TEG power-voltage curve at various values of temperature gradient, ∆T, in the range of
292
10.4-41.6 oC and the corresponding operating points detected as MPPs by the proposed system, is plotted in
293
Fig. 6. The power deviation is 0.03-0.95 %, while it increases up to 31.99 % for ∆T values less than 13.2 o
C.
294
This power deviation is 0.01-1.86 % of the MPP power produced for ∆T=41.6 oC.
295
The experimental current-voltage curves of two TEG modules connected in series, for several temperature
296
gradients, are shown in Fig. 7(a). In this case, the proposed system has been configured to operate with a value
0 0.45 0.9 1.35 1.8 2.2 0 0.005 0.01 0.015 0.02 0.025 0.03 0.035 I TE G ( A ) VΤΕG (V) ∆T=9.6 oC ∆T=13.3 oC ∆T=16.9 oC ∆T=20.2 oC ∆T=24.3 oC ∆T=28.3 oC ∆T=32.3 oC ∆T=36.0 oC ∆T=40.3 oC P T E G ( W ) VΤΕG (V) 0 0.45 0.9 1.35 1.8 2.2 0 0.005 0.01 0.015 0.02 ∆T=9.6 oC ∆T=13.3 oC ∆T=16.9 oC ∆T=20.2 oC ∆T=24.3 oC ∆T=28.3 oC ∆T=32.3 oC ∆T=36.0 oC ∆T=40.3 oC True MPP Detected as MPP (a) (b)
Fig. 7 Experimental characteristics for two TEG modules connected in series: (a) current-voltage and (b) power-voltage.
Fig. 8 The percentage deviation between the actual MPPs of the power-voltage curve of a TEG array consisting of two TEG modules connected in series and the MPPs detected by the proposed system as MPPs, for various values of ∆T.
of RTEG c, = ×2 25.7=51.4Ω in (8). The experimentally measured power-voltage curves of two TEG devices
298
connected in series are shown in Fig. 7(b). The operating points derived experimentally as MPPs by the
299
proposed MPPT system and the corresponding actual MPPs for each value of the temperature gradient, ∆T, are
300
also displayed in that figure. The resulting variation of the tracking accuracy with operating temperature is
301
illustrated in Fig. 8. It is observed that for MPPs corresponding to ∆T values in the range of 13.3-40.3 oC, the
302
MPPs detected by the proposed system deviate by the corresponding actual MPPs of the TEG input source by
303
0.02-4.69 %. Also, the resulting power deviation is 0.01-1.15 % of the MPP power produced for ∆T=40.3 oC.
304
The experimentally measured current-voltage curves of two TEG modules connected in parallel, for several
305
temperature gradients, are presented in Fig. 9(a). For tracking the MPP, the control unit of the proposed system
306
was configured to operate with a value of RTEG c, =25.7 / 2 12.85= Ω in (8). The corresponding experimental
0 0.2 0.4 0.6 0.8 1 1.2 0 0.01 0.02 0.03 0.04 0.05 0.06 0.07 I TE G ( A ) VTEG (V) ∆T=10.4 oC ∆T=13.2 oC ∆T=16.6 oC ∆T=20.4 oC ∆T=24.4 oC ∆T=28.0 oC ∆T=32.3 oC ∆T=36.2 oC ∆T=40.0 oC 0 0.2 0.4 0.6 0.8 1 0 0.002 0.004 0.006 0.008 0.01 0.012 0.014 0.016 0.018 P T E G ( W ) VTEG (V) ∆T=10.4 oC ∆T=13.2 oC ∆T=16.6 oC ∆T=20.4 oC ∆T=24.4 oC ∆T=28.0 oC ∆T=32.3 oC ∆T=36.2 oC ∆T=40.0 oC True MPP Detected as MPP (a) (b)
Fig. 9 Experimental characteristics for two TEG modules connected in parallel: (a) current-voltage and (b) power-voltage.
Fig. 10 The percentage deviation between the actual MPP of the power-voltage curve of a TEG array consisting of two TEG modules connected in parallel and the operating points detected by the proposed system as MPPs, for various values of ∆T.
power-voltage curves of two TEG modules connected in parallel, as well as the actual MPPs and the operating
308
points detected as MPPs by the proposed MPPT system, are shown in Fig. 9(b). As shown in Fig. 10, the
309
percentage deviation (i.e. tracking accuracy) is in the range of 0.01-1.46 % for 20.4-40 oC temperature
310
gradients, while it is increased up to 34.43 % for lower values of ∆T. The power deviation is 0.01-2.41 % of
311
the MPP power produced for ∆T=40.0 oC.
312
In the experimental results presented in Figs. 5, 7 and 9, the deviation of the MPPs derived by the proposed
313
system from the actual MPPs of the TEG source (i.e. tracking accuracy) is due to: (i) the non-ideal operation of
314
the proposed control unit (especially at low DC input voltage and power levels for low values of ∆T )because
315
of e.g. tolerance of circuit component values, circuit parasitics etc.; and (ii) the setting of RTEG c, in (8) to a
316
constant value, without considering the effect of temperature, as analyzed in Section 3. However, the
experimental results presented in Figs. 6, 8 and 10, reveal that the average (arithmetic mean) deviation of the
318
power produced by the proposed system from the MPP power of the TEG source in the range of 1-17 mW, is
319
1.87 %. Thus, the performance of the proposed MPPT system in terms of tracking accuracy, is comparable to
320
the 95-99.85 % MPP tracking efficiencies of the FOCV, P&O and InC methods [25], but it has been achieved
321
using a simpler control system.
322
Experimental waveforms of VTEG , Vo and Vds of the Boost-type DC/DC converter (Fig. 4) with
323
T
∆ =40.0 oC for one TEG device, two TEG modules connected in series and two TEG modules connected in
324
parallel, respectively, are illustrated in Fig. 11. It is observed that in all cases, the DC output voltage of the
325
DC/DC converter, Vo, is higher than the corresponding DC input voltage, VTEG. During time interval ton, which
326
is indicated in Fig. 11(a), the power MOSFET of the DC/DC converter [i.e. Sm in Fig. 4(a)] is in the ON state,
327
resulting in a zero Vds voltage. Then, during time interval toff the power MOSFET is turned-off. Since the
328
DC/DC converter operates in the DCM, the drain-source voltage Vds rises up to Vo during subinterval t1 of toff ,
329
where the current of the DC/DC converter inductor [i.e. L in Fig. 4(a)] is non-zero, due to the conduction of the
330
DC/DC converter diode (i.e. Ds in Fig. 4). During time interval t2, the inductor current has been dropped to
331
zero, thus Vds is clamped to the DC input voltage level, VTEG. A similar response is also observed in the
332
waveforms depicted in Figs. 11(b) and (c), respectively. The high-frequency ringing exhibited by Vds is due to
333
the inductive and capacitive parasitic components of the power converter devices and circuit board. As
334
validated by the experimental results presented above, this high-frequency ringing does not affect the operation
335
of the proposed MPPT system due to the use of a low-pass filter [see Fig. 4(a)] for measuring the value of ITEG,
336
as analyzed in Section 3. However, it can be suppressed through the connection of a suitable RC snubber across
337
the drain and source terminals of the power MOSFET, in order to reduce the switching power losses of the
338
power converter semiconductor devices [22].
Vo (2V/div)
VTEG (2V/div)
Time (2 µsec/div) Time (2 µsec/div) Vds (2V/div) ton toff t1 t2 (a) Vo (2V/div) VTEG (2V/div)
Time (2 µsec/div) Time (2 µsec/div) Vds (2V/div)
(b) Vo (2V/div)
VTEG (2V/div)
Time (2 µsec/div) Time (2 µsec/div) Vds (2V/div)
(c)
Fig. 11 Experimental waveforms of VTEG, Vo and Vds with ∆T=40.0 o
C for: (a) one TEG device, (b) two TEG modules connected in series and (c) two TEG modules connected in parallel.
An example of the signal S waveform, as well as the output of the PI controller [see Fig. 4(a)] during
340
operation of the proposed MPPT system, is shown in Fig. 12. The operational amplifiers employed in the
341
experimental prototype of the proposed control unit are power-supplied by the battery bank (total nominal
342
voltage of Vo =2.4 V), which is connected at the output of the power converter. Thus, the corresponding
343
circuits have been tuned such that the signals S and “0 V” in Fig. 4(a) exhibit a DC offset of Vo/ 2 1.2 V=
344
with respect to the negative terminal of the battery bank, which corresponds to the ground levels indicated in
345
Figs. 4(a) and 12, respectively. Through this approach, the output of the PI controller and signal S may take
Signal S (2 V/div)
PI controller output (2 V/div)
Time (5 µsec/div)
Fig. 12 An example of the signal S waveform, as well as the output of the PI controller during operation of the proposed MPPT system.
either zero, positive or negative values with respect to “0 V”. This is indispensable for identifying the position
347
of each operating point on the power-voltage curve of the TEG source and, subsequently, forcing the control
348
loop to converge to the MPP where (8) is satisfied, as discussed in Section 3.
349
The power consumption of the proof-of-principle experimental prototype of the proposed MPPT control unit
350
has been measured to be equal to 5.13 mW. Due to the structure of the proposed control unit, this power
351
consumption is independent of the TEG source power rating and remains constant for higher values of the TEG
352
source power level. The developed laboratory prototype system is suitable for use in applications where the
353
total power produced by the TEGs is higher than the power consumption of the control system. However, in
354
this paper, the operation of the proposed MPPT system has also been investigated for DC input power levels
355
below 5.13 mW, as described above, for exploring the performance of the proposed MPPT method at low
356
power levels. Based on the information provided in the datasheets of the integrated circuits, which have been
357
employed to build the control unit, it is estimated that approximately half of the 5.13 mW control unit power
358
dissipation is consumed by the three AD8515 operational amplifiers comprising the PWM generator. The
359
experimental prototype of the proposed MPPT control unit has been built for performance evaluation purposes,
360
using discrete parts of commercially-available integrated circuits, which enables rapid prototyping with
361
relatively low cost. However, similarly to the development process employed in [12], the proposed control unit
362
can also be implemented in the form of an integrated circuit using CMOS technology for reducing its power
363
consumption to the µW level. This will also enable its application in low-power (e.g. hundreds of µW)
364
thermoelectric energy harvesting systems (e.g. [23]). In such a case, different alternative microelectronic
circuits may be used to implement the functional elements of the proposed MPPT control system
366
(i.e. amplifiers, PWM generator etc.), which are illustrated in Fig. 4(a).
367
5. Comparison with the past-proposed MPPT methods for TEGs 368
The control circuit elements required to implement the prior-art MPPT methods for TEG sources (see
369
Section 1), as well as the technique proposed in this paper, are presented in Table 1. In all MPPT methods, a
370
PWM or square-wave generator must be used for controlling the power converter. Increasing the PWM
371
frequency (i.e. switching frequency) enables to reduce the size of the power converter passive components and
372
the associated power loss. However, the maximum switching frequency, which can be produced by
373
microcontroller/DSPs with an on-chip PWM generator, is limited by their maximum permissible clock
374
frequency. As an example, for generating the 100 kHz switching frequency of the experimental prototype of the
375
proposed system with an 8-bit duty-cycle resolution (see Section 4), a microcontroller with a
376
28 x 100 kHz=25.6 MHz clock frequency must be employed, which increases the power consumption of the
377
control unit. Alternatively, an external PWM generation circuit may be interfaced to the microcontroller/DSP
378
unit. Due to their algorithmic functionality, the implementation of the P&O, InC and single-sensor techniques is
379
facilitated when using microcontroller/DSP devices, rather than discrete components (e.g. multiplier, registers,
380
derivative calculator etc.), which would result in a highly complex circuit. The use of a microcontroller/DSP is
381
mostly suitable for use in high-power TEG systems, where additional functions (e.g. battery-bank charging
382
regulation, state of charge estimation etc.) are also incorporated in the algorithm executed by the
383
microcontroller/DSP device.
384 385
Table 1.The operational characteristics of various MPPT methods for TEGs.
386
MPPT
method MPPT control unit elements Disadvantages
P&O
Voltage & current sensors with-signal conditioning circuits, microcontroller with on-chip A/D converter and PWM generator
Steady-state oscillation around the MPP
InC
Voltage & current sensors with-signal conditioning circuits, microcontroller with on-chip A/D converter and PWM generator
Steady-state oscillation around the MPP
FOCV
Voltage sensor with-signal conditioning circuit and:
-one additional switch for open-circuiting the TEG source, sample-and-hold unit, timer, voltage controller and PWM generator
or
-a microcontroller with on-chip A/D converter and PWM generator
Power loss during measurement of VTEG oc,
Two temperature sensors with signal-conditioning circuits High cost
FSCC
Current sensor with-signal conditioning circuit and:
-one additional switch for short-circuiting the TEG source, sample-and-hold unit, timer, current controller, PWM generator
or
-a microcontroller with on-chip A/D converter and PWM generator
Power loss during measurement of ITEG sc,
Single-sensor MPPT
Current sensor with-signal conditioning circuit, DSP with on-chip A/D converter and PWM generator
Complexity due to operation based on a model of the power converter
ImpM
- Two input/output voltage sensors with-signal conditioning circuits and a microcontroller with on-chip A/D converter and PWM generator
or
- Square-wave generator with adjustable duty cycle and frequency
- Requires knowledge of the power converter inductance,
- Accuracy affected by tolerance of inductance value
- Less flexibility of selecting the inductance and switching frequency for achieving optimal efficiency and cost
- Requires operation in DCM, which is not desirable at high power levels
- DCM requires power semiconductors of a high current-rating
ESC
Voltage & current sensors with-signal conditioning circuits and:
-high-pass filter, multiplier, sine-wave generator, integrator, adder, PWM generator
or
-microcontroller with on-chip A/D converter and PWM generator
Requires tuning of multiple parameters
Proposed method
- RC-based low-pass filter,
- Operational-amplifier-based circuits: one IA, one voltage-follower, two adders and a PI controller,
- PWM generator
Theoretically, less than 1.1 % mismatch between the TEG MPPs and the actual operating points in the temperature range of ∆ = −T 1 100oC
In the FOCV, FSCC and single-sensor methods, one sensor must be employed for executing the MPPT
387
control process, together with the accompanying signal-conditioning circuits, while the rest MPPT techniques
388
require two sets of sensors and signal-conditioning circuits. However, the hardware resources employed for
389
implementing the FOCV and FSCC MPPT methods are relatively high. This is due to the requirement of
390
specialized circuits which must be employed, such as a sample-and-hold unit, which is controlled by a timer,
391
for storing the TEG open-circuit voltage or short-circuit current until the next sampling cycle. Then, a
392
voltage/current controller, which typically comprises a PI control module, adjusts the power converter duty
393
cycle such that the TEG output voltage or current, respectively, is regulated to the desired value. Also,
394
depending on the power converter topology, a power switch together with the corresponding gate-drive circuit
395
may have to be added in the power converter circuit for open-/short-circuiting the TEG source. This increases
396
the cost of the power-processing circuit proportionally to the power rating of the TEG energy-conversion
397
system. The FOCV MPPT method implementation employing two temperature sensors, also results in a
398
relatively high system cost, especially in case that the TEG source operating temperature range is high (e.g. in
399
combustion engine applications).
400
The control unit complexity in the single-sensor MPPT method is relatively high due to the need of using a
401
DSP unit in order to perform the calculations required by the power converter model during the MPPT process.
402
Thus, the application of this method in low-power energy harvesting applications is not feasible due to the
403
resulting high power-consumption of the control unit. The ImpM technique can easily be implemented either
404
using discrete components, or within an IC, but exhibits significant operational disadvantages (see Section 1
405
and Table 1). The hardware complexity of the ESC MPPT method is relatively higher due to the need of more
406
specialized circuits for its application. This complexity is further enhanced by the requirement of having the
407
ability to tune multiple parameters in order to achieve a successful operation.
408
In contrast to the past-proposed MPPT methods for TEGs, the design of the proposed MPPT control system
409
(i.e. Fig. 4) is based on only a few ordinary micro-power operational amplifiers, as analyzed in Section 3, which
410
are relatively simple to either use as discrete components, or built within an IC. The control technique presented
411
in this paper is simpler in terms of implementation, since it is not required to include an additional power switch,
412
or use specialized and/or power-consuming circuit elements. Also, it is not constrained by the maximum PWM
frequency generation capability of microcontroller/DSP devices and does not require either knowledge of the
414
power converter inductance, or tuning of multiple parameters. Simultaneously, as analyzed in Section 4, the
415
proposed technique achieves a tracking accuracy which is comparable with that of the FOCV, P&O and InC
416
methods.
417
6. Conclusions 418
Thermoelectric generators are employed for harvesting the ambient thermal energy in order to power-supply
419
a wide variety of devices, such as sensors, actuators and medical devices, in the µW up to several hundreds of
420
Watts range. The power-voltage characteristic of a TEG array exhibits a unique MPP where the power
421
produced by the TEG source is maximized. The MPP position changes according to the temperature gradient,
422
which is developed across the surfaces of the individual TEG elements comprising the TEG source.
423
In this paper, an MPPT method for TEGs has been presented, which is suitable for application in both low-
424
and high-power energy harvesting applications. The proposed technique is based on controlling a power
425
converter such that it operates on a preprogrammed locus of operating points, which are located close to the
426
MPPs of the power-voltage curve of the TEG power source. In contrast to the past-proposed MPPT methods for
427
TEGs, the design of the proposed MPPT control system is based on only a few ordinary micro-power
428
operational amplifiers, which are relatively simple to either use as discrete components, or built within an IC.
429
The control technique presented in this paper is simpler in terms of implementation, since it is not required to
430
include an additional power switch, or use specialized and/or power-consuming circuit elements characterized
431
by a high development cost. Also, it is not constrained by the maximum PWM frequency generation capability
432
of microcontroller/DSP devices and does not require either knowledge of the power converter inductance, or
433
tuning of multiple parameters. Simultaneously, the proposed technique achieves a tracking accuracy which is
434
comparable with that of the FOCV, P&O and InC methods.
435
References 436
[1] J.-D. Park, H. Lee, M. Bond, “Uninterrupted thermoelectric energy harvesting using
temperature-sensor-437
based maximum power point tracking system,” Energy Conversion and Management, vol. 86,
438
pp. 233-240, 2014.
[2] Shuhai Yu, Qing Du, Hai Diao, Gequn Shu, Kui Jiao, “Effect of vehicle driving conditions on the
440
performance of thermoelectric generator,” Energy Conversion and Management, vol. 96, pp. 363-376,
441
2015.
442
[3] Qing Du, Hai Diao, Zhiqiang Niu, Guobin Zhang, Gequn Shu, Kui Jiao, “Effect of cooling design on the
443
characteristics and performance of thermoelectric generator used for internal combustion engine,” Energy
444
Conversion and Management, vol. 101, pp. 9-18, 2015.
445
[4] Yongming Shi, Yao Wang, Yuan Deng, Hongli Gao, Zhen Lin, Wei Zhu, Huihong Ye, “A novel
446
self-powered wireless temperature sensor based on thermoelectric generators,” Energy Conversion and
447
Management, vol. 80, pp. 110-116, 2014.
448
[5] M. Lossec, B. Multon, H. B. Ahmed, “Sizing optimization of a thermoelectric generator set with heatsink
449
for harvesting human body heat,” Energy Conversion and Management, vol. 68, pp. 260-265, April
450
2013.
451
[6] R. Bonin, D. Boero, M. Chiaberge, A. Tonoli, “Design and characterization of small thermoelectric
452
generators for environmental monitoring devices,” Energy Conversion and Management, vol. 73,
453
pp. 340-349, 2013.
454
[7] S. Yadav, P. Yamasani, S. Kumar, “Experimental studies on a micro power generator using
455
thermoelectric modules mounted on a micro-combustor,” Energy Conversion and Management, vol. 99,
456
pp. 1-7, 2015.
457
[8] M.C. Barma, M. Riaz, R. Saidur, B.D. Long, “Estimation of thermoelectric power generation by
458
recovering waste heat from biomass fired thermal oil heater,” Energy Conversion and Management,
459
vol. 98, pp. 303-313, 2015.
460
[9] S. Kim, P. H. Chou, “Size and topology optimization for supercapacitor-based sub-Watt energy
461
harvesters,” IEEE Transactions on Power Electronics, vol. 28, no. 4, pp. 2068-2080, 2013.
462
[10] H. Mamur, R. Ahiska, “Application of a DC–DC boost converter with maximum power point tracking
463
for low power thermoelectric generators,” Energy Conversion and Management, vol. 97, pp. 265-272,
464
2015.
[11] I. Laird, D.D.C. Lu, “Steady state reliability of maximum power point tracking algorithms used with a
466
thermoelectric generator,” in 2013 IEEE International Symposium on Circuits and Systems (ISCAS), pp.
467
1316-1319, 2013.
468
[12] C.-J. Huang, W.-C. Chen, C.-L. Ni, K.-H. Chen, C.-C. Lu, Y.-H. Chu, M.-C. Kuo, “Thermoelectric
469
energy harvesting with 1mV low input voltage and 390nA quiescent current for 99.6% maximum power
470
point tracking,” in 2012 Proceedings of the ESSCIRC (ESSCIRC), pp. 105-108, 2012.
471
[13] J.-P. Im, S.-W. Wang, S.-T. Ryu, G.-H. Cho, “A 40 mV transformer-reuse self-startup boost converter
472
with MPPT control for thermoelectric energy harvesting,” IEEE Journal of Solid-State Circuits, vol. 47,
473
no. 12, pp. 3055-3067, 2012.
474
[14] J. Kim, C. Kim, “A DC-DC boost converter with variation-tolerant MPPT technique and efficient ZCS
475
circuit for thermoelectric energy harvesting applications,” IEEE Transactions on Power Electronics, vol.
476
28, no. 8, pp. 3827-3833, 2013.
477
[15] I. Laird, D. D. C. Lu, “High step-up DC/DC topology and MPPT algorithm for use with a thermoelectric
478
generator,” IEEE Transactions on Power Electronics, vol. 28, no. 7, pp. 3147-3157, 2013.
479
[16] H. Yamada, K. Kimura, T. Hanamoto, T. Ishiyama, T. Sakaguchi, T. Takahashi, “A MPPT control
480
method of thermoelectric power generation with single sensor,” in 2013 IEEE 10th International
481
Conference on Power Electronics and Drive Systems (PEDS), pp. 936-941, 2013.
482
[17] S. Bandyopadhyay, A. P. Chandrakasan, “Platform architecture for solar, thermal, and vibration energy
483
combining with MPPT and single inductor,” IEEE Journal of Solid-State Circuits, vol. 47, no. 9, pp.
484
2199-2215, 2012.
485
[18] Y. K. Ramadass, A. P. Chandrakasan, “A battery-less thermoelectric energy harvesting interface circuit
486
with 35 mV startup voltage,” IEEE Journal of Solid-State Circuits, vol. 46, no. 1, pp. 333-341, 2011.
487
[19] N. Phillip, O. Maganga, K. J. Burnham, M. A. Ellis, S. Robinson, J. Dunn, C. Rouaud, “Investigation of
488
maximum power point tracking for thermoelectric generators,” Journal of Electronic Materials, vol. 42,
489
no. 7, pp. 1900-1906, 2013.
[20] E. Brownell, M. Hodes, “Optimal Design of Thermoelectric Generators Embedded in a Thermal
491
Resistance Network,” IEEE Transactions on Components, Packaging and Manufacturing Technology,
492
vol. 4, no. 4, pp. 612-621, 2014.
493
[21] S. Dalola, M. Ferrari, V. Ferrari, M. Guizzetti, D. Marioli and A. Taroni, “Characterization of
494
thermoelectric modules for powering autonomous sensors,” IEEE Transactions on Instrumentation and
495
Measurement, vol. 58, no 1, pp. 99-107, 2009.
496
[22] N. Mohan, T. M. Undeland and W. P. Robbins, Power Electronics: Converters, Applications, and
497
Design, 3rd ed. New York, NY, USA: Wiley, 2002.
498
[23] P.-S. Weng, H.-Y. Tang, P.-C. Ku, L.-H.Lu, “50 mV-input batteryless boost converter for thermal energy
499
harvesting,” IEEE Journal of Solid-State Circuits, vol. 48, no. 4, pp. 1031-1041, 2013.
500
[24] C. Mo, J. Davidson, “Energy harvesting technologies for structural health monitoring applications,” in
501
2013 1stIEEE Conference on Technologies for Sustainability (SusTech), pp. 192-198, 2013.
502
[25] A. Montecucco, A. R. Knox, “Maximum Power Point Tracking Converter Based on the Open-Circuit
503
Voltage Method for Thermoelectric Generators,” IEEE Transactions on Power Electronics, vol. 30, no. 2,
504
pp. 828-839, 2015.