ORIGINAL PAPER
Isolation and linkage mapping of NBS-LRR resistance gene
analogs in red raspberry (
Rubus idaeus
L.) and classification
among 270 Rosaceae NBS-LRR genes
Suren K. Samuelian&Angela M. Baldo&Jeremy A. Pattison&Courtney A. Weber
Received: 7 January 2008 / Revised: 4 March 2008 / Accepted: 4 April 2008 / Published online: 10 June 2008 #Springer-Verlag 2008
Abstract PlantRgenes confer resistance to pathogens in a gene-for-gene mode. Seventy-five putative resistance gene analogs (RGAs) containing conserved domains were cloned
fromRubus idaeusL. cv.‘Latham’using degenerate primers
based on RGAs identified in Rosaceae species. The se-quences were compared to 195 RGA sese-quences identified from five Rosaceae family genera. Multiple sequence alignments showed high similarity at multiple nucleotide-binding site (NBS) motifs with homology to Drosophila Toll and mammalian interleukin-1 receptor (TIR) and non-TIR RNBSA-A motifs. The TIR sequences clustered separately from the non-TIR sequences with a bootstrap value of 76%.
There were 11 clusters each of TIR and non-TIR type sequences of multiple genera with bootstrap values of more than 50%, including nine with values of more than 75% and seven of more than 90%. Polymorphic sequence character-ized amplified region and cleaved amplified polymorphic sequence markers were developed for nine Rubus RGA sequences with eight placed on a red raspberry genetic linkage map. Phylogenetic analysis indicated four of the mapped sequences share sequence similarity to groupTIR I, while three others were spread in non-TIR groups. Of the 75
Rubus RGA sequences analyzed, members were placed in
five TIR groups and six non-TIR groups. These group clas-sifications closely matched those in 12 of 13 studies from which these sequences were derived. The analysis of related DNA sequences within plant families elucidates the evolu-tionary relationship and process involved in pest resistance development in plants. This information will aid in the understanding of R genes and their proliferation within plant genomes.
Keywords Disease resistance . Resistance gene analog
Introduction
Plant resistance to pathogens is often governed by a specific interaction between a pathogenAvr(avirulence) gene locus and an allele of the corresponding plant disease resistance (R) locus (Dangl and Jones 2001). This concept of matching an R gene in the host and an Avr gene in the pathogen is referred to as the gene-for-gene hypothesis (Flor1971). A number of plant genes conferring resistance to various plant pests have been isolated and characterized from a wide range of divergent species (Bent 1996; Hammond-Kosack and Jones 1997). Their products share
DOI 10.1007/s11295-008-0160-2
Communicated by: J. Davis
Electronic supplementary material The online version of this article (doi:10.1007/s11295-008-0160-2) contains supplementary material, which is available to authorized users.
S. K. Samuelian
:
A. M. Baldo:
J. A. Pattison:
C. A. Weber (*) New York State Agricultural Experiment Station,Cornell University, 630 West North St., Geneva, NY 14456, USA
e-mail: [email protected] S. K. Samuelian
Center for Viticulture and Small Fruit Research, Florida A&M University,
6505 Mahan Drive, Tallahassee FL 32317, USA
A. M. Baldo
USDA-ARS Plant Genetic Resources Unit, 630 W. North St., Geneva, NY 14456, USA
Present address:
J. A. Pattison
Virginia Polytechnic Institute and State University, Southern Piedmont AREC, 2375 Darvills Road, Blackstone, VA 23824, USA
striking structural similarities (Jones1996), which led to the hypothesis that certain signaling events commonly occur during plant defense (Baker et al. 1997). Several R gene classes have been identified on the basis of specific conserved functional domains. The most common belong to the leucine-rich repeat (LRR) family encoding proteins that contain an LRR domain near the C terminus. The LRR domain is highly variable in length and is thought to be involved in the recognition of the invading pathogen and/or the biochemical signals it produces. In addition to the LRR domain, the majority of the plant diseaseRgenes cloned to date (approximately 70%) also encode a putative tripartite nucleotide-binding site (NBS) near the N terminus. The NBS region is characterized by the presence of several highly conserved domains regardless of the diversity of pathogens against which they act. The P-loop (kinase-1a) and the kinase-2 domains are found in both adenosine-triphosphate- and guanosine-adenosine-triphosphate-binding proteins (Saraste et al.1990), while additional motifs found in the NBS region are the kinase-3a and the Gly-Leu-Pro-Leu (GLPL, also known as“hydrophobic domain”), a putative membrane spanning domain. NBS-LRR genes have also been shown to possess additional domains at their N terminus. A cytoplasmic signaling domain has been identified in several plant resistance genes that shares homology to the Drosophila Toll protein and the mamma-lian interleukin-1 receptor protein (TIF; Hammond-Kosack and Jones1997). This motif has been given the acronym TIR and is speculated to be involved in cell signaling. Most of the non-TIR NBS-LRRR genes have been reported to contain a coiled-coil motif or a leucine zipper motif proposed to facilitate protein interactions (Pan et al.2000). Previous approaches for identifying candidate genes controlling resistance against different pathogens have used highly saturated genetic maps for map-based cloning. The markers used for such maps generated polymorphic data based on restriction sites (restriction fragment length polymorphism [RFLP] and amplified fragment length polymorphism [AFLP]), random sequences (random am-plified polymorphic DNA [RAPD]), and repetitive elements (simple sequence repeats). Such markers may not represent the segregating gene, and the likelihood of identifying a marker linked to the target gene is a function of the distribution of the marker type and location of the gene in the genome.
The conserved backbone of both TIR and non-TIR NBS-LRR-class proteins has led to the development of polymer-ase chain reaction (PCR)-bpolymer-ased strategies for isolating putative resistance gene analogs (RGAs). By the use of degenerate and/or specific primers targeted to the particular conserved amino acids in the NBS motifs at low annealing temperatures (35°C to 55°C), a remarkable number of RGA sequences have been identified from many plant species
including soybean [Glycine max (L.) Merr.] (Kanazin et al. 1996; Yu et al. 1996), potato (Solanum tuberosum L.; Leister et al.1996), barley (Hordeum vulgareL.) and rice
(Oryza sativaL.; Leister et al.1998),Arabidopsis thaliana
(L.) Heynh. (Aarts et al. 1998), pea (Pisum sativum L.; Timmerman-Vaughan et al. 2000), grape (Vitis vinifera L.; Donald et al. 2002; Gaspero and Cipriani 2002), cotton
(Gossypium spp.; Tan et al. 2003), tomato (Lycopersicum
esculentum L.; Zhang et al. 2003), apple (Malus ×
domestica Borkh.; Baldi et al. 2004), and chestnut rose
(Rosa roxburghii Tratt.; Xu et al. 2005). NBS sequences
tend to be clustered in the genome, and isolated RGAs are frequently located at or near previously identified resistance loci or might even be parts of known R genes (Kanazin et al.1996; Yu et al.1996; Aarts et al.1998; Collins et al. 1998; Donald et al. 2002). Thus, molecular markers generated through this approach are useful to saturate regions of the genome where clusters of resistance genes are located and facilitate their map-based cloning.
Phytophthoraspecies cause billions of dollars in annual
losses to agricultural and forest species in the USA and worldwide (Erwin and Ribeiro 1996). Phytophthora root rot (PRR) of red raspberry is an economically important disease in nearly all temperate regions. The causal agent
P. fragariae var.rubi Wilcox and Duncan (referred earlier
as P. erythroseptica, P. erythroseptica var. erythroseptica,
P. megasperma “type 2”, and P. fragariae; Wilcox et al.
1999) is subterranean, soil persistent, and polycyclic. It is capable of rapidly spreading within the plant to cause severe root and crown rot in the absence of suppressing measures. Host resistance is the most effective control practice from both the environmental and economic perspective. Cultivars with known resistance include
‘Latham’, ‘Newburgh’, ‘Durham’, and ‘Chief’, while moderate resistance has been observed in‘Taylor’,‘Haida’,
‘Chilcotin’, and others (Barritt et al. 1979). Susceptible cultivars include ‘Titan’, ‘Canby’, ‘Willamette’, and
‘Skeena’ (Barritt et al. 1979; Wilcox et al. 1999). Unfortunately, many resistant cultivars are not commer-cially accepted in contrast to many moderately resistant and susceptible cultivars because of fruit quality requirements.
Analysis of the distributional extremes and quantitative trait loci (QTL) mapping of a backcross population (B1)
[(‘Titan’בLatham’) בTitan’] using RAPD, AFLP, CAPS, and SCAR markers revealed two major genomic regions associated with PRR resistance in red raspberry (Pattison et al.2007). A collection of RGA sequences from red rasp-berry would be an effective tool for the characterization of these regions and other disease-related genes (Leister et al. 1996, 1998; Yu et al. 1996). This study reports the identification and characterization of 75 RGAs developed through the use of degenerate primers designed to bind the P-loop, kinase-2, and the GLPL elements of the NBS
region. Multiple and diverse RGAs are shown to exist in the red raspberry genome, and eight RGAs were mapped using a linkage map developed from the red raspberry cultivars
‘Titan’and‘Latham’. To classify theRubusgene fragments identified in this study, NBS-LRR sequences from Rosa-ceae that were publicly available were collected and analyzed. This allowed placement of theRubussequences in context with others identified within this plant family.
Materials and methods
Plant material, PCR amplification of RGA sequences
NBS-LRR sequences that had been previously identified in Rosaceae species and entered into GenBank were analyzed for the purpose of identifying suitable primers for the amplification of RGAs in red raspberry (Table 1). Seven degenerate primers from species in this family were utilized in this study (1) P-loop: 5′-GAATTCGGNGTNGGNAA GACAAC-3′(forward; Shen et al.1998); (2) BP2f: 5′-GGN GGDGTDGGSAARAC-3′ (forward; Baldi et al. 2004); (3) BP2r: 5′-GCTAGTGGCAMNCCWCC-3′ (reverse; Baldi et al.2004); (4) OLE 1121: 5′-GGWATGGGWGGW RTHGGWAARACHAC-3′ (forward; Lee et al. 2003);
(5) OLE 1122: 5′
-ARNWYYTTVARDGCVARWGG-VARWCC-3′ (reverse; Lee et al. 2003); (6) DegRos_f: 5′-MDTKSBDR RRSSBDTTTWHRMM-3′(forward); (7)
DegRos_r: 5′- RKDYWYDHMWHRDWKBWBMWK- 3′
(reverse). Primers DegRos_f and DegRos_r were designed during the course of this study.
Genomic DNA from newly expanded leaves from the resistant cultivar‘Latham’was extracted for RGA amplifi-cation using the cetyl trimethylammonium bromide method as described by Pattison et al. (2007). PCRs were carried out in a total volume of 50μl with a 100-ng template DNA and 0.4 μM of each primer in 49.3 mM Tris–HCl (pH=8.3),
2.5 mM MgCl2, 1 mM tartrazine, 1.5% Ficoll, 125 μM
deoxynucleotide triphosphates, and 0.5 UTaqpolymerase. PCRs were performed in a MJ Research PTC-100 thermo-cycler (Watertown, MA, USA) including initial denatur-ation for 2 min at 94°C followed by 40 cycles of 1 min at 94°C, 1 min at 50°C, 2 min at 72°C, and a final extension at 72°C for 5 min. Amplified DNA fragments were separated on a 2% TAE agarose gel and visualized by ethidium bromide staining.
Cloning and sequence analysis
DNA bands generated from the PCR reactions were excised from the gels and the DNA retrieved with a Sephaglas BandPrep Kit (Amersham Biosciences, Piscataway, NJ, USA) following the manufacturer’s instructions. The eluted fragments were cloned using the pGEM-T Vector System (Promega, Madison, WI, USA). Recombinant plasmids were extracted with the QIAprep Spin Miniprep kit (Qiagen, Hilden, Germany), and the DNA was sequenced at the Cornell Sequencing Biotechnology Resource Center (Cornell University, Ithaca, NY, USA).
DNA and amino acid sequences were analyzed with the Laser Gene software package (DNASTAR, Madison, WI, USA) and the GeneDoc software, version 2.5.000 (www.psc.edu/biomed/genedoc). DNA similarity (basic local alignment search tool [BLAST]) searches were performed against nucleotide and protein sequence data-bases at the National Center for Biotechnology Information (NCBI:http://www.ncbi.nlm.nih.gov; Rehm2001). Nucleo-tide sequences were conceptually translated using sequence utilities at the Baylor College of Medicine Search Launcher (http://searchlauncher.bcm.tmc.edu; Smith et al. 1996). In nine cases, amino acid frames were interrupted by one or two mis- or non-sense mutations. Correction to the original frame was done based on related published NBS-LRR amino acid sequences for the following nine
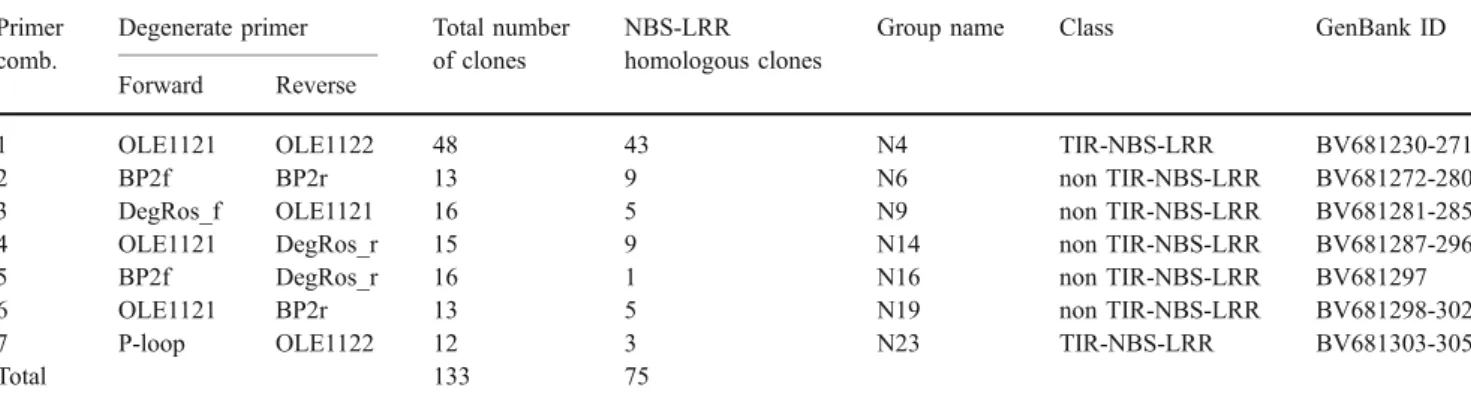
Table 1 Clones generated with the degenerate primers used for amplification of RGA sequences in red raspberry and number of fragments revealing homology to publicly available NBS-LRR sequences
Primer comb.
Degenerate primer Total number
of clones
NBS-LRR homologous clones
Group name Class GenBank ID
Forward Reverse
1 OLE1121 OLE1122 48 43 N4 TIR-NBS-LRR BV681230-271
2 BP2f BP2r 13 9 N6 non TIR-NBS-LRR BV681272-280
3 DegRos_f OLE1121 16 5 N9 non TIR-NBS-LRR BV681281-285
4 OLE1121 DegRos_r 15 9 N14 non TIR-NBS-LRR BV681287-296
5 BP2f DegRos_r 16 1 N16 non TIR-NBS-LRR BV681297
6 OLE1121 BP2r 13 5 N19 non TIR-NBS-LRR BV681298-302
7 P-loop OLE1122 12 3 N23 TIR-NBS-LRR BV681303-305
sequences: 15_Ri_19-7, 20_Ri_4-1, 23_Ri_4-12, 34_Ri_4-23, 46_Ri_4-40, 49_Ri_4-53, 50_Ri_4-54, 65_Ri_6-31, and 72_Ri_9-11 (Supplemental TableS1).
All public NBS-LRR amino acid fragments from Rosaceae available at the time of analysis were downloaded from the NCBI GenBank (http://www.ncbi.nlm.nih.gov; Supplemental Table S1). These sequences were aligned together with the conceptually translated Rubus fragments generated in this study, using hidden Markov models with the Sequence Alignment and Modeling Software System (SAM-T2K; Karplus et al.1998) and formatted for analysis with the Phylip phylogenetic inference package (Supple-mental File “Samuelian et al Rosa NBS-LRR S2.phy”). Seqboot in the Phylip package (Felsenstein2006) was used to generate 1,000 bootstraps of the dataset, and Protdist was used to construct 1,000 bootstrapping distance matrices using the Jones–Taylor–Thornton calculation, with one category of substitution rates. A neighbor-joining tree of the 1,000 bootstraps was constructed (jumbling the se-quence input order twice) and a majority-rule consensus tree determined.
Marker development and RGAs mapping
Primers specific to the cloned raspberry RGA sequences were designed utilizing a manual analysis of the clone sequences to develop PCR-based markers for genetic mapping. Three criteria were followed for primer design: (1) 50–70% guanine–cytosine (GC) content, (2) predomi-nant GC content at the 3′end, and (3) a primer length of 20 to 24 bp to ensure similar melting temperatures (Table2). The oligonucleotides were synthesized by MWG-Biotech (High Point, NC, USA). Each primer pair was tested with genomic DNA from ‘Titan’, ‘Latham’, and the F1 parent
from the previously mapped B1population (Pattison et al.
2007) to identify polymorphisms. Amplification was
performed under the same conditions already described, only with an annealing temperature of 62 °C instead of 50 °C. Markers generated using this technique are referred to as sequence characterized amplified regions (SCARs; Paran and Michelmore1993). When a polymorphism between the parents was not identified based on primer site annealing, a restriction digestion was performed using 20 μl of each PCR reaction to identify sequence differences resulting in restriction site polymorphisms. Polymorphisms identified through PCR amplification with specific primers followed by restriction digestion are referred as to cleaved amplified polymorphic sequence (CAPS) markers (Konieczny and Ausubel 1993). PCR products and their digestions were visualized on 3% MetaPhor agarose gels (Cambrex, Rockland, ME, USA) stained with ethidium bromide. The specific primers for the development of the SCARs and the specific primers together with the restriction enzymes used for the development of the CAPS markers are shown in Table2.
Mapping of markers derived from RGAs was performed using 68 individuals from a B1 population previously
screened for PRR resistance (Pattison et al. 2007). Identified polymorphisms were mapped using JoinMap 3.0® (Van Oijen and Voorrips 2001) with linkage groups assigned at a minimum logarithm of the odds of 3.0.
Results
Cloning of RGAs and sequence analysis
All 12 possible primer combinations between the forward and reverse primers described were investigated. From each primer combination, approximately 15 clones were sequenced. Searches of the GenBank database using the BLASTN and the BLASTX algorithms showed that clones generated with seven of the primer combinations revealed homology to
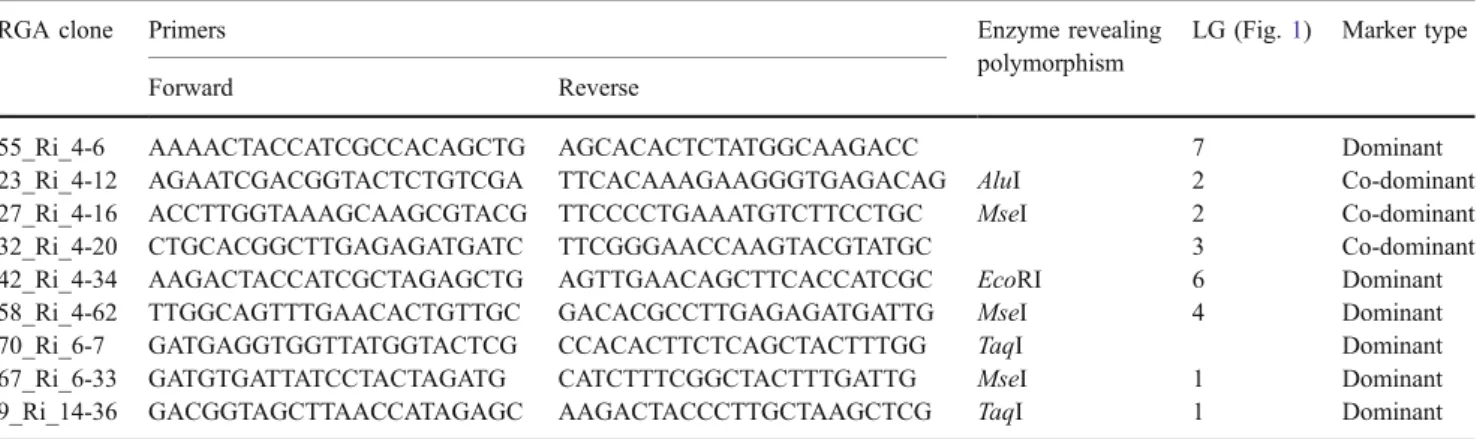
Table 2 Specific primers based on cloned RGA sequences from‘Latham’red raspberry that generated polymorphic SCAR and CAPS markers in a (‘Titan בLatham’) בTitan’B1red raspberry population with the corresponding restriction enzyme for the CAPS markers
RGA clone Primers Enzyme revealing
polymorphism
LG (Fig.1) Marker type
Forward Reverse
55_Ri_4-6 AAAACTACCATCGCCACAGCTG AGCACACTCTATGGCAAGACC 7 Dominant
23_Ri_4-12 AGAATCGACGGTACTCTGTCGA TTCACAAAGAAGGGTGAGACAG AluI 2 Co-dominant
27_Ri_4-16 ACCTTGGTAAAGCAAGCGTACG TTCCCCTGAAATGTCTTCCTGC MseI 2 Co-dominant
32_Ri_4-20 CTGCACGGCTTGAGAGATGATC TTCGGGAACCAAGTACGTATGC 3 Co-dominant
42_Ri_4-34 AAGACTACCATCGCTAGAGCTG AGTTGAACAGCTTCACCATCGC EcoRI 6 Dominant
58_Ri_4-62 TTGGCAGTTTGAACACTGTTGC GACACGCCTTGAGAGATGATTG MseI 4 Dominant
70_Ri_6-7 GATGAGGTGGTTATGGTACTCG CCACACTTCTCAGCTACTTTGG TaqI Dominant
67_Ri_6-33 GATGTGATTATCCTACTAGATG CATCTTTCGGCTACTTTGATTG MseI 1 Dominant
NBS-LRR sequences (Table1). Fragments cloned from the remaining five primer combinations did not reveal homology to NBS-LRR sequences and were excluded from further analysis. Approximately 93% of the clones generated with primer pair OLE1121/OLE1122 showed strong overlapping similarity to RGA sequences. Therefore, an additional set of 33 clones from that group was sequenced bringing the total number of clones analyzed for NBS-LRR homologies to 133 (Table1). BLASTX searches of the SwissProt and GenBank NR databases revealed that 62 of them were highly homologous to house-keeping genes or did not show homology to any sequences in the database and were excluded from further analysis. The remaining 75 sequences with sizes between 197 and 702 bp were highly similar to RGA sequences cloned from other plant species using similar PCR-based approaches.
Marker development and linkage mapping
Specific primers were designed for each RGA sequence (Table 2) to identify polymorphic markers that could be placed on a red raspberry genetic linkage map (Pattison et al.2007). The map was developed using a segregating B1
population that was screened for resistance to P. fragariae
var. rubi and was analyzed for QTL associated with resistance (Pattison et al. 2007). When genomic DNA of
‘Titan’,‘Latham’, and F1parent of the mapping population
were amplified, a dominant presence/absence polymor-phism was revealed for two RGAs, 55_Ri_4-6 and 32_Ri_4-20 (Table 2). A single band of the expected size was observed for all other RGA fragments. To identify polymorphisms in the monomorphic products, a set of restriction enzymes (mainly four basepair cutters) was
LG3
XLRRr+NLRRr250 E16M48 _144 5 32_Ri_4-20 9 E14M76 _268 1 E17M66 _224 3 E14M76 _102 3 27_Ri_4-16 3 E16M68 _220 4 E17M51 _160 E16M48 _097 4 E17P18 _326 E17M51 _197 4 BC2610950 E16P18 _307 4 BC2960250 5 23_Ri_4-12 5 BC3291200 5 BC3831400 5 E16M48 _088 6LG2
E17M65_293 2 E16M49_254 2 BC264200 3 67_Ri_6-33 E16M67_098 3 E17M75_155 3 E14M66_224 3 E16M75 _261 E16M67 _250 4 XLRRr+NLRRr650 E17M66 _120 5 BC6151050 E16M49 _265 5 9_Ri_14-36 BC6481300 5 BC618100 6 E16M59 _106 E16P18_369 6 E17M66 _195 6 BC610090 7 pdi pl rrsLG1
BC2650650 E16M68_290 5 XLRRf+AS1700 5 E17P15 _267 6 58_Ri_4-62 6LG4
E17M51 _145 E17M51 _124 PTOK2+RLRRf200 1 E16M68 _211 2 42_Ri_4-34 2 BC0250900 3 BC2850700 BC5710750 BC2641050 3LG6
E16M67 _310 2 PTOK2+AS1900 2 BC296100 3 E17M65 _235 E17M48 _117 3 55_Ri_4-6 E17M47 _078 3LG7
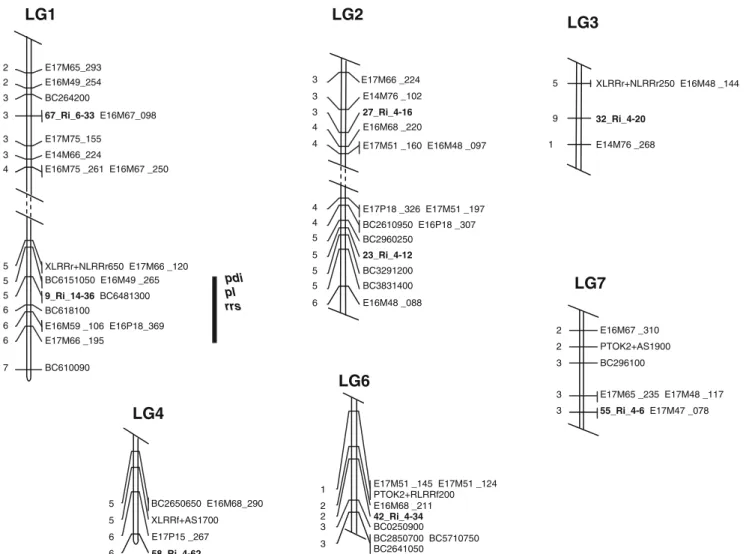
Fig. 1 Genetic linkage map showing the position of the RGA loci (in bold letters) on red raspberry linkage groups. Mapping was done on a (‘Titan’בLatham’) בTitan’B1population. Relative locations
of putative QTLs for plant disease index (pdi), petiole lesion (pl), and
root regeneration score (rrs) are shown asvertical bars on the right of the linkage groupand were assigned by Pattison et al. (2007). The marker distances are indicated in centimolar calculated in Kosambi units (Lander et al. 1987)
utilized to detect restriction site polymorphisms. Poly-morphisms were identified in seven of the RGAs, thus allowing the development of CAPS markers. These markers were screened in the mapping population for placement on the map. The RGA markers were present on six of the seven linkage groups in red raspberry with no clustering seen (Fig.1). The RGA fragment 9_Ri_14-36 was mapped on LG1 within the first putative QTL for PRR resistance (Pattison et al.2007; Fig. 1), and 67_Ri_6-33 was mapped elsewhere on the same linkage group. No NBS-LRR loci were placed on LG5 where the second major QTL for PRR was positioned. Two sequences, 23_Ri_4-12 and 27_Ri_4-16, were mapped on LG2, and the remaining four sequences 32_Ri_4-20, 58_Ri_4-62, 42_Ri_4-34, and 55_Ri_4-6 on linkage groups 3, 4, 6, and 7, respectively (Fig.1). Marker 70_Ri_6-7 could not be placed on the genetic linkage map.
Classification of Rosaceae RGAs
Additional published NBS-LRR protein fragments from other Rosaceae were downloaded from GenBank, concep-tually translated, and aligned with the 75Rubussequences obtained in this study. These include 16Fragaria(Martinez Zamora et al. 2004), 76Malus(Lee et al.2003; Lee and Lee 2003,2006; Baldi et al. 2004; Varshochi2006), 8 Prunus
(Lalli et al.2005; Liang et al.2005), 11Pyrus(Afunian et al. 2006), and 78 Rosa (Hattendorf 2005; Hattendorf and Debener 2007; Xu et al. 2005). Six additional Prunus
consensus NBS-LRR fragments representing sequences that have not been deposited in the public domain were added (Soriano et al. 2005; Supplemental Table S1). Sequences from some related studies for peach (Liang et al.2005) and apple (Calenge et al.2005) were not available.
P-loop RNBS-A-TIR --- ---
20_Ri_4-1 GMGGVGKTTLAKLVFERISHHHFEVSK-FLVNVREVSAKHG--TVVDLQKQLLSPILKEN
34_Ri_4-23 GMGGVGKTTLAKVVFERIS-HHFEVSK-FLVNVSEVSAKHG--TLVELQKQLLSPILKKN
17_Ri_23-1 EFG-VGKTTLARLIFERIS-HHFEVSN-FLLNVREVSAKHG--SLVDLQKQLLSPILKEN
57_Ri_4-61 GMGGIGKTTLAKVLFDGIS-HQFEFSS-FVSYVRN-NEEKS--GLVHLQETLISRILG-K
16_Ri_19-9 GMGGIGKTTVAKALYNKFCH-SFEASS-FLADVRETMQK-D--GKVSLQESLLSDISKTT
44_Ri_4-37 GMGGVGKTTIAKFVYNSNFQ-RFERCSSFLENIREVSEQSN--GLLKLQKQLLNDILTGR
60_Ri_4-8_ GMGGVGKTTIAKFVYNSNFQ-SFERYS-YLENIREVSEQPN--GLLRLQKQLLNDILTGS
21_Ri_4-10 GMGGIGKTTIAKFVYNSNYE-KFERCS-FLENIREVSEQAN--GLVQLQKQLLYDILNGK
19_Ri_23-9 -EFGVGKTTIAKVVYNSNFR-RFEASS-FLENIREISENPN--GLVQLQRQLLADILN-R
36_Ri_4-25 --GGIGKTTIAKVVYNSNFR-RFEASS-FLENVREISENPN--GLVQLQRQFISDILN-R
29_Ri_4-18 GMGGVGKTTIAKVVYNSNFR-RFEASS-FLENIREISENPN--GLVQLQRQLLADILN-R
61_Ri_4-9 GMGGVGKTTLAQCFVDKMAN-QYDATS-FLNNVREVSAERHGTGIVTLQEKLLSDAQMG-
18_Ri_23-6 EFG-VGKTTIARAVYGKIHQ-QFEHFC-FLDNVKEEFLTKH---KVTEALLSKILKVN
45_Ri_4-4 GMGGIGKTTIARAVYGKIHQ-QFEHFC-FLDNVKEEFLTKN---KVTEALLSKILKVN
55_Ri_4-6 GMGGVGKTTIATAVYNKIEG-QFDHCC-FLENIKDRFRATNG--DIHTLEELLSRMLKEE
39_Ri_4-29 ---TTIARAVYDQLVC-QFEHHC-FLENVKEGFKNNG---AIHMQEELLSRIFDKR
22_Ri_4-11 GMGGVGKTTIAKAVYDEIAY-QFDHCC-FLDNVKEGFTEKG---EAEMQEELLSRILNEK
56_Ri_4-60 GMGGIGKTTIAKAVYDEIAY-QFDHCC-FLDNVKEGFTEKG---EAEMQEELLSRILNEK
31_Ri_4-2 GMGGIGKTTIAKAVYDEIAC-EFDHCC-FLDDVKEGFTKKG---KTQIQEDLLSRILKEK
35_Ri_4-24 GMGGVGKTTIAKAVYDEIAC-QFDHYC-FLDDVKEGFTKKG---KAQILEDFLSRILKKK
43_Ri_4-36 GMGGVGKTTIAKAVFDEIAC-QFDHCC-FLENVKEGFT-KD---KAQIQEDLLSRILKDK
48_Ri_4-5 GMGGVGKTTIAKAVFDEIAC-QFDHCC-FLENVKEGFT-KD---KAQIQEDLLSRILKDK
54_Ri_4-59 GMGGVGKTTIAKAVFDEIAC-QFDHCC-FLENVKEGFT-KD---KAQIQENLLSRILKDK
41_Ri_4-33 GMGGVGKTTIAKAFYDEIAY-QFNHCC-FLDDVKEVFTKRD---KAQIQEDLISRILKEK
37_Ri_4-26 GMGGVGKTTIARAVYDEIAC-QFQHSC-FLDNVKEGFAKKG---EAQMKEELLSTILREK
38_Ri_4-28 GMGGVGKTTIARAVYEKLAC-QFEHYC-FLDNVKEGFTKKG---GIQMQEELLCRILMEK
42_Ri_4-34 GMGGVGKTTIARAVYEKLAC-QFEHYC-FLDNVKEGFTKKG---GIQMQEELLCRILMEK
47_Ri_4-41 GMGGVGKTTIARAVYEKIAC-QFEHCC-FLDNVKEGFTKKG---GIQMQEELLCRILMEK
23_Ri_4-12 GMGGIGKTTVARAVYDKIAC-QFEG---FLENVKEGFTKKG---ETEMRKELLSRILTVP
46_Ri_4-40 GMGGVGKTTVARAVYDKIAC-QFEYHC-FLENVKEGFTKKG---ETEMRKELLSRILTVQ
40_Ri_4-3 GMGGVGKTTIASVVYDEIAS-QFEYHC-FLENVKEGFTKKG---ETQMQKDLLSRILTEK
52_Ri_4-57 GMGGIGKTTIASAFYDKMAC-QFEYCC-FLENITGGFTKKG---ETQMRKELLSRIYSDK
32_Ri_4-20 GMGGIGKTTIATEVYDEIRS-QFSHCY-FLPNVKEGFGNQV---RMQEQLLSGILKKE
49_Ri_4-53 GMGGIGKTTIAKAVYDKIAY-QFVHKC-FLGDVKEGFAKKG---EAQMRGEFLSEILKDK
50_Ri_4-54 GMGGVGKTTIARAVYGKIAY-QFEHKC-FLGDVKEGFAKKG---EAQMRGEFLSEILKDK
58_Ri_4-62 GMGGVGKTTIAKAVYDEIAW-QFEHCC-FLVNVKEAFANKR---EVQLQEELLSRMLKEK
28_Ri_4-17 GMGGVGKTTITRAVYDEIAC-QFEHVC-FLDHVDYHFVNKR---EVKLQEKLLSGLLKDK
33_Ri_4-22 GMGGAGKTTIARAVYDKWSR-KFEACC-FLENVRKRSS---IVQMQEELLFRILKEK
Fig. 2 Alignment of conceptually translated
RubusTIR sequences. The RNBS-A-TIR motif is charac-teristic of plant TIR-NBS-LRR RGAs. Identical residues with 50% or greater frequency in a column have adark grey background. Similar residues with 50% or greater frequency have a
Multiple alignments showed that the similarity was especially high at various NBS motifs: P-loop, kinase-2, RNBS-B, and GLPL. The TIR and non-TIR RNBS-A motifs are clearly visible (Figs.2and3). The full alignment of all 270 amino acid sequences is available in format suitable for input to Phylip as supplemental data (Supple-mental File “Samuelian et al Rosa NBS-LRR S2.phy”).
Amino acid distances between the Rubus RGA fragments and those from other Rosaceae ranged from 0.1303 to 9.5287. Among the entire dataset, the range of amino acid distances was 0.0058 to 9.2587.
The resulting neighbor-joining tree displays well-sup-ported classification of the Rosaceae NBS-LRR sequences both between TIR and non-TIR and within each category. The
Kinase-2 RNBS-B --- ---
20_Ri_4-1 -IAQVWDEQEGTLFIRKCLFNKKVLLVVDNVDHYNQLE-ILVGNKSWFGKGSRVIITTRE
34_Ri_4-23 -IAQVWDEQEGTLFIRNCLFNKKVLLIVDNVDHDKQLE-ILVGDKSWFGEGSRVIITTRD
17_Ri_23-1 -IAQVWNEQEGTLFIKNFFFNKKALIVVDDVDHYNQLA-ILVGNRSWFGEGSRIIITTRD
57_Ri_4-61 -ETKICDIHEGATMIKRLLHHKKVLLILDDVNQWRQLE-YLAGKQDWFGFGSIIIITTRD
16_Ri_19-9 -RTKVGHVDRGINVIKNRLGCRRVFVVIDDVDQVEQLE-ALAIDRDSFGPGSRIPITTRD
44_Ri_4-37 -KVKIHNISEGIAKIEDAVSSRRVFLVLDDVDHVDQLA-ALLRMQNRFHPGSKIIITSSC
60_Ri_4-8_ -KVKIHSISEGIAKIENAVSSRRVFLVLDDVDHVDQLA-ALLRMQNRFYPGSKIIITSSC
21_Ri_4-10 -KVEIHSISEGIAKIEDVVSSKRVLLVLDDVDHVDQLD-ALLRIQDRLYPGSKIIITTSC
19_Ri_23-9 -KVRVHSVSQGTSKIKDVVSSKKVLLVLDDVIHKDQFD-AILEMKSGFRAGSKIIITTRD
36_Ri_4-25 -KVKVHSVSQGTSKIKDVISSKKVLLVLDDVIHKDQFD-AILEMKSGFRAGSKIIITTRD
29_Ri_4-18 -KVKVHSVSQGTSKIKDVVSSKKVLLVLDDVIHKDQFD-AILEMKSNFKAGSKIIITTRD
61_Ri_4-9 TGTKKLDVYKGMNEIKHRLSHKKVLIVIDDVDHIKQLE-ALVGSHEWFGRGSRIIITTRN
18_Ri_23-6 DRHI--LDGGLN-MMQ---
45_Ri_4-4 DRHI--LDGGLN-MIRERLGKKKVLIVLDDVDNLDQIET---
55_Ri_4-6 RRILGTLDKGLN-MIRKKLGKKKVVLVLDDVDNLDQIEALIGKKPS-FGGGSRIIITTRD
39_Ri_4-29 VCSLGTLSRGSK-IIMERLSKKKVLLVLDDVENFAQIEALLGKQYS-FGSGSRIVVTTRD
22_Ri_4-11 VPSTGSLNRGFN-MIMKRLGKKKVLLVLDDLDDIAQFEILLGDQPS-FGGGSRIILTTRD
56_Ri_4-60 VPSTGSLNRGFN-MIMKRLGKKKVLLVLDDLDDIAQFEILLGDQPS-FGGGSKIILTTRD
31_Ri_4-2 VPSTGILNRGSN-MIMERLGKKKVLLVLDDLDDIAQIETLLGEKPS-FGGGSRIILTTRY
35_Ri_4-24 VPSTGILNRGSN-MIMKSLGKKKVLLVLDDLDDIAQIETLLGEQHS-FGGGSRIILTTRY
43_Ri_4-36 VPSTGILSRGSI-MIMERLGKKKVLIVLDDLDNIAQIETLLGDPYS-FGGGSRIILTTRY
48_Ri_4-5 VPSTGILSRGSI-MIMERLGKKKVLIVLDDLDNIAQIETLLGDPYS-FGGGSRIILTTRY
54_Ri_4-59 VPSTGILSRGSI-MIMERLGKKKVLLVLDDLDNIAQIETLLGDPYS-FGGGSRIILTTRY
41_Ri_4-33 VPSTGILNRGFK-MIMERLGKKKVLLVLDDLDDIAQFETLLGEQPS-FGGGSRIILTTRY
37_Ri_4-26 VRST-RLKRGST-MIMERLGKKKVLLVLDDVDDISQIESLLGKQLA-FGGGSRIIITTRD
38_Ri_4-28 VPTVGTLNRGSN-MIMERLGKKKVLIVLDDVDDVAQIEFLLGKEHS-FGGGSRIILTTRD
42_Ri_4-34 VPTVGTLNRGSN-MIMERLGKKKVLIVLDDVDDVAQIEFLLGKEHS-FGGGSRIILTTRD
47_Ri_4-41 VPTVGTLNRGSN-MIMERLGKKKVLIVLDDVDDVAQIEFLLGKEHS-FGGGSRIILTTRD
23_Ri_4-12 SVYRDSMKEVIQGKKKVKLGTKKVLLVLDDVDDIAQIDALLGLL---LIIATRD
46_Ri_4-40 SVYRDSMKEVIQGKKKVKLGTKKVLLVLDDVDDIAQIDALLGLLYS-FGGGSRLIITTRD
40_Ri_4-3 VHSVGTLNRGSN-MIMENLGKKKVLLVLDDVDDIAQIETLLGHQYS-FGGGSRIIVTTRD
52_Ri_4-57 VQNVGTLNRCSN-MIMENLGKKKVLLVLDNVDNIAQIETLLGQQYS-FGGGSRIIVTTRD
32_Ri_4-20 VR-IDTLNDGFK--IMKSLSEKKVLVVLDDVDNLDQIEALLGPEPS-FGGESRIIVTTRD
49_Ri_4-53 VQTVGILNEGSN-MTLERLGEKKVLVVLDDVESSAQIEALLGN-LDSFGVGSRIIITTRD
50_Ri_4-54 VQTVGILNEGSN-MIMERLGKKKVLVVLDDVETVAHIRDLLGN-LHSFGVGSRIIITTRN
58_Ri_4-62 VQGLGILSRGWN-MIMERLSKKKILLVLDDVDDVAQIETLLG--KHSFGGGSRIIITTRD
28_Ri_4-17 GK-IECLSRGRN-LIIQKLGKKKVLVVLDDVENPTQIENILGNNQDSFGVGSRIIITTRD
33_Ri_4-22 VQNLGTLSIDSV-LIKEMLSKKKIFVVLDDVDSLDQVEDLLGTRCS-FGNGSKVIITTRD
RNBS-C
---
20_Ri_4-1 ERLLIEHD---IERSF--KVDGLNDSTA-LELFSHNAFRKD--EPREDFSELSNCFVDYV
34_Ri_4-23 ERLLIKHD---IERSF--EVQGLNASTA-LELFSHNAFRKG--EPQEGFSKLSKHFVDYA
17_Ri_23-1 ERLLIEHD---IERSFTVELEGLNASTA-LELFCHNAFRKD--EPPEGFLELSKCFVDYA
57_Ri_4-61 EHLLVKRG---VTRRF--QVQGLHTDEA-LKLFCRKAFKKD--SPEQSYLVLSNRVVNYA
16_Ri_19-9 GHLLKQLG---VDAIYR--AREMNEEEA-LELFSLHAFKAC--CPNEGYLELTRSVVDCC
44_Ri_4-37 AGLLEA-HC-QFVKVHD--VRILDNCES-LALFSWHAFGQD--YPFQSYKDHSNRVVDHC
60_Ri_4-8_ AGLLEA-HC-QFVKVHE--VRILDPSES-LALFSWHAFGQE---PFQSYKDHSNRVVHHC
21_Ri_4-10 VGLFEA-HH-QFVEVHK--VETLSYDES-LALFSWHAFGQD--HPIHSYWDHSKRLIDHC
19_Ri_23-9 AGLLTA-LQ-VVDYVHT--VETLDIKES-LELFSMHAFGQV--HPIESYMEVSKKVMSHC
36_Ri_4-25 AGLLTA-LQ-VVDYVHT--VETLDVKES-LELFSMHAFGQV--HPIESYMEVSKKVMSHC
29_Ri_4-18 AGLLTA-LQ-VVDYVHM--VETLSDNES-LELFSRHAFRQV--HPIKGYTQLSQQVVSHC
61_Ri_4-9 EHLLTTHGVD---VIYE--AQKLRTDEA-LKLFSCKAFKNRNHDDKEKYMVLSDKFVKYT
18_Ri_23-6 --- Fig. 2 (continued)
45_Ri_4-4
---55_Ri_4-6 KHLLA-GY---VMYE--PKLFTDEKA-LELFRQYAFRTK--PPSGNYDGLLGLAIECA
39_Ri_4-29 IQSLSGVN---ARYS--PMFLSDDEA-LELFMQYAFRTN--KPTREYDPLSRRAVEYA
22_Ri_4-11 KQSLSGVEY----QLYN--PKCLSYDKA-HELFMKYAFRTK--KPSGEYDHLSRRAIKYA
56_Ri_4-60 KQSLSGVEY----QLYN--PKCLSYDKA-HELFMKYAFRTK--KPSGEYDHLSRCAIKYA
31_Ri_4-2 IQSLSGVKY----RLYK--LKCLSYYKA-HELFMKYAFRTN--KPSGEYDHLSRRAIKYA
35_Ri_4-24 IQSLSGVEY----RLYM--PTCLSYDKA-HELFMKYAFRTN--KPSGEYVHLSRRAIEYA
43_Ri_4-36 IQSFSGVEY----RLYK--PKCLSYDKA-HKLFMKYAFRTN--KPSGEYDHLPRRAIEYA
48_Ri_4-5 IQSFSGVEY----RLYK--PKCLSYDKA-HKLFMKYAFRRN--KPSGEYNHLPRRAIEYA
54_Ri_4-59 IQSFSGVEY----RLYK--PKCLSYDKA-RKLFMKYAFRTN--KPSGEYNHLPRRAIEYA
41_Ri_4-33 IQSLSRVEY----RLYK--PKCLSYDKA-YELFIKYAFRTN--KPSGEYYHLSRCAIEYA
37_Ri_4-26 IQSLSGVEY----VMYK--PKCLRYSEA-YELFRQYAFRTN--EPSAEFDHLSRCAIEYA
38_Ri_4-28 TQLLRRVD---QIYK--PNLLSDGEA-VQLFRQYA
---42_Ri_4-34 TQLLRRVD---QIYK--PNLLSDGEA-VQLF
RQY---47_Ri_4-41 TQSLRRVD---QIYK--PNLLSDGEA-VQLFRQYAFRTN--KPSGQYDNLSRCAIKYA
23_Ri_4-12 KQILSGVKA----KTYC--PGLLRPKEALLVLFRQFVFRKI--NPSTEYRRFSRHAIELA
46_Ri_4-40 KQILSGVNA----KTYC--PGLLRPKEALLVLFRQFVFRKI--NPSTEYRRFSRHAIELA
40_Ri_4-3 QQILSGVNA----ITYC--PGLLRPKEA-LVLFRKFAFRTI--DPTTEYRRLSRYAIEFA
52_Ri_4-57 EQILSAVDA----SKYF--PSLLRPREA-LILFRKIAFRTI--DPSTEYRRLSRHAIEFA
32_Ri_4-20 SRILNGFE---IYK--AELLIDGNA-GKLFSQYAFKTN--KPSGEYDHLSSRAVEYA
49_Ri_4-53 KQSLSGVH---ELYE--PKHLSHDEA-HQLFMKYAFRKN--QPTGDYNHLSRRAINYA
50_Ri_4-54 KQSLSGVN---EFFE--PKALSGDEA-YELFMKHAFNTK--QLTGDYNHLSRRAINYA
58_Ri_4-62 KQSLSGVH---ELYE--PKHLSHDEA-HELFMKYAFRKN--QPTRDYNHLSRRVIEYA
28_Ri_4-17 KQSLSGVP---ELYK--PEKLSGEEA-DELFMKHAFRKN--QPTEDYNHLSWRAREYA
33_Ri_4-22 RSLLSESK---MYD--PDFMEKKEA-LELFRKYA---KPSTQYDHLLSHAINYA
GLPL --- 20_Ri_4-1 KGLPLALKE- 34_Ri_4-23 KGLPLRLQSL 17_Ri_23-1 KGLPFALKD- 57_Ri_4-61 KGLPLALKN- 16_Ri_19-9 GGLPL--- 44_Ri_4-37 AGFPLALKV- 60_Ri_4-8_ AGLPL--- 21_Ri_4-10 GGLPLAFKD- 19_Ri_23-9 EGLPFALKI- 36_Ri_4-25 EGLPFALKK- 29_Ri_4-18 EGLPLALKI- 61_Ri_4-9 NGLPLALKV- 18_Ri_23-6 --- 45_Ri_4-4 --- 55_Ri_4-6 HGLPLALKE- 39_Ri_4-29 QGLPFALKN- 22_Ri_4-11 QGLPFALKI- 56_Ri_4-60 QGLPFALKD- 31_Ri_4-2 QGLPFAFKE- 35_Ri_4-24 QGLPLALKN- 43_Ri_4-36 QGLPFAFKK- 48_Ri_4-5 QGLPLALKV- 54_Ri_4-59 QGLPLALKM- 41_Ri_4-33 QGLPLALKD- 37_Ri_4-26 HGLPLAFKV- 38_Ri_4-28 --- 42_Ri_4-34 --- 47_Ri_4-41 QGLPFALKN- 23_Ri_4-12 QGLPLALK N-46_Ri_4-40 QGLPLALK V-40_Ri_4-3 QGLPFALK E-52_Ri_4-57 QGLPLALK I-32_Ri_4-20 QGLPLALK I-49_Ri_4-53 RGLPLALK E-50_Ri_4-54 QGLPLALK K-58_Ri_4-62 QGLPFALK V-28_Ri_4-17 KGLPLALK N-33_Ri_4-22 QGLPLALK I-Fig. 2 (continued)
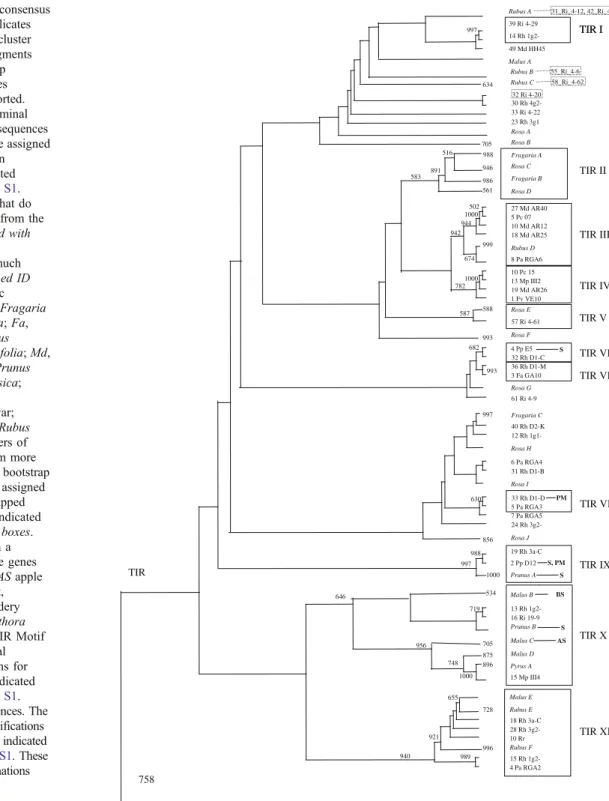
TIR sequences clustered separately from the non-TIR sequen-ces with a 75.8% bootstrap value (Fig.4a and b). Within the TIR sequences, there were 11 distinct clusters with bootstrap values of more than 50% containing sequences from multiple genera (Fig.4a). There were also 11 such clusters among the non-TIR sequences. Nine of these multigenus clusters have a bootstrap value of more than 75%, and seven have a bootstrap value of more than 90%. Four of the mapped
Rubussequences clustered near the TIR I group, while three
others were spread between the non-TIR groups. Only one mapped sequence is in a terminal multiple-genus group; 67_Ri_6-33, in non-TIR group VIII. Among all the Rubus
sequences isolated in this study, there were representatives among groups TIR I, TIR III, TIR V, TIR X, and TIR XI and non-TIR II, non-TIR IV, non-TIR VII, non-TIR VIII (10 of the 11 members), non-TIR IX, and non-TIR XI (13 of the 14 members; Fig. 4b). A more detailed illustration with color coding for each genus is provided in Supplemental Fig.S3.
P-loop RNBS-A-non-TIR
--- ---
11_Ri_16-2 --GGVGKTTLARQVYHHE--EVKRHFECFA-WVSISQ---EYQVRDVLERIYVK
75_Ri_9-37 GMGGVGKTTLAKDVFNDA---ATEQFSPKG-WVSVS---DDFDLLRVATAILES
9_Ri_14-36 GMGGVGKTTLAKLVYNDE--KVTRYFDLRA-WVCVS---DDFDVVKITQKIYMS
74_Ri_9-32 GMGGIGKTTLAQLVYNDE--KVTRHFDLRA-WVCVS---DDFDVVKITRTIYQK
73_Ri_9-30 GMGGIGKTTLAQLVYNDE--KVTRYFQDRA-WVCVS---DDFDVVKVTRTIYMS
26_Ri_4-15 GMGGVGKTTLAQVVYNDT--RVKEEFDLRA-WVCVS---DDFDVLRITQAVYAS
13_Ri_19-2 GMGGVGKTTLSQLAYNDE--RVIQHFDVRM-WTFVS---DDFNIKKIMKSIIES
30_Ri_4-19 GMGGVGKTTLAKYVYNDE--RVVMHFEMRM-WAYVSA---VDFDICRLTKEIPSS
12_Ri_19-2 -MGGVGKTTVAKSIFHDA--KIHAHFDERL-WVCVS---TPFKIKSVLRGVLES
15_Ri_19-7 GMGGVGKTTLEKEVYKQAT-EDKTLFDDVVILLDVKK---NPDVEGIQKKIVEK
65_Ri_6-31 --GGVGKTMLEKEVYKQAT-EDKTLFDDVVILLDVKKK---NPDVEGIQKKIVEK
64_Ri_6-2 --GGVGKTTLVKEIYKQAS-EDKKLFDDVVILLDVKK---NPDLEAIQKKIIEK
69_Ri_6-5 --GGVGKTTLVKEIYKQAS-EDKKLFDDVVILLDVKK---NPDLEAIQKKIIEK
62_Ri_6-1 --GGVGKTTLVKEIYKQAS-EDKKSFDNVVILLDVKK---NPDLEAIQKIIVEK
67_Ri_6-33 --GGVGKTTLVKEIYKQAS-EDKKLFDDVIILLDVKK---DPNLEAIQKVTVEK
68_Ri_6-35 --GGVGKTTLVKEIYKQAS-EDKKLFDDVIIVLDVKK---DPNLEAIQKIIVDK
66_Ri_6-32 --GGVGKTTLIKEVYRQSN-GDEKLLDKVAMVLDLKQ---NPSIERIQKEIIEK
70_Ri_6-7 --GGVGKTTLVKEIYKKTK-KDEKLFDEVVMVLDLKQ---NPTIERIQKEIAEK
63_Ri_6-10 --GGVGKTTLAKEVYRQAN-E-KKLFDGVVIVVDMKNYADSERIQKENYIERIQKEIAEK
14_Ri_19-3 --GGVGKTTLVKEIGAKAD-EVNLFDDVAF--AEFTQ---EPDLVKIQGKIAKD
25_Ri_4-14 GMGGVGKTTMVKHVGSQAQ-NNEIFHHVIMAVVLVSQ---TPDLRRIQGIFADM
7_Ri_14-33 GMGGVGKTTMVEHVGAQAK-YKGIFLYVIK--AVVTQ---SPNFWKIQGTLADM
71_Ri_9-1 GMGGVGKTTMVEHVGAQAK-NKGIFLYVIK--AVVTQ---SPNFWKIQGTLADM
1_Ri_14-1 GMGGVGKTTMVEHVGAQAK-NKGIFLYVIK--AVVTQ---SPNFWKIQGTLADM
3_Ri_14-20 GMGGIGKTTMVEHVGAQAK-NKGIFLYVIK--AVVTQ---SPNFWKIQGTLADM
2_Ri_14-2 GMGGIGKTTMVKHVAAQAR-KYGIFNQVIM--AVVSQ---SPDWRKIQGALADL
5_Ri_14-30 GMGGIGKTTMVKHVAAQAR-RYGIFNQVIM--AVVSQ---SPDWRKIQGALADL
4_Ri_14-23 GMGGIGKTTMVDHVGAQAK-NKGIFQHVTK--AVVSQ---NPNFWKIQGTLADL
10_Ri_14-5 GMGGVGKTTMVDHVGAQAK-NKGIFQHVTK--AVVSQ---NPNFWKIQGTLADL
72_Ri_9-11 GMGGIGKTTMADHVGAQAK-NKGIFQHVTK--AVVSQ---NPNFRKIQGTLADL
6_Ri_14-31 GMGGIGKTTMVEHAAALAK-NKGIFHHVIK--AVVSQ---NPNFWKIQGTLADL
59_Ri_4-7 GMGGVGKTTMVEHVAALTK-NKGIFHHVIK--VVVSQ---NPNFEKIQGTLADL
51_Ri_4-56 GMGGVGKTTIAKKVFTDTQ-VISHFN--KMIWVSVSQ---NFSAQRIVKCMLEK
53_Ri_4-58 GMGGVGKTTIAKKVFTDTQ-VISHFN--KMIWVSVSQ---NFSAQRIVKGMLEK
24_Ri_4-13 GMGGIGKTTLVKQVYEDP--KVQKRFKVHA-WITVSR---SFKINQLLRHMIKK
27_Ri_4-16 GMGGIGKTTLVKQAYEDP--NVQKRFKVHA-WITVSR---TFKINQLLRHMIKK
8_Ri_14-35 GMGGVGKTTIGRVESLDLHNPYLDGLDSDALVGEIN---PSLLDLKDLIYLD
Kinase-2 ---
11_Ri_16-2 LISATDEERK---KIARLKDDEIPGRLSRVQN-ERKCLIVLDDIWKIET---WD
75_Ri_9-37 VTSGNAKEYK---ELNAVQDK----LSKELAG--KKFFIVLDDVWDTCN---YGQWT
9_Ri_14-36 ATSQDNCDIT---DPDRLQVK----LKEALTG--KKFLFVLDDVWNENS----ADWD
74_Ri_9-32 ATSQTNCDIT---DLDLLQVL----LKNALTG--KKFLFVLDDVWNENH----ADWD
73_Ri_9-30 VLSRARCEIPN---DLNELQVK----LKEALTG--KKFLFVLDDVWNENY----DYWD
26_Ri_4-15 ITSET-CAIT---ELDLLQVK----LKEALAR--KKFLIVLDDVWNENY----SDWD
13_Ri_19-2 VTREECKLSE---SDLLQSQ----LWHLLHH--KRYLLVLDDVWTEDQ----DDWD
30_Ri_4-19 ALGTKISD---ELFMDQLQAK----LREALKD--NKFLLVLDDVWNEDR----MKW-
12_Ri_19-2 LKSKNAAVQT---KEAMCGV----LKEELQG--KRYLLVLDDVWNEES----DKWD
15_Ri_19-7 LGMDILD---HNETIDGRASRLCARIQG--KKILVILDDVQEK---IDME
65_Ri_6-31 LGMDILD---HNETIDGRASRLCARIQG--KKILVILDDVQEK---IDME
64_Ri_6-2 LGMKIE---PDETIEGRAIRLCGKIQD--KKILVILDDVEEK---IDLE
Fig. 3 Alignment of conceptually translated
Rubusnon-TIR sequences. The RNBS-A-non-TIR motif is characteristic of plant non-TIR-NBS-LRR RGAs. Identical residues with 50% or greater frequency in a column have adark grey background. Similar residues with 50% or greater frequency have a
Discussion
Improvement of disease resistance is one of the main priorities in plant breeding. Markers developed through molecular techniques can be used for marker-assisted selec-tion and eventually facilitate the map-based cloning of genes involved in the response to pests or other stresses. PCR
approaches utilizing degenerate primers based on conserved NBS motifs from known disease-resistance genes have led to the cloning and identification of RGAs from many plant species (Kanazin et al.1996; Leister et al.1996; Yu et al. 1996; Aarts et al. 1998; Leister et al. 1998; Timmerman-Vaughan et al. 2000; Donald et al. 2002; Gaspero and Cipriani2002; Tan et al.2003; Zhang et al.2003; Baldi et al.
69_Ri_6-5 LGMKIE---PDETIEGRAIRLCGKIQD--KKILVILDDVEEK---IDLE
62_Ri_6-1 LDMEIL---QTETKEGRARRLCGKIQD--KKILVILDDVEEK---IDLE
67_Ri_6-33 LGMEIL---PNETKDGRASRLCARIQD--KKILVILDDVEEE---INLE
68_Ri_6-35 LGMEIK---QNETKEGRASRLCGRIQD--KKVLVILDDVQEK---IDLE
66_Ri_6-32 LGLDLH---EIETLAGRALHLCNKIKD--KKILVILDDVWEY---INLE
70_Ri_6-7 LGLNLQ---EIETPATRALHLRNRMKG--KKTLVLLDDVWEN---IDLE
63_Ri_6-10 LNIDIR---ECLTEKGRARHLWDKLKD--KKILVILDDVWEK---IELE
14_Ri_19-3 LGLEFT---PD--DDRAAKLRERLSGGTKRVLVILDNVWTDNSSPDQLTLW
25_Ri_4-14 LGLKFE---EETETGRANRLMTKIES-GNKILIILDDIWD---RINLS
7_Ri_14-33 LGVNLA---GETETGRAVSLNKEIMR-REKILIILDDIWE---MIDLS
71_Ri_9-1 LGVNLA---GETETGRAVSLNKEIMR-REKILIILDDIWE---MIDLS
1_Ri_14-1 LGVNLA---GETETGRAVSLNKEIMR-REKILIILDDIWE---MIDLS
3_Ri_14-20 LGVNLA---GETETGRAVSLNKEIMR-REKILIILDDIWE---MIDLS
2_Ri_14-2 LGVKLE---EETEIGRAATLSKEIMR-RNKILIILDDIWK---GLDLS
5_Ri_14-30 LGVKLE---EETEIGRAATLSKEIMR-RNKILIILDDIWK---GLDLS
4_Ri_14-23 LGVKLA---GETETGRAASLNKEIMR-REKILIILDNVWN---RVELS
10_Ri_14-5 LGVKLA---GETETGRAASLNKEIMR-REKTLIILDNVWN---RVELS
72_Ri_9-11 LGVKLA---GETETGRAASLNKEIMR-REKILIILDNVWN---RVELS
6_Ri_14-31 LGVKLA---GETETGRAASLNKEIMR-REKILIILDNVWN---RVELS
59_Ri_4-7 LGVKLA---DETEAGRATSLNKAIMR-REKILIILDDVWS---RIELS
51_Ri_4-56 ANMQAPDVSE---SDDMFTR----LKQGLDD--QDYLIVMDDVWPKPN----LEIF
53_Ri_4-58 ANMQAPDVSE---SDDMFTR----LKQGLDD--QDYLIVMDDVWPKPN----LEIF
24_Ri_4-13 IFKVIRKPVPEDEE--VENMDDNQLRERIKKLLQN--SRYLIVLDDLWHIPD---WE
27_Ri_4-16 IFKVIRKPVPEDEE--VENMDDNQLRERIKKLLQN--SRYLIVLDDLWHIPD---WE
8_Ri_14-35 VSMNN---FGGIQLP---SFIGSLEK--LKYLNLSGASFGG---
RNBS-B RNBS-C ---
---11_Ri_16-2 R--LKAAFECDDESKSKILLTTRK---KEVALYPDVNCFAHPP---
75_Ri_9-37 T--LQSSFRVGAA-GSKIIVTTRDANVARMMGD---TNPYKLGSISQDDCWKIFEHHALL
9_Ri_14-36 F--LRGPFKYGAC-RSKIIVTTRNEGVASVMGT---LQTHTLPVISDEDCWLLFAKHAFE
74_Ri_9-32 V--LRQPFQSGGC-GSKIIVTTRNEGVASVMGT---LQTHPLPVISDEDCWWLFAKHAFE
73_Ri_9-30 S--LRRPFESGAC-GSKIIVTTRNEGVASMMCT---LQTHHLQDISDEDCWLLFAKHAFE
26_Ri_4-15 R--LRRPFGIGAC-GSNILVTTRNEAVAAVMGT---LPTYHLKHISEEDGWLLFAKHAFK
13_Ri_19-2 K--LRPLFRGGVD-GCKIIVTSRSKKVPFMMDSP--TSTYHLKGLMEVDCWALFKQRAFG
30_Ri_4-19 ---IPFCTQGT---
12_Ri_19-2 D-LRNCLLRGTDTRGSKLIVTTRKDKVGKIVETLL-PRPDLEK-LSVEDCWRIMKDKSMG
15_Ri_19-7 VVGLPRL---A-TCKILLTCRTREVLSIDKMCA-EKVFQFDILGKEEYIVEFVWEDGR
65_Ri_6-31 VVGLPRL---A-TCKILLTCRTREVLSIDKMCA-EKVFQFDILGKEEYIVEFVWEDGR
64_Ri_6-2 AVGLPRL---P-TCKVLLTFRTRQVF--DEMRA-DKVVQLDLLGKEDSWNLFVKMAGD
69_Ri_6-5 AVGLPRL---P-TCKILLTFRTRQVF--DEMCV-DKVFRLDLLDKQETWILFVKMAGD
62_Ri_6-1 AVGLPRL---P-TCKILLTFRTRQVF--DETRA-DKVIQLDLLDKEDSWNLFVKMAGD
67_Ri_6-33 AVGLPRL---P-TCKILLTCRTRQVF--DEMRV-QKVFQLDLLGKEDTWNLFVKMAGD
68_Ri_6-35 AVGLPRQ---P-TCKILLTCRTPQVF--DEMRV--KVFRLDLLGKEDTWNLFVKMAGD
66_Ri_6-32 DVGLPRM---S-TLKILLTSRTKKVLS-RDMGT-QKEFHLDVLDKKETWSLFHKKAGD
70_Ri_6-7 AVGLPRM---P-TLKILLTSRSKIVLS-RDMGT-QKEFHIDLLGQEETWSLFQKMAGD
63_Ri_6-10 DLGIP---Q-TCNILFTSRNREVLY-SKMGT-QKEFLLGVLGDEESWRLFEKMAGA
14_Ri_19-3 EVGIPISRDPK---SCKVLVSSREQDIFK--EMKT-KKNFPI---
25_Ri_4-14 CIGIPSYNELQRC-NSKVVLTTRRLHVCH--TMET-QAKIPLDILSE-DSWNLFTKKARI
7_Ri_14-33 SIGIPNYKDLQNC-NSKVLLTTRIQHVCH--TMKS-QEKIALNILSQEDSWTLFVKNARR
71_Ri_9-1 SIGIPNYKDLRNC-NSKVLLTTRIQHVCH--TMKS-QEKIALNILSQEDSWTLFVKNARR
1_Ri_14-1 SIGIPNYKDLQNC-NSKVLLTTRIQHVCH--TMKS-QEKIALNILSQEDSWTLFVKNARR
3_Ri_14-20 SIGIPNYKDLQNC-NSKVLLTTRIQHVCH--TMKS-QEKIALNILSQEDSWTLFVKNARR
2_Ri_14-2 RIGLPSYEELQNC-NSKVLLTTRIRNVCH--VMKC-QEKITLNILSKQDSWTLFVRNAGC
5_Ri_14-30 RIGLPSYEELQNC-NSKVLLTTRIRNVCH--VMKC-QEKITLNILSKQDSWTLFVRNAGC
4_Ri_14-23 RIGVPGYKKLQTC-NSKVIITTRIKNTCT--SMHT-QEKIHLSVLSEKDSWSLFANTTGM
2004; Xu et al.2005,2007). In this study, we have isolated 75 genomic fragments that revealed 50–87% similarity to NBS-LRR genes from other species, thus providing the first sampling of RGA sequences from red raspberry.
The percent nucleotide identity between the Rubus
sequences identified ranged from 9% (18_Ri_23-6, 74_Ri_9-32) to 100% (42_Ri_4-34, 38_Ri_4-28). The majority of sequences were widely divergent from each other. Only 20 pairs of sequences out of 5,550 pairwise comparisons showed more than 90% sequence identity between them. Probably there are many other RGA sequences in red raspberry, as only 75 amplified fragments based on seven primer combinations were analyzed. In fact,
the NBS-LRR class of resistance genes has been shown to be very large in plants. For example, the genome of the model plant species A. thaliana is estimated to contain approximately 200 genes that encode related NBS motifs (Meyers et al.1999). Red raspberry is diploid (2n=2x=14) and has a small genome (0.58 pg/2C, 280 Mbp/1C), which compares favorably to A. thaliana with a genome size of 0.30 pg/2C, 145 Mbp/1C (Arumuganathan and Earle1991), and so would be expected to proportionately have approx-imately 386 genes encoding NBS motifs.
It is likely that the RGA sequences with identity of more than 90% (20 pairs) have arisen from a recent duplication of a common ancestor gene. Unequal crossing-over is
10_Ri_14-5 RIGVPGYKKLQTC-NSKVIITTRIKNTCT--SMHT-QEKIHLSVLSEKDSWSLFANTTGM
72_Ri_9-11 RIGVPGYKKLQTC-NSKVIITTRIKNTCT--SMHT-QEKIHLSVLSEKDSWSLFANTTGM
6_Ri_14-31 RIGVPGYKKLQTC-NSKVILTTRIKNTCT--AMHT-QEKIHLSVLSEKDSWSLFANTTGM
59_Ri_4-7 RIGVPGYKKLQTC-NSKVILTTRMKNTCT--SMHT-QVKILLGVLSEKDSWSLFADTTGM
51_Ri_4-56 WTDLCNILPTKVGKSSCIVITTRYKDIARGMVDQD-SQILQPSTLNEMDSWSLFCRFAFR
53_Ri_4-58 WTDLCNILPTKVGKSSCIVITTRYKDIARGMVEQD-SQILQPSTLNEVDSWSLFSRFAFR
24_Ri_4-13 TINHAMPNNNHGS---RVMLTTRHVYVASASCLGNPDMLYHLEPLSPEDSWTLLCRRTFQ
27_Ri_4-16 TINHAMPNNNHGS---RVMLTTRHAYVASASCLGNPDMLYRLEPLSPEDSWTLLCRKTFQ
8_Ri_14-35 --VIPPDLGNLSR---LLYLDLSNNAIES---DLRWLPSVSSLRFLNLGGAN
GPLAL ---
11_Ri_16-2 ---
75_Ri_9-37 NG---TPQNVDLLKKKVILKCNGLPLVART--
9_Ri_14-36 NKRV--GAYPNLVVIGRKIVKKCKGLPLAAKS--
74_Ri_9-32 NKMV--SAYPNLEVIGRKIVKKCKGLPLAAKS--
73_Ri_9-30 NKSV--SAYPNLEVIGRKIVKKCKGLPLAAKS--
26_Ri_4-15 NAHALGTEHPDLANIGRKIVKKCNGLPLALKE--
13_Ri_19-2 RGEE--ENYPNLCLIGKQIAKKCGGVPL---
30_Ri_4-19 ---
12_Ri_19-2 SAPI----TEDQTKIGRRIATKCGGLPL---
15_Ri_19-7 RCTQWFMVGYDLRDVAIQVAEKCGGLPL---
65_Ri_6-31 RCTQWFMVGYDLRDVAIQVAEKCGGLPL---
64_Ri_6-2 VINQ----NRGIRDVAIKVAERCGGLPL---
69_Ri_6-5 VINQ----NGGIRDVAIKVAESCGGLPL---
62_Ri_6-1 VINQ----NGAIRDVAIKVAERCGGLPL---
67_Ri_6-33 VIHQ----KSGIRDVAIKVAERCGGVPL---
68_Ri_6-35 VINQ----NGGIRDVAIKVAERCGGLPL---
66_Ri_6-32 IVKK---TDIQTVAIQVAEKCGGLPL---
70_Ri_6-7 IVEK---PDIQTVATKVAEKCGGLPL---
63_Ri_6-10 VVKD---ERKREIAIHVSNKCGGVPL---
14_Ri_19-3 ---AGLPLALKE--
25_Ri_4-14 SFQK----SSDFYDVARKVARECAGLPLALKI--
7_Ri_14-33 SF-E----PTNFKDVARKVARECSCFSDSSHS--
71_Ri_9-1 SF-E----PTNFKDVARKVARECSCLSYSTHS--
1_Ri_14-1 SF-E----PTNFKDVARKVAGECSGLSDSTHS--
3_Ri_14-20 SF-E----PTNFKDVARKVARECSGLTDTSHS--
2_Ri_14-2 PF-E----SSTFEDVARRVAGECCGFTNSSHS--
5_Ri_14-30 PF-E----SSTFEDVARRVAGECCSLSYSSHS--
4_Ri_14-23 SFDE----SSELYNVARKVSNECSCFSYTSHS--
10_Ri_14-5 SFDE----SSELYNVARKVSNECSCFSNTSHS--
72_Ri_9-11 SFDE----SSESYNVARKVSNECSCLSDTSHS--
6_Ri_14-31 SFDE----SSELYNVARKLSNECSGLS---
59_Ri_4-7 SFDE----SSELYNVARKLSNECSGLPFALKD--
51_Ri_4-56 STDGK-SPDELFEKEGKVIVKRCGGLPLALKM--
53_Ri_4-58 STDGK-CPDEWFEKEGKVIVKRCGGLPFALKD--
24_Ri_4-13 G----NSCLPNLEEICRSILRKCGGLPLALKI--
27_Ri_4-16 G----NSCLPNLEEICRSILRKCGGLPLALKD--
8_Ri_14-35 FTKAAPYWLPTVNMLPSLVELHLPGCCFSDSSHS
believed to be one mechanism through which this type of diversity is created in RGA clusters in plant genomes (Meyers et al.1998). Alternatively, point mutations and/or small insertion/deletions in the regions between the con-served motifs may account for the genetic divergence between fragments of very high homology. Two main
hypotheses have been proposed to explain the evolution of
R genes: the first suggesting that it is a result of slow evolving process (Michelmore and Meyers 1998; Stahl et al. 1999), while the second suggests a rapid evolution (Leister et al. 1998; McDowell et al. 1998). A greater degree of divergence was observed among the TIR-type
Rubus A 39 Ri 4-29 14 Rh 1g2-997 Malus A Rubus B Rubus C 32 Ri 4-20 30 Rh 4g2-33 Ri 4-22 Rosa A Rosa B Fragaria A Rosa C 516 Fragaria B Rosa D 583 27 Md AR40 5 Pc 07 502 10 Md AR12 1000 18 Md AR25 944 Rubus D 8 Pa RGA6 674 942 10 Pc 15 13 Mp III2 19 Md AR26 1000 1 Fv VE10 782 Rosa E 57 Ri 4-61 587 Rosa F 4 Pp E5 32 Rh D1-C 682 36 Rh D1-M 3 Fa GA10 993 Rosa G 61 Ri 4-9 Fragaria C 40 Rh D2-K 12 Rh 1g1-Rosa H 6 Pa RGA4 31 Rh D1-B Rosa I 33 Rh D1-D 5 Pa RGA3 630 7 Pa RGA5 24 Rh 3g2-Rosa J 19 Rh 3a-C 2 Pp D12 988 Prunus A 997 Malus B 13 Rh 1g2-16 Ri 19-9 719 Prunus B Malus C 705 Malus D Pyrus A 15 Mp III4 1000 956 Malus E Rubus E 655 18 Rh 3a-C 28 Rh 3g2-10 Rr Rubus F 921 15 Rh 1g2-4 Pa RGA2 989 758 TIR 23 Rh 3g1 634 891 705 988 946 986 561 999 588 993 997 856 1000 534 646 748 875 896 49 Md HH45 728 996 940 TIR I TIR II TIR III TIR IV TIR V TIR I TIR VI TIR VII TIR VIII TIR IX TIR X TIR XI 31_Ri_4-12, 42_Ri_4-34 55_Ri_4-6 58_Ri_4-62 BS AS S S PM S, PM S
Fig. 4 Majority-rule consensus of 1,000 bootstrap replicates of a neighbor-joining cluster of Rosaceae RGA fragments (amino acid). Bootstrap confidence for branches more than 60% is reported. To conserve space, terminal clusters composed of sequences from a single genus are assigned aletter. Membership in these clusters is indicated in Supplemental TableS1. Individual sequences that do not group with others from the same genus arelabeled with a number,taxonomic abbreviation, and as much of theoriginal published ID
as possible. Taxonomic abbreviations are:Fc,Fragaria chiloensis;Fv,F. vesca;Fa, F. ananassa;Mb,Malus baccata;Mp,M. prunifolia;Md, M.×domestica;Pa,Prunus armeniaca;Pp,P. persica; Pc,Pyrus communis;
Rh,Rosahybrid cultivar;
Rr,R. roxburghii;Ri,Rubus idaeus. Terminal clusters of sequences derived from more than one genus with a bootstrap of more than 50% are assigned aRoman numeral. Mapped
Rubussequences are indicated withdashed linesandboxes. Sequences localized in a genome near resistance genes or QTLs arelabeled:ASapple scab,BSbacterial spot,
Nnematode,PMpowdery mildew,PRR Phytophthora
root rot,Ssharka.aTIR Motif sequences. The original published classifications for these sequences are indicated in Supplemental TableS1.
bnon-TIR Motif sequences. The original published classifications for these sequences are indicated in Supplemental TableS1. These include non-TIR designations such as CC-NBS-LRR Malus G, and LZ
RGAs compared to the non-TIR-type RGAs suggesting that the former have been evolving more rapidly than the latter type. However, the full set of NBS-LRR sequences in red raspberry must be characterized to properly answer the
question of which mechanism is responsible for the evolu-tion of RGAs in this plant. Interestingly, evidence of func-tional resistance identified in other related plants clustered in TIR groups IX and X (four cases each, Fig.4a). TIR X,
Malus F Rosa K 30 Ri 4-19 10 Rh 12g2 601 5 Pp F4 941 Malus G 8 Rh 12g1-631 12 Ri 19-2 2 Rh 11a-G 759 Malus H Pyrus B Rubus G 6 Rh 11b-L 6 Pp 34 Rh D1-H 3 Pp D9 593 Malus I 11 Ri 16-2 5 Rh 11a-H 11 Md AR13 Rubus I 991 28 Md AR41 4 Pc 06 3 Pc 04 22 Rr 15 Rosa L Rosa M Rosa N Pyrus C Rosa O 75 Ri 9-37 996 Rubus J 601 63 Ri 6-10 29 Md AR42 646 12 Mp II24 14 Ri 19-3 791 48 Md HH40 1 Rh 10g1-880 11 Rh 12g2 619 7 Rh 11g1-519 Rubus K 609 8 Ri 14-35 35 Rh D1-K 780 549 Non-TIR Rubus H 758 13 Ri 19-2 580 791 852 521 1000 765 983 965 589 521
NTIR I
NTIR I
NTIR II
NTIR III
NTIR IV
NTIR V
NTIR VI NTIR VII NTIR VIII NTIR IX NTIR X 9_Ri_14-36 27_Ri_4-16 67_Ri_6-33 609 NTIR XI N N AS PRR AS Fig. 4 (continued)in particular, has the most genera represented (5), and the most sequences (41). The evidence of both spread and number of sequences as well as conservation of function implies that the TIR X group may represent the ancestral Rosaceous TIR R gene from which additional RGA sequences evolved. Among the small TIR IX group, three of the four sequences are implicated in functional resis-tance. These two groups provide an intriguing target for further studies on R gene evolution and a likely source of functional polymorphism.
This study identifies 22 clusters with a bootstrap greater than 50% and more than one genus represented (Fig.4a and b). A number of these clusters contain NBS-LRR sequences mapped near resistance QTL and loci from other species (Fig.4a and b, Supplemental TableS1). Among the TIR type sequences, there were four such clusters. TIR IV, TIR VIII, TIR IX, and TIR X contain sequences linked to sharka (plum pox; Lalli et al.2005), powdery mildew (Lalli et al.2005), apple scab (Baldi et al.2004), and bacterial spot resistance (Lee and Lee 2003). Three of the non-TIR type clusters (NTIR I, NTIR II, NTIR VI) contained sequences linked to root-knot nematode (Lalli et al.2005) and apple scab (Baldi et al. 2004) resistance. None of 22 clusters identified here contained a mapped Rubus sequence; however, one Rubus
sequence, located near a QTL for PRR resistance (Fig.1), grouped with the larger clade containing clusters NTIR I to NTIR V (Fig.4b).
The sequence relationships of RGA fragments share patterns with several previous studies that had a more lim-ited taxonomic scope among the Rosaceae. Twenty of our 22 clusters (11 TIR, 9 non-TIR) corresponded to NBS-LRR clusters published in other studies (Supplemental TableS4). Six of the TIR clusters and three of the non-TIR clusters were corroborated by more than one additional study.
There was only one discrepancy between the sequence designation indicated by our neighbor-joining tree and those already published. Specifically, Baldi et al. (2004) designated ARGH 22 as a TIR sequence, while our analysis showed the same sequence (20_Md) to belong to the NTIR group (Supplemental TableS1). Only one“cluster”(really a paraphyletic group) designated by Hattendorf and Debener (2007) does not correspond with the sequence relationships found in this study; the“Rose–Pyrus”non-TIR group has members scattered among many of our non-TIR groups: NTIR IV, NBIR VII, and several other places in between (2_Rh_11a-G, 6_Rh_11b-L, 5_Rh_11a-H, 3_Pc_04, 4_Rh_11a-G).
The overall agreement of all 14 studies of Rosaceae NBS-LRR sequences (including this one) indicates that these groupings are relatively robust. Each study used a different subset of data, and a variety of methods were used for analysis. Hattendorf and Debener (2007) shares seven
clusters with this study, even though the clustering method used was very different (parsimony). Figure 1 of Xu et al. (2007) shares 15 clusters with this study, although it contains only 83 Rosaceae sequences and does not include
R. hybrid or Rubus sequences.
Given the overall similarity of sequence fragments from multiple genera (as supported by bootstraps of more than 90%), it seems probable that a significant proliferation of the RGA family occurred before the Rosaceae evolved into the different species present today. Large clusters of sequences, all from the same species, imply gene duplica-tion after speciaduplica-tion (Xu et al.2007). This pattern is seen
forRubus,Malus,Fragaria, and Rosa, but not forPrunus
or Pyrus. However, it is difficult to compare the
prolifer-ation of particular NBS-LRR sequence types between specific Rosaceae using public data, as different primers and cloning procedures were used in each study. In this work, certain primer combinations tended to isolate related sequences. For example, theRubusJ group contains many products from the N6 primer and theRubusK group many N4 products (Supplemental Table S1). Large clusters of similar sequences in Prunusor Pyrusmight exist, but not have been detected, due to the way sequences were iso-lated. It would require strict control in methodology to generate the data necessary to address patterns of sequence proliferation between individual species.
RGAs are widely distributed in plant genomes and often organized in clusters (Kanazin et al. 1996; Meyers et al. 1999). In this study, eight RGA sequences were mapped in a previously developed red raspberry genetic map (Pattison et al. 2007) covering six out of the seven linkage groups. Clustering RGAs was not observed, probably due to the small amount of sequences mapped. Previous studies indicate that some RGAs might be genetically located at or near known resistance loci (Kanazin et al.1996; Yu et al. 1996; Collins et al.1998; Donald et al.2002; Radwan et al. 2004). For example, two RGAs were found in close linkage to the nematode resistance locus Gro1 in potato (Leister et al. 1996), three RGA markers were linked to the citrus tristeza virus and nematode resistance inCitrus(Deng et al. 2000), and four RGA-derived markers (three RFLP markers and one STS marker) were found to be associated with CRPM1, a major R locus contributing to powdery mildew resistance in chestnut rose (Xu et al. 2005). Lalli et al. (2005) identified a number of RGAs near resistance QTL and other loci (Supplemental Table S1). In this study, one RGA marker (9_Ri_14-36) was mapped within the QTL for resistance to PRR (Pattison et al.2007) on LG1 and might prove useful for marker-assisted selection. RGA marker(s) could not be co-localized with the second QTL for resistance to PRR. This result is not surprising because (1) a small portion of theoretically possible NBS-containing
sequences from red raspberry have been identified, (2) the methods used did not allow the mapping of all the RGAs analyzed, and (3) not all QTL for resistance are necessarily associated with RGA sequences.
To date, few studies have been conducted toward the cloning and characterization of disease-resistance-related genes in red raspberry. Locating and mapping additional NBS-LRR homologues as well as the analyses of the RGAs mapped so far will help to accelerate the identification of genomic regions containing functional resistance genes and facilitate the long process of map-based cloning. This will lead to a better understanding of disease resistance in red raspberry and other plants and hopefully to the develop-ment of improved cultivars for commercial production that require fewer pesticides.
Acknowledgments This research was supported by a grant from the US Department of Agriculture—National Research Initiative (USDA-NRI) NYG-632526. We are grateful to William Boone for skillful technical work.
References
Aarts MGM, te Lintel Hekkert B, Holub EB, Beynon JL, Stiekema WJ, Pereira A (1998) Identification of R-gene homologous DNA fragments genetically linked to resistance loci in Arabidopsis thaliana. Mol Plant Microbe Interact 11:252–258
Afunian MR, Goodwin PH, Hunter DM (2006) Search for molecular markers linked to fire blight resistance in pear (Pyrus communis). Acta Hort (ISHS) 704:557–566
Arumuganathan K, Earle ED (1991) Nuclear DNA content of some important plant species. Plant Mol Biol Rep 9:208–218 Baker B, Zambryski P, Staskawicz B, Dinesh-Kumar SP (1997)
Signaling in plant–microbe interactions. Science 276:726–733 Bent AF (1996) Plant disease resistance genes: function meets
structure. Plant Cell 8:1757–1771
Baldi P, Patocchi A, Zini E, Toller C, Velaso R, Komjanc M (2004) Cloning and linkage mapping of resistance gene homologues in apple. Theor Appl Genet 109:231–239
Barritt BH, Crandall PC, Bristow PR (1979) Breeding for root rot resistance in red raspberry. J Amer Soc Hort Sci 104:92–94 Calenge F, Van der Linden CG, Van de Weg E, Schouten HJ,
Van Arkel G, Denance C, Durel C-E (2005) Resistance gene analogues identified through the NBS-profiling method map close to major genes and QTL for disease resistance in apple. Theor Appl Genet 110:660–668
Collins NC, Webb CA, Seah S, Ellis JG, Hulbert SH, Pryor A (1998) The isolation and mapping of disease resistance gene analogs in maize. Mol Plant-Microb Interact 11:968–978
Dangl JL, Jones JDG (2001) Plant pathogens and integrated defense responses to infection. Nature 411:826–833
Deng Z, Huang S, Ling P, Chen C, Yu C, Weber CA, Moore GA, Gmitter FG Jr (2000) Cloning and characterization of NBS-LRR class resistance-gene candidate sequences inCitrus. Theor Appl Genet 101:814–822
Donald TM, Pellerone F, Adam-Blondon AF, Bouquet A, Thomas MR, Dry IB (2002) Identification of resistance gene analogs linked to a
powdery mildew resistance locus in grapevine. Theor Appl Genet 104:610–618
Erwin DC, Ribeiro OK (1996) Phytophthora disease worldwide. APS Press, St. Paul, MN, p 562
Felsenstein J (2006) PHYLIP (Phylogeny Inference Package;
http://evolution.genetics.washington.edu/phylip.html)
Flor HH (1971) Current status for the gene-for-gene concept. Ann Rev Phytopathol 9:275–296
Gaspero G, Cipriani G (2002) Resistance gene analogs are candidate markers for disease-resistance genes in grape (Vitisspp.). Theor Appl Genet 106:163–172
Hammond-Kosack KE, Jones JDG (1997) Plant disease resistance genes. Ann Rev Plant Physiol Plant Mol Biol 48:575–607 Hattendorf A (2005) Molekulargenetische Charakterisierung von
Resistenzgenanaloga im Rosengenom als Basis fuer die Resis-tenzzuechtung. Dept Hort, Hannover, Germany, p 117 University of Hannover
Hattendorf A, Debener T (2007) Molecular characterization of NBS-LRR-RGAs in the rose genome. Physiol Plant 129(4): 775–786
Jones JDG (1996) Plant disease resistance genes: structure, function and evolution. Curr Opin Biotechnol 7:155–160
Kanazin V, Marek LF, Shoemaker RC (1996) Resistance gene analogs are conserved and clustered in soybean. Proc Natl Acad Sci USA 93:11746–11750
Karplus K, Barrett C, Hughey R (1998) Hidden Markov models for detecting remote protein homologies. Bioinformatics 14(10): 846–856
Konieczny A, Ausubel FM (1993) A procedure for mapping
Arabidopsis mutations using codominant ecotype-specific markers. Plant J 4:403–410
Lalli DA, Decroocq V, Blenda AV, Schurdi-Levraud V, Garay L, Le Gall O, Damsteegt V, Reighard GL, Abbott AG (2005) Identification and mapping of resistance gene analogs (RGAs) in Prunus: a resistance map for Prunus. Theor Appl Genet 111: 1504–1513
Lee SY, Lee DH (2003) Putative TIR-NBS type R protein 4 [Malus baccata]: expression of the MbR4, a TIR-NBS type of apple R gene, confers resistance to bacterial spot disease in
Arabidopsis. GenBank accessionshttp://www.ncbi.nlm.nih.gov
Lee SY, Lee DH (2006) TIR-NBS-LRR type R protein 7 [Malus baccata]: overexpression of the Apple MbR7 Encoding a TIR-NBS-LRR Type of R gene Induce Enhanced Resistance of transgenic Arabidopsis Infection with Bacterial Pathogen. GenBank accessionshttp://www.ncbi.nlm.nih.gov
Lee S-Y, Seo J-S, Rodriquez-Lanetty M, Lee D-H (2003) Comparative analysis of superfamilies of NBS-encoding disease resistance gene analogs in cultivated and wild apple species. Mol Gen Genomics 269:101–108
Leister D, Ballova A, Salamini F, Gebhardt C (1996) A PCR-based approach for isolating pathogen resistance genes from potato with a potential wide application in plants. Nat Genet 14:421–429 Leister D, Kurth J, Laurie DA, Yano M, Sasaki T, Devos K, Graner A,
Schulze-Lefert P (1998) Rapid reorganization of resistance gene homologues in cereal genome. Proc Natl Acad Sci USA 95: 370–375
Liang FS, Kong FN, Zhou C-J, Cao P-X, Ye C-J, Wang B (2005) Cloning and characterization of a non-TIR-NBS-LRR type disease resistance gene analogue from peach. DNA Sequence 16:103–110
Martínez Zamora MG, Castagnaro AP, Díaz Ricci JC (2004) Isolation and diversity analysis of resistance gene analogues (RGAs) from cultivated and wild strawberries. Molec Genet Genomics 272:480–487
McDowell JM, Dhandaydham M, Long TA, Aatrs MG, Goff S, Holub EB, Dangl JL (1998) Intragenic recombination and diver-sifying selection contribute to the evolution of downy mildew resistance at the RPP8 locus of Arabidopsis. Plant Cell 10: 1861–1874
Meyers BC, Chin DB, Shen KA, Sivaramakrishnan S, Lavelle DO, Zhang Z, Michelmore RW (1998) The major resistance gene cluster in lettuce is highly duplicated and spans several mega-bases. Plant Cell 10:1817–1832
Meyers BC, Dickerman AW, Michelmore RW, Sivaramakrishnan S, Sobral BW, Young ND (1999) Plant disease resistance genes encode members of an ancient and diverse protein family within the nucleotide-binding superfamily. Plant J 20:317–332 Michelmore RW, Meyers BC (1998) Clusters of resistance genes
in plants evolve by divergent selection and a birth-and-death process. Genome Res 8:1113–1130
Paran I, Michelmore RW (1993) Development of reliable PCR-based markers linked to downy mildew resistance genes in lettuce. Theor Appl Genet 85:985–993
Pan Q, Wendel J, Fluhr R (2000) Divergent evolution of plant NBS-LRR resistance gene homologues in dicot and cereal genomes. J Mol Evol 50:203–213
Pattison JA, Samuelian SK, Weber CA (2007) Inheritance of
Phytophthoraroot rot resistance in red raspberry determined by generation means and molecular linkage analysis. Theor Appl Genet 115:225–236
Radwan O, Bouzidi MF, Nicolas P, Mouzeyar S (2004) Development of PCR markers of thePI5/PI8locus for resistance toPlasmopara halstedii in sunflower, Helianthus annuus L. from complete CC-NBS-LRR sequences. Theor Appl Genet 109:176–185 Rehm BHA (2001) Bioinformatic tools for DNA/protein sequence
analysis, functional assignment of genes and protein classifica-tion. Appl Microbiol Biotechnol Online article at http://link. springer.de/link/service/journals/00253/index.htm
Saraste M, Sibbald PR, Wittinghofer A (1990) The P-loop—a common motif in ATP- and GTP-binding proteins. Tr Biochem Sci 15: 430–434
Shen KA, Meyers BC, Islam-Faridi MN, Chin DB, Stelly DM, Michelmore RW (1998) Resistance-gene candidates identified by PCR with degenerate oligonucleotide primers map to clusters of resistance genes in lettuce. Mol Plant Microbe Interact 11: 1815–823
Smith RF, Wiese BA, Wojzynski MK, Davison DB, Worley KC (1996) BCM Search Launcher—An integrated interface to molecular biology data base search and analysis services available on the World Wide Web. Genome Res 6:454–462 Soriano JM, Vilanova S, Romero C, Llácer G, Badenes ML (2005)
Characterization and mapping of NBS-LRR resistance gene analogs in apricot (Prunus armeniaca L.). Theor Appl Genet 110:980–989
Stahl EA, Dwyer G, Mauricio R, Kreitman M, Bergelson J (1999) Dynamics of disease resistance polymorphism at theRpm1locus ofArabidopsis. Nature 400:667–671
Tan H, Callahan FE, Zhang X-D, Karaca M, Saha S, Jenkins JN, Creech RG, Ma D-P (2003) identification of resistance gene analogs in cotton (Gossypium hirsutumL.). Euphytica 134:1–7 Timmerman-Vaughan GM, Frew TJ, Weeden NF (2000)
Character-ization and linkage mapping of R-gene analogous DNA sequences in pea (Pisum sativum L.). Theor Appl Genet 101: 241–247
Van Oijen JW, Voorrips RE (2001) JoinMap 3.0®, software for the calculation of genetic linkage maps. Plant Research International, Wageningen, The Netherlands
Varshochi A (2006) Putative CC-NBS-LRR resistance protein [Malus × domestica]: Sequencing of a Malus domestica BAC associated with resistance to Dysaphis devecta. GenBank accessions.http://www.ncbi.nlm.nih.gov
Wilcox WF, Pritts MP, Kelly MJ (1999) Integrated control of
Phytophthoraroot rot of red raspberry. Plant Dis 83:1149–1154 Xu Q, Wen X, Deng X (2005) Isolation of TIR and nonTIR NBS-LRR resistance gene analogues and identification of molecular markers linked to a powdery mildew resistance locus in chestnut rose (Rosa roxburghiiTratt). Theor Appl Genet 111:819–830 Xu Q, Wen X, Deng X (2007) Phylogenetic and evolutionary analysis
of NBS-encoding genes in Rosaceae fruit crops. Mol Phylogenet Evol 44:315–324
Yu YG, Buss GR, Maroof MAS (1996) Isolation of a superfamily of candidate disease resistance genes in soybean based on a con-served nucleotide-binding site. Proc Natl Acad Sci USA 93: 11751–11756
Zhang LP, Lin GY, Niño-Liu D, Foolad MR (2003) Mapping QTLs conferring early blight (Alternaria solani) resistance in a
Lycopersicon esculentum × L. hirsutum cross by selective genotyping. Mol Breeding 12:3–19