agriculture
ArticleUtilization of Molecular Marker Based Genetic
Diversity Patterns in Hybrid Parents to Develop Better
Forage Quality Multi-Cut Hybrids in Pearl Millet
Govintharaj Ponnaiah1,2,* , Shashi Kumar Gupta2, Michael Blümmel3,
Maheswaran Marappa1, Sumathi Pichaikannu1, Roma Rani Das2and Abhishek Rathore2 1 Tamil Nadu Agricultural University, Coimbatore 641 003, Tamil Nadu, India; [email protected] (M.M.);
[email protected] (S.P.)
2 International Crops Research Institute for the Semi-Arid Tropics (ICRISAT), Patancheru 502 324, Hyderabad, Telangana, India; [email protected] (S.K.G.); [email protected] (R.R.D.); [email protected] (A.R.)
3 International Livestock Research Institute (ILRI), Patancheru 502 324, Hyderabad, Telangana, India; [email protected]
* Correspondence: [email protected]; Tel.:+91-9502586220
Received: 10 April 2019; Accepted: 24 April 2019; Published: 3 May 2019 Abstract:Genetic diversity of 130 forage-type hybrid parents of pearl millet was investigated based on multiple season data of morphological traits and two type of markers: SSRs (Simple sequence repeats) and GBS identified SNPs (Genotyping by sequencing-Single nucleotide polymorphism). Most of the seed and pollinator parents clustered into two clear-cut separate groups based on marker based genetic distance. Significant variations were found for forage related morphological traits at different cutting intervals (first and second cut) in hybrid parents. Across two cuts, crude protein (CP) varied from 11% to 15%, whilein vitroorganic matter digestibility (IVOMD) varied from 51% to 56%. Eighty hybrids evaluated in multi-location trial along with their parents for forage traits showed that significant heterosis can be realized for forage traits. A low but positive significant correlation found between SSR based genetic distance (GD between parents of hybrid) and heterosis for most of the forage traits indicated that SSR-based GD can be used for predicting heterosis for GFY, DFY and CP in pearl millet. An attempt was made to associate marker-based clusters with forage quality traits, to enable breeders select parents for crossing purposes in forage breeding programs.
Keywords: genetic diversity; markers; forage yield; crude protein;in vitroorganic matter digestibility
1. Introduction
Pearl millet (Pennisetum glaucum(L.) R. Br.) is an important staple crop in the arid and semi-arid tropical regions of Asia and Africa. This crop, being a C4species, is highly photosynthetically efficient, has a short duration coupled with significant levels of pest and disease resistance, and is tolerant to abiotic stresses (drought, heat & salinity). As such, it can be designated as a “perfect resilient crop for the future”. This crop is mainly cultivated for grain and fodder purpose in semi-arid regions of Asia and Africa, for which dual purpose cultivars are popular on farms. Apart from dual-purpose cultivars, pearl millet cultivars are also bred exclusively for forage purpose and cultivated across the globe. For instance, pearl millet forage hybrids are grown in southern USA [1,2] and in the summer season in Australia and South America [3]. Recently, it has occupied large areas under summer cultivation in north-western India and is proving to be significant source of fodder for livestock [4,5]. Also, Brazil which introduced this crop as cover crop in soybean cropping system, now cultivates 5 m ha of pearl millet for feed and forage purposes [6,7].
Agriculture2019,9, 97 2 of 21
Non-availability of feed and fodder in sufficient amounts has been one of the major limiting components to achieving the desired level of livestock production in most of the countries in the semi-arid tropics. For instance, India faces a net deficit of 35.6% green fodder, 10.95% of dry crop residues and 44% of concentrate feeds, and it would require 1012 million tons of green fodder and 631 million tons of dry fodder by 2050. At the current level of growth in forage production, there will be a 18.4% deficit in green fodder and 13.2% deficit in dry fodder by 2050 in India [8]. To overcome this projected deficit, green forage supply should grow in India an the annual rate of 1.69%. Breeding for forage traits has not been prioritized in most of the pearl millet programs across the globe, leading to a reduced diversity for forage cultivars, with only a handful of cultivars being available for cultivation. The pearl millet forage hybrids released to date have been bred generally for single cut forage purposes, but farmers are now demanding multi-cut (2–3 cuts) forage cultivars with better forage quality to meet round the year feed requirements of livestock [9]. Forage trials of pearl millet conducted multi-locationally during summer season in India, reported 10% to 16% higher dry stover yields than sorghum and 21% to 30% higher stover yields than maize; 45% to 64% and 30% to 58% higher stover protein was reported than sorghum and maize, respectively [10]. Significant variability has been observed in previous studies for forage quality traits in pearl millet breeding materials [11]. Also, based on evaluation of pearl millet accessions for biomass traits, high variability was reported for forage traits like green forage yield (GFY), dry forage yield (DFY), stover nitrogen content, metabolizable energy (ME) andin vitroorganic matter digestibility (IVOMD) [12].
To date, almost all the investigations on characterization of pearl millet (hybrid parents or other breeding materials) are either based on morphological traits or on molecular markers, and have primarily targeted grain yield and component traits [13–20]. A positive association has been reported between molecular marker-based GD and hybrid performance in pearl millet [20], while few studies have indicated a negative relationship [17,21]. Similarly, some studies found a positive relationship between molecular marker based genetic diversity and heterosis in other crops, like in maize [22,23], in rice [24,25] and in sunflower [26], while others reported no relationship between GD and heterosis in maize [27,28], in rice [29,30] and in sunflower [31]. Hence, the present study was designed to investigate genetic diversity in forage type hybrid parents based on both morphological traits and also using two different molecular marker systems (SSRs and GBS-identified SNPs markers), to reveal the relationship between marker based genetic diversity and heterosis for forage traits.
2. Materials and Methods 2.1. Plant Materials
A set of 130 hybrid parents derived from high biomass nursery (F6 and above) at ICRISAT (International Crops Research Institute for the Semi-Arid Tropics)-Patancheru, Hyderabad, Telangana, India, was investigated in this study. This included 18 seed parents and 112 pollinator parents, and all of them were derived from crosses involving diverse parents following pedigree breeding (Table S1). The seed parents were coded from FB01 (Forage B line) to FB18, while pollinator parents were coded from FP01 (Forage pollinator) to FP112. Tift 23D2B1, a maintainer of A1 CMS (cytoplasmic male sterility) bred at Tifton, Georgia [32,33] was used as a reference genotype.
2.2. DNA Isolation
Around thirty five seeds of each entry were grown in small plastic (4 inch) pots along with Tift 23D2B1in a dark house for eight days. Approximately 100 mg of bulk leaf tissue was collected from 20 to 25 seedlings per accessions and stored immediately in a 96-well plate. DNA was isolated using NucleoSpin®96 Plant II kit (Macherey-Nagel, Düren, Germany). Two elutions of DNA for SNP and SSR genotyping were generated. Normalization of genomic DNA to 10 ng/µL was done on 0.8% agarose gel using lamda DNA (MBI Fermentas, Hanover, MD, USA). Electrophoresis was performed
Agriculture2019,9, 97 3 of 21
in Tris acetate-EDTA buffer in a buffer tank at 90 volts for 1 h and gels were visualized by UV light using image analyzer after being stained with ethidium bromide.
2.3. Genotyping of Hybrid Parents 2.3.1. Simple Sequence Repeats
A total of 52 SSR markers (Table S2) were reported to be highly polymorphic, of which 47 were mapped earlier across 7 pearl millet linkage groups [34–38] and were used to genotype the set of forage type hybrid parents involved in this study.
2.3.2. Polymerase Chain Reaction
PCRs were performed using 10µL volumes of reaction mixture, containing 2µL of 10 ng DNA template, 0.5µL of 1 mM dNTPs, and 0.06µL of 0.2U Taq DNA polymerase, 1µL of 10×Kappa Taq Polymerase buffer with MgCl2, and 1µL of primer containing 2 pmol/µL of forward and 4 pmol/µL of reverse primer, 0.2µL of dye either Fam, Vic, Ned and Pet. PCR amplification was carried out using step-down program in a thermal cycler (GeneAmp, PCR System 9700; Applied Biosystems, Foster City, CA, USA) using 384-well PCR plates. The amplification conditions of initial denaturation at 94◦C for 5 min, 10 cycles at 94◦C for 25 s, 64◦C (−1◦C/cycles) for 20 s, and 72◦C for 30 s, followed by 37 cycles at 56◦C for 20 s, and 72◦C for 30 s, with a final extension at 72◦C for 20 min. After amplification, PCR products were multiplexed with 1µL of each of dye-labeled products (Fam, Vic, Ned and Pet), 7µL of Hi-Di™Formamide (Applied Biosystems, Foster City, California, CA, USA), 0.1µL of the LIZ-labeled (500[–250]) internal size standard, and 3.9µL of distilled water. The DNA fragments were size separated on an ABI 3700 automatic DNA sequencer (Perkin-Elmer/Applied Biosystems, Foster City, CA, USA) using Gene Mapper® 4.0 software and GeneScan 3.1 (Applied Biosystems, Foster City, CA, USA) was used for allele calling. AlleloBin 2.0 [39] was used to measure the accurate allele size.
2.3.3. Genotyping by Sequencing (GBS) and SNP Calling
Hybrid parents were also genotyped using the GBS method as described by Elshire et al. [40]. The genomic libraries were constructed using anApeKI endonuclease restriction enzyme. PCR amplification of pooled amplicons was carried out before sequencing on a Illumina Hiseq2500 platform (Illumina Inc., San Diego, CA, USA).
Raw sequencing reads and barcode information were processed with the non-reference based UNEAK (Universal Network Enabled Analysis Kit) pipeline [41] implemented in TASSEL V.4 software [42] to identify SNPs. Barcodes containing reads are retained and used for SNP calling. These reads are trimmed to 64 bp from barcode side, aligned against each other and used for SNP identification. Total of 19,652 SNPs were identified across all hybrid parents in pearl millet. Identified SNPs were assigned to each hybrid parents based on the barcode sequence information. Further, the SNP data were filtered with minor allele frequency (MAF) cutoffof 0.10 (10%) and SNP with≥25% missing data. After filtering for missing data and minor allele frequency, we obtained 7870 SNPs to conduct diversity analysis on our set of hybrid parents.
2.4. Phenotyping of Hybrid Parents
A set of 116 hybrid parents was evaluated for forage yield and quality traits in partially balanced alpha lattice design with two replications, at ICRISAT, Patancheru (18◦N, 78◦E, 545 m above sea level) during the summer season of 2015–2016. The plots consisted of 4 rows of 4 m in length spaced at 60 cm. During the time of field preparation, nitrogen and phosphorous were applied as a basal dose in the form of 100 kg ha−1of Diammonium phosphate (18% N and 46% P). Plots were fertilized equally with dosage rate of 100 kg ha−1of urea (46% N) as top dressing, two times before first harvest. Trial was irrigated at 12 to 15 days interval to avoid any moisture stress, and crop was protected from
Agriculture2019,9, 97 4 of 21
weeds, pests, animals and diseases. Green forage of each entry in the trial was first harvested at 50 days (around boot stage of plant development) after planting by cutting at the second node from the bottom of the plant. Fresh weight of the green forage was recorded (kg) for plot and converted into t ha−1. A sub-sample (10–15 plants) of about 1 kg was collected per entry from the freshly harvested green forage and recorded for green forage weight, oven-dried for 8 h daily for three to four days at 60◦C in Campbell dryer (Campbell Industries, Inc., 3201 Dean Avenue, Des Moines, IA, USA), and weighed again (dry forage weight in kg). The dry matter concentration was determined by the ratio between the dry forage weight and green forage weight. DFY (t ha−1) on a plot basis for each entry was calculated by multiplying the green forage weight and dry matter concentration. Dried sub-samples were chopped into 10 to 15 mm pieces using a chaff cutter (Model # 230, Jyoti Ltd., Vadodara, India) and ground using a Thomas Wiley mill (Model # 4, Philadephia, PA, USA) to pass through a 1-mm screen for chemical analysis. Ground stover samples (Approximately, 40 g of sample/entry) were analyzed by Near-Infrared Reflectance Spectroscopy (NIRS) for stover nitrogen concentration (N×6.25 equals to CP content) and IVOMD [43,44]. A second cut of forage was taken after thirty days of the first cut; GFY, DFY and stover quality traits were again recorded as described in the first cut.
2.5. Hybrid Development and Phenotypic Evaluation
Ten seed and eight pollinator parents from the set of 130 hybrid parental lines were selected based on diverse pedigrees (Table S1). This set of 18 hybrid parents effectively represented the genetic diversity of all the 130 lines, as GD of selected lines varied from 0.42 to 0.79 with a mean of 0.64, while GD of all the lines varied from 0.38 to 0.95 with a mean of 0.74. For SNPs, GD varied from 0.22 to 0.58 with a mean of 0.46 for selected hybrid parents, while GD of whole set of hybrid parents varied from 0.18 to 0.64 with a mean of 0.47. Eighty hybrids were generated by crossing them in a line×tester (10×8=80) fashion. These 80 hybrids and their parents were evaluated during summer season of 2015 at two locations [ICRISAT, Patancheru; and TNAU (Tamil Nadu Agricultural University), Coimbatore (11◦N, 77◦E, and 411.98 m above sea level, respectively)] for forage related morphological and quality traits. At ICRISAT, Patancheru, all entries were planted on alfisol in an alpha lattice design with three replications. Each entry was planted in 4 rows of 4 m length with rows spaced 60 cm apart and plants spaced at 10–12 cm from each other. At TNAU, Coimbatore, entries were planted in black soils with two replications. Each entry was planted in 3 rows, each of 2 m in length with rows spaced 45 cm apart. At both the locations, cultural practices were followed as described earlier under the head “phenotyping of hybrid parents”; and GFY, DFY, CP and IVOMD were again recorded as mentioned
under the same heading.
2.6. Data Analysis
One hundred and thirty high biomass forage type hybrid parents (18 seed and 112 pollinator parents), including all the 116 which were phenotyped, were analyzed for SSRs. In the case of GBS-identified SNPs, eight parents were dropped due to missing information, so 122 (18 seed and 104 pollinator parents) hybrid parents were analyzed using 7870 (GBS-identified SNPs) markers. The allelic base pairs of all the markers were used to estimate the summary statistics, which include PIC, allelic richness as determined by total number of detected alleles and allele per locus, gene diversity and heterozygosity. Gene diversity, which is often referred to as expected heterozygosity, is defined as the probability that two randomly chosen alleles from the population are different. An unbiased estimator of gene diversity at thelth is ˆDl =
1−Pk
u=1p2lu
/(1−1+f
n ), whereplu is the frequency of theuth allele at thelth locus,nis the sample size, and f is the inbreeding depression, respectively. Occurrence of common, unique, rare and most frequent alleles were estimated using PowerMarker V3.25 software [45]. Common alleles, unique alleles and rare alleles were calculated as described by Li et al. [46] and Upadhaya et al. [47].
The genetic dissimilarities for each pair of forage type hybrid parents using simple matching coefficient matrix (SSRs) and Roger’s distance matrix (GBS-identified SNPs) were calculated with
Agriculture2019,9, 97 5 of 21
the Power Marker V3.25 software. The simple match distance takes into account both the shared 0 s (absence of a band) and shared 1 s (presence of a band) as factors that contribute to similarity between two individuals. Simple matching distance was calculated asdi j = 1−1L
PL l=1
ml
π, wheredi j is the dissimilarity between unitsiandj,Lis the number of loci,πis ploidy andmlis the number of matching alleles for locusl, respectively. Rogers’s distance was calculated asDR= m1
Pm j q 1 2 Paj i pi j−qi j 2 pi j andqi jare the frequencies ofith allele at thejth locus in populations X and Y respectively, whileajis the number of alleles at thejth locus, andmis the number of loci examined. Hybrid parents (seed and pollinator) were grouped by cluster analysis using the neighbor-joining method in Power Marker V3.25 software. The pairwise Fstmethod was used to infer the clusters in a neighbor-joining tree. Analysis of molecular variance (AMOVA) was performed to detect mutational differences between the loci in diverse group of populations by partitioning the variation within and between the hybrid parents [48]. AMOVA analysis provided the Wright’s F statistic or Fst(Fixation index) based on genetic distance of the subgroups in both the marker systems. Association between hybrid parents were estimated with PCoA (Principal coordinate analysis) analysis using DARwin V6 software [49]. Mantel test was performed to investigate correlation between genetic distances estimated through SSRs and GBS-identified SNPs [50] based on 10,000 iterations using R software [51]. BLUP (Best Linear Unbiased Prediction) means were estimated for each of the 116 hybrid parents on the four traits evaluated and used for genetic relatedness based on forage traits using SAS v 9.4 [52].
Combined analysis of variance (ANOVA) for a hybrid estimation trial was estimated using SAS PROC MIXED [52]. The estimate of mid-parent and better parent heterosis for each trait was calculated from mean of two environments with the following formulae: Mid-parent heterosis (MPH, %)=(F1−MP)/MP×100; Better parent heterosis (BPH, %)=(F1−BP)/BP×100, where F1 (First filial hybrid) is the hybrid mean, MP (Mid-parent) is the mean of both the parents, and BP (Better parent) is the superior parent over the other parent. The Pearson correlation coefficients (r) between GD and heterosis (MPH and BPH) were estimated using across environment trait means.
3. Results
3.1. Genetic Diversity Indicators Based on SSRs and GBS-Identified SNPs
Fifty two SSR markers detected a total of 551 alleles in 130 hybrid parents, with an average of 10.60 alleles per locus. The number of alleles per locus ranged from 2 (Xpsmp2273) to 31 (Xpsmp2070), with three to ten alleles at 29 SSR loci (Table S3). Markers Xpsmp2068 (26),Xpsmp2081.1 (30) and Xpsmp2070 (31) had more than 20 alleles per locus. Furthermore, the average number of alleles per locus was higher for pollinator parents (9.81) than for seed parents (4.63) (Table1). The polymorphism information content (PIC) values varied from 0.06 (Xpsmp2267) to 0.94 (Xpsmp2070) with a mean of 0.65. Pollinator parents had higher PIC values (0.63) than seed parents (0.52). The gene diversity varied from 0.06 (Xpsmp2267) to 0.94 (Xpsmp2070) with an average of 0.68. Moreover, pollinator parents showed higher gene diversity (0.66) than seed parents (0.55). The level of heterozygosity ranged from 0.0 to 0.12, with an average of 0.02. Of the 551 alleles, 129 were rare alleles (23.41%) ranging from 1 to 13, 341 were common alleles (61.89%) ranging from 1 to 23, and 81 were most frequent alleles (14.70%) ranging from 1 to 3. Genotype-specific (unique) alleles were detected in 3 seed parents and 14 pollinator parents (Table S4).
The average gene diversity was 0.48, which varied from 0.02 to 0.50 for GBS-identified SNP markers. The range of heterozygosity was 0.0 to 0.97, with an average of 0.15, while PIC varied from 0.02 to 0.38, with an average of 0.37 (Table1).
Agriculture2019,9, 97 6 of 21
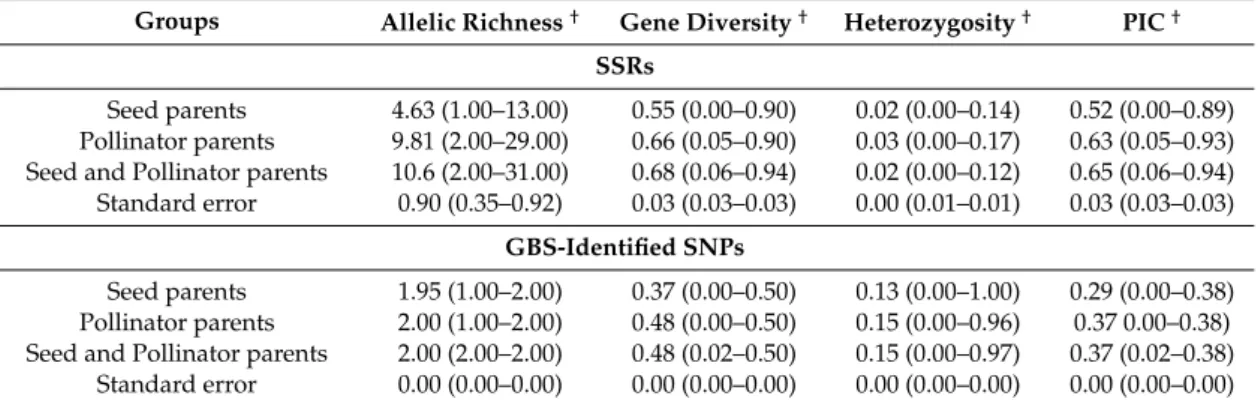
Table 1. Average of allelic richness, major allele frequency, gene diversity, heterozygosity and polymorphism information content (PIC) of the 52 SSRs and 7870 GBS-identified SNPs in hybrid parents of forage pearl millet.
Groups Allelic Richness†
Gene Diversity† Heterozygosity† PIC† SSRs Seed parents 4.63 (1.00–13.00) 0.55 (0.00–0.90) 0.02 (0.00–0.14) 0.52 (0.00–0.89) Pollinator parents 9.81 (2.00–29.00) 0.66 (0.05–0.90) 0.03 (0.00–0.17) 0.63 (0.05–0.93) Seed and Pollinator parents 10.6 (2.00–31.00) 0.68 (0.06–0.94) 0.02 (0.00–0.12) 0.65 (0.06–0.94) Standard error 0.90 (0.35–0.92) 0.03 (0.03–0.03) 0.00 (0.01–0.01) 0.03 (0.03–0.03)
GBS-Identified SNPs
Seed parents 1.95 (1.00–2.00) 0.37 (0.00–0.50) 0.13 (0.00–1.00) 0.29 (0.00–0.38) Pollinator parents 2.00 (1.00–2.00) 0.48 (0.00–0.50) 0.15 (0.00–0.96) 0.37 0.00–0.38) Seed and Pollinator parents 2.00 (2.00–2.00) 0.48 (0.02–0.50) 0.15 (0.00–0.97) 0.37 (0.02–0.38) Standard error 0.00 (0.00–0.00) 0.00 (0.00–0.00) 0.00 (0.00–0.00) 0.00 (0.00–0.00) †
Allelic richness, Genetic diversity, Heterozygosity and PIC value ranges for the seed and pollinator parents are given in the parentheses, respectively.
3.2. Clustering Pattern and Genetic Relatedness between Hybrid Parents Based on Markers
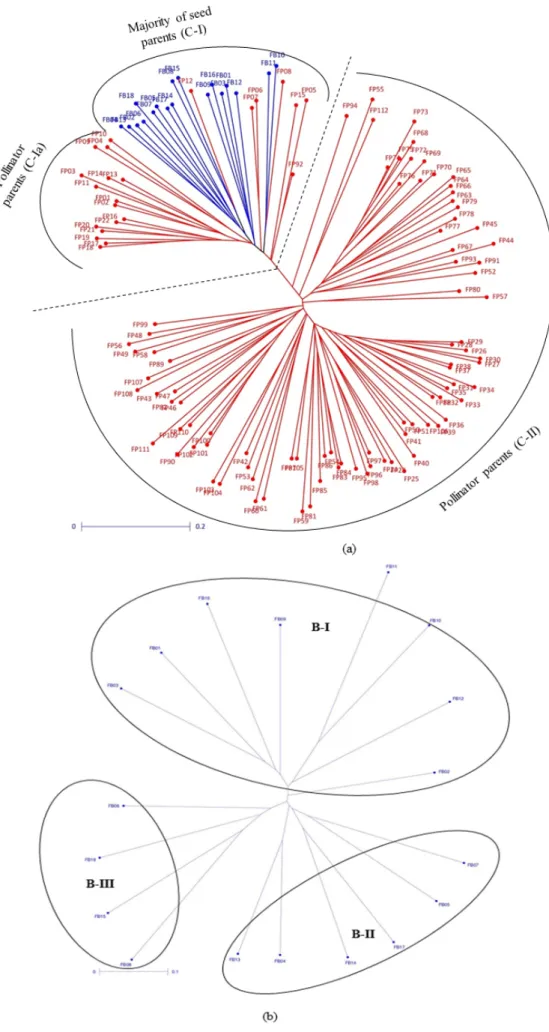
The neighbor-joining tree constructed based on simple matching (SSR based) distance matrix grouped all of the seed and pollinator parents into 2 clear-cut separate groups (statistical significance values provided in Table S5) (Figure1a), each having majority of seed and pollinator hybrid parents. These broad groups were found to be partitioned further into three and four statistically distinct clusters of seed and pollinator parents, respectively (Tables S6 and S7). Twenty three pollinator parents were found grouped in clusters dominated by seed parents, of which only 7 were found clustered with seed parents, while 16 pollinators were grouped separately. Eight B-lines were found in B-I (44%), 6 in B-II (33%) and 4 in B-III (22%) (Figure1b and Table S1). Cluster B-II had 67% (4 out of 6) of the lines derived directly or indirectly from ICMB 89111 (ICRISAT millet B-line) in their parentage. B-III cluster had 50% (2 out of 4) of the lines sharing 81B in parentage.
Pollinator parents found grouped into four clusters (Figure1c and Table S1), of these 45 lines in R-I (40%), 24 in R-II (21%), 30 in R-III (27%) and 13 (12%) in R-IV. Twenty six out of 45 and 16 out of 24 pollinator parents in cluster I and II respectively, had ICMS 7704 (ICRISAT millet synthetic variety) in their parentage. ICMS 7704 is an open-pollinated variety developed from six inbred lines derived from Indian×African crosses selected at Tandojam in Pakistan. Seventeen out of 30 lines in R-III cluster had progenies derived from Medium composite 94 (MC 94) in their parentage; MC 94 is a medium maturity (75–85 days) composite developed at ICRISAT. R-IV cluster had 42% (5 out of 12) of the progenies sharing a common parent ICMS 8506.
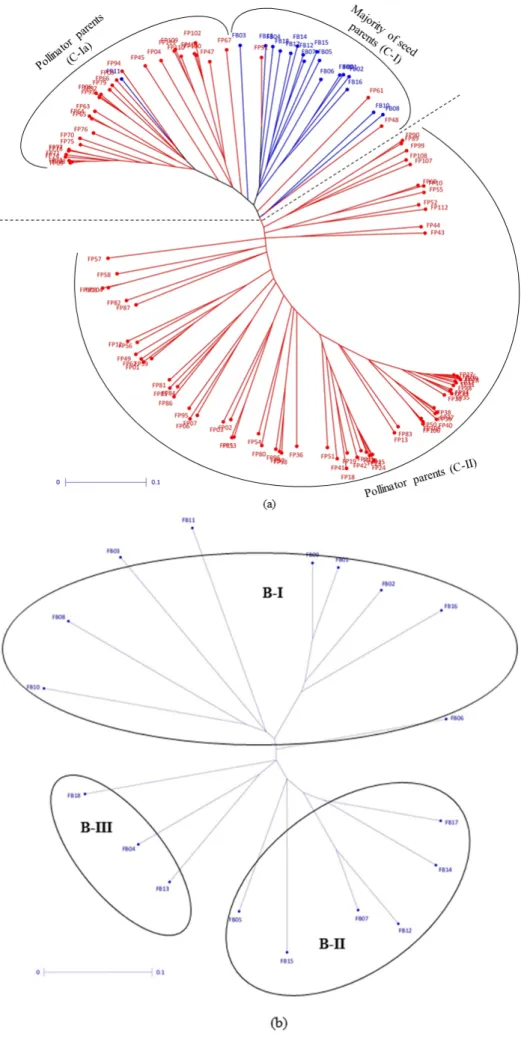
Seed and pollinator parents followed almost the same clustering pattern based on both GBS-identified SNPs and SSRs (Figure2a and Table S1) (Statistical significance values depicting distinctness of clusters provided in Tables S8–S10). Based on SNP based clustering, thirty-three pollinators were found grouped in clusters dominated by seed parents, but 30 of them were found to be grouped separately. SNP based clustering followed the same trend of pedigree linkages as found in case of SSRs; 33% (2 out of 6) and 67% (2 out of 3) of the lines in B-II and B-III respectively, had the ICMB 89111 parent (Figure2b), while cluster R-I and R-II had 80% and 48% of the lines with ICMS 7704 respectively, and R-III had 57% (17 out of 30) of the lines with MC 94 in the parentage (Figure2c).
Agriculture2019,9, 97 7 of 21
Agriculture 2019, 8, x FOR PEER REVIEW 7 of 24
Agriculture 2019, 8, x FOR PEER REVIEW 8 of 24
AgricultureAgriculture 20192019,9, 97, 8, x FOR PEER REVIEW 9 of 24 8 of 21
Figure 1. Neighbor joining tree based on 52 SSRs: (a) 130 seed and pollinator parents; (b) 18 seed parents; and (c) 112 pollinator parents.
Seed and pollinator parents followed almost the same clustering pattern based on both GBS-identified SNPs and SSRs (Figure 2a and Table S1) (Statistical significance values depicting distinctness of clusters provided in Tables S8–S10). Based on SNP based clustering, thirty-three pollinators were found grouped in clusters dominated by seed parents, but 30 of them were found to be grouped separately. SNP based clustering followed the same trend of pedigree linkages as found in case of SSRs; 33% (2 out of 6) and 67% (2 out of 3) of the lines in B-II and B-III respectively, had the ICMB 89111 parent (Figure 2b), while cluster R-I and R-II had 80% and 48% of the lines with ICMS 7704 respectively, and R-III had 57% (17 out of 30) of the lines with MC 94 in the parentage (Figure 2c).
Figure 1. Neighbor joining tree based on 52 SSRs: (a) 130 seed and pollinator parents; (b) 18 seed parents; and (c) 112 pollinator parents.
AMOVA based on SSRs showed 83.62% of the variance within seed and pollinator parents and 16.38% between seed and pollinator parents (p<0.0001). The Fstbetween seed and pollinator parents for individual markers varied from−0.0126 to 0.5381 and was significant for 41 of the 52 SSRs (Table S11). Some of the markers such asXpsmp2201 (0.2567),Xipes0105 (0.2574),Xipes0004 (0.3227),Xipes0186 (0.3351),Xpsmp2214 (0.3445),Xicmp3048 (0.4848),Xpsmp2222 (0.5294) andXpsmp2246 (0.5381) had the highest Fstvalues. Following the same trend, SNPs revealed 90.11% of the variance within seed and pollinator parents and 9.89% variance was observed between seed and pollinator parents (Table S12). PCoA based on SSR markers revealed first and second principal coordinates to account for 14.57% and 6.21% of the molecular variance, respectively (Table S13 and Figure S1a), while it was 33.63% and 7.74% based on the GBS-identified SNPs (Figure S1b). The Mantel test found significant association (r=0.35,p<0.01) between genetic distances (Simple matching distance for SSRs vs. Roger’s distance for SNPs) estimated for hybrid parents.
Agriculture2019,9, 97 9 of 21 Agriculture 2019, 8, x FOR PEER REVIEW 10 of 24
Agriculture 2019, 8, x FOR PEER REVIEW 11 of 24
Agriculture2019,9, 97 10 of 21
Agriculture 2019, 8, x FOR PEER REVIEW 12 of 24
Figure 2. Neighbor joining tree based on 7870 GBS-identified SNPs: (a) 122 seed and pollinator parents; (b) 18 seed parents; and (c) 104 pollinator parents.
AMOVA based on SSRs showed 83.62% of the variance within seed and pollinator parents and 16.38% between seed and pollinator parents (p < 0.0001). The Fst between seed and pollinator parents
for individual markers varied from −0.0126 to 0.5381 and was significant for 41 of the 52 SSRs (Table S11). Some of the markers such as Xpsmp2201 (0.2567), Xipes0105 (0.2574), Xipes0004 (0.3227),
Xipes0186 (0.3351), Xpsmp2214 (0.3445), Xicmp3048 (0.4848), Xpsmp2222 (0.5294) and Xpsmp2246 (0.5381) had the highest Fst values. Following the same trend, SNPs revealed 90.11% of the variance
within seed and pollinator parents and 9.89% variance was observed between seed and pollinator parents (Table S12). PCoA based on SSR markers revealed first and second principal coordinates to account for 14.57% and 6.21% of the molecular variance, respectively (Table S13 and Figure S1a), while it was 33.63% and 7.74% based on the GBS-identified SNPs (Figure S1b). The Mantel test found significant association (r = 0.35, p < 0.01) between genetic distances (Simple matching distance for SSRsvs.Roger’s distance for SNPs) estimated for hybrid parents.
3.3. Variability for Forage Traits in Hybrid Parents
Figure 2.Neighbor joining tree based on 7870 GBS-identified SNPs: (a) 122 seed and pollinator parents; (b) 18 seed parents; and (c) 104 pollinator parents.
3.3. Variability for Forage Traits in Hybrid Parents
A wide range was observed in hybrid parents for GFY, DFY, CP and IVOMD at different cutting intervals (Table2). GFY of hybrid parents at first cut ranged from 15 to 29 t ha−1with an average of 22 t ha−1, seed parents ranged from 16 to 23 t ha−1with an average of 20 t ha−1and pollinator parents ranged from 15 to 29 t ha−1with an average of 22 t ha−1. In addition, DFY varied from 3 to 6 t ha−1 with an average of 4 t ha−1for hybrid parents, from 4 to 5 t ha−1with an average of 4 t ha−1for seed parents and from 3 to 6 t ha−1with an average of 4 t ha−1for pollinator parents. At the second cut, GFY of hybrid parents ranged from 12 to 42 t ha−1with an average of 27 t ha−1, seed parents ranged from 12 to 26 t ha−1with an average of 20 t ha−1and pollinator parents ranged from 16 to 42 t ha−1 with an average of 28 t ha−1. Further, DFY varied from 5 to 9 t ha−1with an average of 6 t ha−1for both seed and pollinator parents, from 5 to 9 t ha−1with an average of 6 t ha−1for seed parents and from 5 to 8 t ha−1with an average of 6 t ha−1
for pollinator parents. CP for hybrid parents, seed and pollinator parents ranged from 11% to 15%, 12% to 15% and 11% to 14% at the first cut, whereas it was 11% to 13%, 11% to 12% and 11% to 13% for second cut. IVOMD for hybrid parents ranged from 54% to 56%
Agriculture2019,9, 97 11 of 21
at the first cut, while it ranged from 51% to 55% at the second cut. Seed parents varied from 54% to 55% at first cut and 51 to 54% at second cut, and pollinator parents varied from 54% to 56% and 51% to 55% at the first and second cuts, respectively.
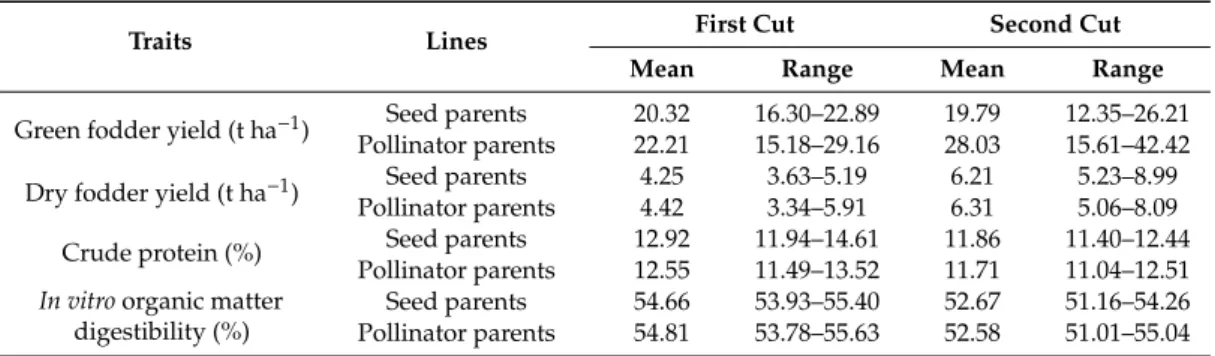
Table 2.Mean and range of forage traits of 116 hybrid parents from 2 years mean data (summer 2015 and 2016).
Traits Lines First Cut Second Cut
Mean Range Mean Range
Green fodder yield (t ha−1) Seed parents 20.32 16.30–22.89 19.79 12.35–26.21
Pollinator parents 22.21 15.18–29.16 28.03 15.61–42.42
Dry fodder yield (t ha−1
) Seed parents 4.25 3.63–5.19 6.21 5.23–8.99
Pollinator parents 4.42 3.34–5.91 6.31 5.06–8.09
Crude protein (%) Seed parents 12.92 11.94–14.61 11.86 11.40–12.44
Pollinator parents 12.55 11.49–13.52 11.71 11.04–12.51
In vitroorganic matter digestibility (%)
Seed parents 54.66 53.93–55.40 52.67 51.16–54.26
Pollinator parents 54.81 53.78–55.63 52.58 51.01–55.04
3.4. Trait Association with SSRs Based Clusters
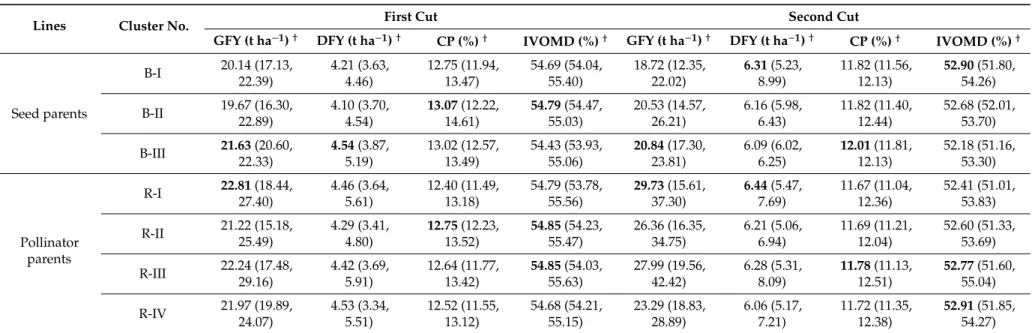
Forage quantity and quality traits associated with SSRs based clusters revealed that B-III cluster had the highest mean values for GFY and DFY at the first cut and the highest GFY at the second cut, while DFY at second cut was found highest in cluster B-I (Table3). Meanwhile for pollinator parent clusters, R-I had highest mean for GFY at first cut and for GFY and DFY at second cut. Cluster B-II had highest CP and IVOMD in first cut; while B-III had highest CP in second cut. Cluster R-II and R-III had the highest CP in the first and second cut, respectively. For seed parental clusters, B-I had the highest IVOMD in the second cut. Cluster R-II and R-III had the highest IVOMD in the first cut and R-IV in the second cut.
3.5. ANOVA for Heterosis Estimation Trial
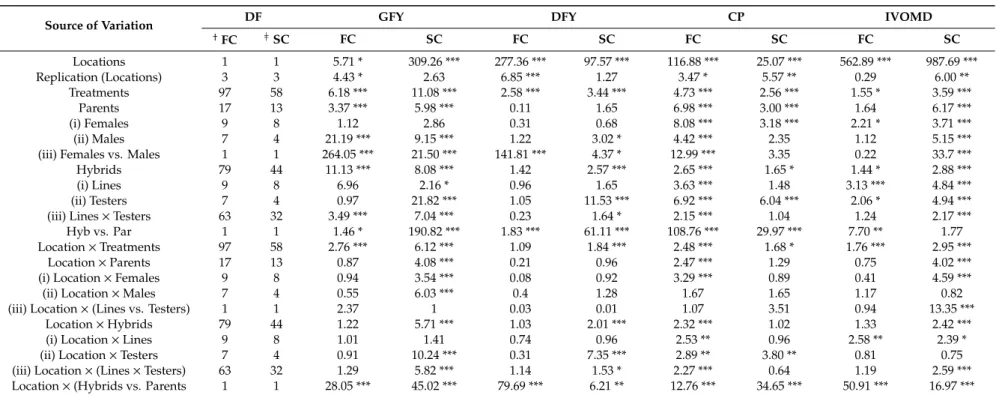
ANOVA for forage yield and quality (Table4) traits showed large and highly significant variance due to locations, indicating that the materials were evaluated under diverse environments. Large and highly significant variance observed in either of the parents (seed or pollinator parent) and in hybrids for almost all the traits indicated wide genetic differences among parental lines as well as among hybrids. High significant mean squares due to “hybrids vs. parents” (except IVOMD in second cut) indicated significant heterosis in hybrids for most of the forage traits. Forage yield performance of both parental lines and hybrids (except for DFY in first cut) was significantly modified by environments. The significant and relatively large percentage of the total variation attributable to the G×E (Genotype×Environment) suggested that hybrids responded differentially to environments for forage traits.
Agriculture2019,9, 97 12 of 21
Table 3.Mean values for forage traits in different SSR-based clusters on the basis of 2 year data (Summer season at ICRISAT, 2015 and 2016).
Lines Cluster No. First Cut Second Cut
GFY (t ha−1)† DFY (t ha−1)† CP (%)† IVOMD (%)† GFY (t ha−1)† DFY (t ha−1)† CP (%)† IVOMD (%)†
Seed parents B-I 20.14 (17.13, 22.39) 4.21 (3.63, 4.46) 12.75 (11.94, 13.47) 54.69 (54.04, 55.40) 18.72 (12.35, 22.02) 6.31(5.23, 8.99) 11.82 (11.56, 12.13) 52.90(51.80, 54.26) B-II 19.67 (16.30, 22.89) 4.10 (3.70, 4.54) 13.07(12.22, 14.61) 54.79(54.47, 55.03) 20.53 (14.57, 26.21) 6.16 (5.98, 6.43) 11.82 (11.40, 12.44) 52.68 (52.01, 53.70) B-III 21.63(20.60, 22.33) 4.54(3.87, 5.19) 13.02 (12.57, 13.49) 54.43 (53.93, 55.06) 20.84(17.30, 23.81) 6.09 (6.02, 6.25) 12.01(11.81, 12.13) 52.18 (51.16, 53.30) Pollinator parents R-I 22.81(18.44, 27.40) 4.46 (3.64, 5.61) 12.40 (11.49, 13.18) 54.79 (53.78, 55.56) 29.73(15.61, 37.30) 6.44(5.47, 7.69) 11.67 (11.04, 12.36) 52.41 (51.01, 53.83) R-II 21.22 (15.18, 25.49) 4.29 (3.41, 4.80) 12.75(12.23, 13.52) 54.85(54.23, 55.47) 26.36 (16.35, 34.75) 6.21 (5.06, 6.94) 11.69 (11.21, 12.04) 52.60 (51.33, 53.69) R-III 22.24 (17.48, 29.16) 4.42 (3.69, 5.91) 12.64 (11.77, 13.42) 54.85(54.03, 55.63) 27.99 (19.56, 42.42) 6.28 (5.31, 8.09) 11.78(11.13, 12.51) 52.77(51.60, 55.04) R-IV 21.97 (19.89, 24.07) 4.53 (3.34, 5.51) 12.52 (11.55, 13.12) 54.68 (54.21, 55.15) 23.29 (18.83, 28.89) 6.06 (5.17, 7.21) 11.72 (11.35, 12.38) 52.91(51.85, 54.27) †
Average values; minimum and maximum values in parenthesis, respectively, of the trait within the cluster, Values are in bold indicates higher mean value for the trait, GFY-Green forage yield, DFY-Dry forage yield, CP-Crude protein, IVOMD-In vitroorganic matter digestibility.
Agriculture2019,9, 97 13 of 21
Table 4.Analysis of variance for combining ability for forage related morphological and biochemical traits at first and second cut, evaluated in hybrids and parental trial at two locations in summer season of 2015.
Source of Variation DF GFY DFY CP IVOMD
† FC }SC FC SC FC SC FC SC FC SC Locations 1 1 5.71 * 309.26 *** 277.36 *** 97.57 *** 116.88 *** 25.07 *** 562.89 *** 987.69 *** Replication (Locations) 3 3 4.43 * 2.63 6.85 *** 1.27 3.47 * 5.57 ** 0.29 6.00 ** Treatments 97 58 6.18 *** 11.08 *** 2.58 *** 3.44 *** 4.73 *** 2.56 *** 1.55 * 3.59 *** Parents 17 13 3.37 *** 5.98 *** 0.11 1.65 6.98 *** 3.00 *** 1.64 6.17 *** (i) Females 9 8 1.12 2.86 0.31 0.68 8.08 *** 3.18 *** 2.21 * 3.71 *** (ii) Males 7 4 21.19 *** 9.15 *** 1.22 3.02 * 4.42 *** 2.35 1.12 5.15 ***
(iii) Females vs. Males 1 1 264.05 *** 21.50 *** 141.81 *** 4.37 * 12.99 *** 3.35 0.22 33.7 ***
Hybrids 79 44 11.13 *** 8.08 *** 1.42 2.57 *** 2.65 *** 1.65 * 1.44 * 2.88 ***
(i) Lines 9 8 6.96 2.16 * 0.96 1.65 3.63 *** 1.48 3.13 *** 4.84 ***
(ii) Testers 7 4 0.97 21.82 *** 1.05 11.53 *** 6.92 *** 6.04 *** 2.06 * 4.94 ***
(iii) Lines×Testers 63 32 3.49 *** 7.04 *** 0.23 1.64 * 2.15 *** 1.04 1.24 2.17 ***
Hyb vs. Par 1 1 1.46 * 190.82 *** 1.83 *** 61.11 *** 108.76 *** 29.97 *** 7.70 ** 1.77
Location×Treatments 97 58 2.76 *** 6.12 *** 1.09 1.84 *** 2.48 *** 1.68 * 1.76 *** 2.95 ***
Location×Parents 17 13 0.87 4.08 *** 0.21 0.96 2.47 *** 1.29 0.75 4.02 ***
(i) Location×Females 9 8 0.94 3.54 *** 0.08 0.92 3.29 *** 0.89 0.41 4.59 ***
(ii) Location×Males 7 4 0.55 6.03 *** 0.4 1.28 1.67 1.65 1.17 0.82
(iii) Location×(Lines vs. Testers) 1 1 2.37 1 0.03 0.01 1.07 3.51 0.94 13.35 ***
Location×Hybrids 79 44 1.22 5.71 *** 1.03 2.01 *** 2.32 *** 1.02 1.33 2.42 ***
(i) Location×Lines 9 8 1.01 1.41 0.74 0.96 2.53 ** 0.96 2.58 ** 2.39 *
(ii) Location×Testers 7 4 0.91 10.24 *** 0.31 7.35 *** 2.89 ** 3.80 ** 0.81 0.75
(iii) Location×(Lines×Testers) 63 32 1.29 5.82 *** 1.14 1.53 * 2.27 *** 0.64 1.19 2.59 ***
Location×(Hybrids vs. Parents 1 1 28.05 *** 45.02 *** 79.69 *** 6.21 ** 12.76 *** 34.65 *** 50.91 *** 16.97 ***
DF-Degree of freedom;†
First cut;}Second cut, GFY-Green forage yield (t ha−1
), DFY-Dry forage yield (t ha−1
), CP-Crude protein (%), IVOMD-In vitroorganic matter digestibility (%). *, **, *** Significant at 0.05, 0.01 and 0.001 level, respectively.
Agriculture2019,9, 97 14 of 21
3.6. Magnitude of Heterosis and Its Association with GD
The extent of MPH and BPH for forage quantity and quality traits over two cuts are presented in Table5. The MPH for DFY ranged from 33% to 407%, with an average of 189%, while BPH ranged from −13% to 344%, with an average of 154% at the first cut. Similarly, MPH for IVOMD ranged from−7% to 7%, with an average of 2%, while BPH ranged from−8% to 7% at first cut. The correlation between SSR based GD and heterosis (MPH and BPH) for forage related morphological and quality traits are given in Table6. Low positive correlation was observed between GD and MPH (r=0.34,p<0.05), and with BPH (r=0.41,p<0.05) for GFY at the second cut; GD and BPH (r=0.33,p<0.05) for DFY at the second cut and; GD and MPH (r=0.26,p<0.05) for CP at the first cut. No significant correlation was found between GD and heterosis (both MPH and BPH) for IVOMD for both the cuts. Similarly, for SNPs, significant positive relationships were found between GD and MPH (r=0.32,p<0.01) and with BPH (r=0.28,p<0.05) for DFY at the first cut.
Table 5.Summary of MPH and BPH for forage linked traits.
Traits Cutting Intervals
Mid-Parent Heterosis (%) Better-Parent Heterosis (%) Minimum Maximum Average Minimum Maximum Average
GFY Second cutFirst cut −20.622.2 115.7378.1 103.858.2 −−37.08.2 301.974.4 32.651.5 DFY Second cutFirst cut −33.115.5 406.5290.0 189.193.2 −−13.129.7 344.3248.2 154.250.7
CP First cut −23.6 9.8 −9.5 −27.8 8.8 −14.4
Second cut −24.1 7.2 −7.8 −30.7 4.5 −12.8
IVOMD Second cutFirst cut −−6.87.5 7.15.9 1.80.0 −−10.88.2 6.73.4 −0.12.9 GFY-Green forage yield (t ha−1
), DFY-Dry forage yield (t ha−1
), CP-Crude protein (%), IVOMD-In vitroorganic matter digestibility (%).
Table 6.Correlation between genetic distance (GD) between parents measured using SSRs and SNPs and heterosis (Mid-parent heterosis (MPH) and Better-parent heterosis (BPH)) for forage yield and quality traits in pearl millet.
Traits Cutting Intervals
Correlation Coefficient between GD and MPH
Correlation Coefficient between GD and BPH
SSRs SNPs SSRs SNPs
Green forage yield (GFY, t ha−1) First cut 0.11 −0.02 0.12 −0.15
Second cut 0.34 * 0.15 0.41 * 0.13
Dry forage yield (DFY, t ha−1) First cut −0.10 0.32 ** −0.14 0.28 *
Second cut 0.25 0.19 0.33 * 0.19
Crude protein (CP, %) First cut 0.26 * 0.04 0.20 −0.12
Second cut −0.05 −0.22 −0.02 −0.19
In vitroorganic matter digestibility (IVOMD, %)
First cut 0.11 0.00 0.18 −0.01
Second cut −0.18 0.06 −0.17 0.11
*, ** Significant at 0.05 and 0.01 level, respectively.
4. Discussion
The average number of alleles per locus (10.60) detected in this study was higher than earlier reports in pearl millet, 6.26 alleles per locus in 72 inbred lines [53] and 2.76 alleles per locus in 42 inbred lines [54]. These differences might be due to the lesser number of parental lines and limited number of SSRs (25 to 34) in those earlier conducted studies on grain type hybrid parents, whereas the current study had a higher number of diverse forage type hybrid parents (130) and also had a higher number of microsatellite markers (52 SSRs). However, it was still lower in comparison to other studies, like of
Agriculture2019,9, 97 15 of 21
Stich et al. [13] (16.4 alleles per locus in 145 inbred lines derived from landraces and open-pollinated varieties of West and Central Africa) and Gupta et al. [15] (12.68 alleles per locus in 379 inbred lines), which might be due to the involvement of a comparatively lesser number of hybrid parents (130) in this study. The present study detected a higher average number of alleles per locus, PIC and gene diversity in pollinator parents than seed parents, indicating that pollinator parents were genetically more diverse than seed parents. This might be due to the broader genetic base of germplasm used in the development of pollinator parents and also due to differences in the sample size (112 pollinator parents vs. 18 seed parents). These findings are in consonance with earlier investigations in pearl millet [14,15], which reported high diversity in pollinator parents than in seed parents.
Majority of seed and pollinator parents delineated into two separate groups based on SSRs. Similar kinds of clear cut separate seed and pollinator grouping patterns were reported earlier in pearl millet [14,15] and in rice [55]. Distributions of hybrid parents under study into different marker-based groups indicated presence of significant genetic diversity in the breeding materials. Also, most of parents found in the common cluster had the involvement of some common parent in the pedigree. Such genetic relatedness between hybrid parents as found in SSR based clusters was also reported earlier by Nepolean et al. [14] and Gupta et al. [15] in pearl millet hybrid parents bred for grain-type traits. The clustering pattern of hybrid parents and trend of involvement of common parents in parentage of lines in different clusters were almost similar for both type of marker systems, which might be due to significant positive correlation (r=0.35,p<0.01) found between parental genetic distance assessed using SSRs and GBS-identified SNPs markers. However, seed parental cluster B-III had 81B and ICMB 89111 in their parentage for SSRs and GBS-identified SNPs, respectively. Pollinator parents were grouped into four (SSRs) and five (SNPs) clusters, respectively. Pollinator parental group R-IV (SSR) had the lines sharing ICMS 8506 in parentage while SNP based R-IV had HHVBC tall in their parentage. Hence, our study suggested that any of the two marker systems, SSRs or SNPs, can be effectively used for diversity investigations for forage type pearl millet breeding materials in future. High correlation between genetic distances estimated by SSRs and SNPs was also reported earlier in sunflower [56], while no such correlation was found in maize [57,58].
The study revealed significant genetic variability for forage quantity and quality traits in hybrid parents under investigation. Several other studies have also reported a wide range of green forage yield in pearl millet [12,59–62]. Earlier, Rai et al. [63] also reported dry forage yield in hybrid parents in a range of 3 to 4 t ha−1at the first cut. Stover CP varied from 11% to 15% and 11% to 13% at the first and second cut, respectively, which was more than the minimum (about 7%) required by rumen microbes [64]. The observed genotypic variations in crude protein in high biomass hybrid parents in this study can also help to enhance the capacity of feed intake, as suggested earlier by Van Soest [64]. The mean values observed for forage quality traits (CP and IVOMD) at the first and second cuts were higher than observed in previous studies in pearl millet [11,12,44,63,65,66] and also in several other crops, like in maize [67,68] and in sorghum [69]. Variability in IVOMD assumes high significance as a one-percent unit increase in digestibility in stover sorghum and pearl millet could result in increases in milk, meat and draught power outputs in a range from 6% to 8% [70]. Market studies on sorghum fodder also indicated that the pricing of fodder is affected by its quality traits, especially for IVOMD [71]. In hybrid parents involved in this study, stover IVOMD varied from 54% to 56% units at first cut, and from 51% to 55% in second cut. Such a wide range of IVOMD in forage type hybrid parental lines can be utilized in the breeding program for the development of quality cultivars with high digestibility.
Mean values of forage traits in SSR based clusters revealed significant variation across clusters. The study identified trait-specific clusters; such associations between marker-based clusters and forage traits might be due to a close association of markers under investigation with the specific forage trait. This study has not done association mapping between markers and forage traits, so the associations observed in this study might be the result of stratification rather than true association, but diverse
Agriculture2019,9, 97 16 of 21
hybrid parents from these trait-specific clusters can still provide inputs to breeders for utilization in forage trait-specific targeted breeding program.
Hybrids showed an average heterosis of 154% and 51% over better parent for DFY in the first and second cut, respectively, indicating that higher heterosis can be realized for forage traits in pearl millet. These results pointed that high yielding multi-cut forage type hybrids with better forage quality can be developed in pearl millet for enhancing livestock productivity [63,65]. However, a high G×E for forage traits in hybrids indicated that there is a need to breed agro-ecological specific forage type hybrids to have stable forage yields. Significant but low positive correlation was found between GD and heterosis for most of the forage quality traits in either first or second cut, suggesting that SSR-based GD can be used for predicting heterosis for GFY, DFY and CP in pearl millet. Again, SNPs based GD also found a significant association with heterosis for DFY. In contrast to our results, Gupta et al. [17] found no significant positive correlation with BPH for DFY in either of morphological or molecular distance in pearl millet. Low correlation between GD and heterosis might be due to a lack of linkage between genes for traits under investigation, unequal genome coverage, and random marker distribution in the genome [72,73].
5. Conclusions
In conclusion, this molecular marker based genetic diversity study indicated that available forage-type pearl millet hybrid parents exist as two separate gene pools, one each for seed and pollinator parents. Significant genetic diversity exists among parents for forage quantity and quality traits. The study also attempted to find associations between marker-based clustering patterns and forage quantity and quality traits, to enable breeders to generate crosses among diverse forage type hybrid parents belonging to distinct clusters and develop hybrids and parental lines with higher potential. High heterosis observed for forage quality traits indicated possibilities to develop exclusive forage type hybrids with more and better forage quality. Low positive but significant correlation between markers based genetic distance and heterosis for most of the forage traits indicated that forage traits can be predicted to some extent in pearl millet.
Supplementary Materials: The following are available online at http://www.mdpi.com/2077-0472/9/5/97/s1, Figure S1: Principal coordinate analysis of seed and pollinator parents based on (a) SSRs and (b) GBS-identified SNPs, Table S1: Pedigree of 130 forage type hybrid parents, cluster numbers based on SSR and SNP markers, and selected parents for hybrid development used in the current study, Table S2: List of markers (Forward/Reverse primer), linkage group and repeat motifs of 52 SSRs used in the study, Table S3: Allelic richness, Polymorphism Information Content (PIC), gene diversity and heterozygosity of the 52 SSRs in 18 seed parents and 112 restorer parents of forage type pearl millet, Table S4: Genotype-specific alleles present in 3 seed parents and 14 pollinator parents of forage pearl millet, Table S5: Pairwise Fst values for 130 hybrid (18 seed and 112 pollinator) parents grouped based on SSRs, Table S6: Pairwise Fst values for 18 seed parents grouped based on SSRs, Table S7: Pairwise Fst values for 112 pollinator parents grouped based on SSRs, Table S8: Pairwise Fst values for 122 hybrid (18 seed and 104 pollinator) parents grouped based on GBS-identified SNPs, Table S9: Pairwise Fst values for 18 seed parents grouped based on GBS-identified SNPs, Table S10: Pairwise Fst values for 104 pollinator parents grouped based on GBS-identified SNPs, Table S11: Significant test values for Fst from Analysis of molecular variance (AMOVA) for 52 SSRs, Table S12: Analysis of molecular variance of SSRs and GBS-identified SNPs, Table S13: Principal coordinate analysis estimated percentage of variation explained by two axes using SSRs and GBS-identified SNPs.
Author Contributions:S.K.G., M.M., S.P. and M.B. designed the experiments. A.R. and R.R.D. helped in data analysis. M.B. involved in phenotyping for forage quality traits by NIRS. P.G.G.P. and S.K.G. wrote the paper. M.M. and S.P. reviewed the manuscript. All authors read and approved the final manuscript.
Funding:Financial support of the project was provided by the ICRISAT-Pearl Millet Hybrid Parents Research Consortium (PMHPRC) and conducted under CGIAR, Research Program on Dryland Cereals to the first author to carry out this research work as a part of doctoral program.
Acknowledgments: This research work was carried out as part of a Ph.D. thesis of Govintharaj, submitted to Tamil Nadu Agricultural University, Coimbatore, Tamil Nadu. It was financially supported by the ICRISAT-Pearl Millet Hybrid Parents Research Consortium (PMHPRC) and conducted under CGIAR, Research Program on Dryland Cereals. We also acknowledge Mahender Thudi from the ICRISAT-CEG for his assistance in lab work. We also thank K.V.S. Prasad and Ramakrishna Reddy from ICRISAT-ILRI for sample preparation and NIRS analysis.
Agriculture2019,9, 97 17 of 21
Conflicts of Interest:The authors declare no conflict of interest.
Abbreviations
SSR Simple sequence repeats GBS Genotyping by sequencing SNP Single nucleotide polymorphism
GFY Green forage yield
CP Crude protein
IVOMD In vitroorganic matter digestibility NIRS Near infra-red reflectance spectroscopy
GD Genetic distance
DFY Dry forage yield
ME Metabolizable energy
ICRISAT International Crops Research Institute for the Semi-Arid Tropics
FB Forage B line
FP Forage pollinator
CMS Cytoplasmic male sterility PCR Polymerase chain reaction
UNEAK Universal Network Enabled Analysis Kit MAF Minor allele frequency
TNAU Tamil Nadu Agricultural University AMOVA Analysis of molecular variance
Fst Fixation index
PCoA Principal coordinate analysis BLUP Best Linear Unbiased Prediction ANOVA Analysis of variance
MPH Mid-parent heterosis
BPH Better parent heterosis
MP Mid parent
BP Better parent
F1 First filial hybrid
PIC Polymorphism information content ICMB ICRISAT millet B-line
ICMS ICRISAT millet synthetic composite variety
MC Medium composite
G×E Genotype×Environment References
1. Burton, G. History of hybrid development in pearl millet in Tifton. In Proceedings of the First Grain Pearl Millet Symposium, Tifton, GA, USA, 17–18 January 1995; pp. 5–8.
2. Davis, A.J.; Dale, N.M.; Ferreira, F.J. Pearl millet as an alternative feed ingredient in broiler diets.J. Appl. Poultry Res.2003,12, 137–144. [CrossRef]
3. Hanna, W. Improvement of millets: Emerging trends. InProceedings of the 2nd International Crop Science Congress, New Delhi, India; Chopra, V.L., Singh, R.B., Varma, A., Eds.; Oxford & IBH Publishing Co. Pvt. Ltd.: New Delhi, India, 1996; pp. 139–146.
4. Reddy, A.A.; Malik, D.; Singh, I.P.; Ardeshna, N.J.; Kundu, K.K.; Rao, P.; Gupta, S.K.; Sharma, R.; Gajanan, G.N. Demand and supply for pearl millet Grain and fodder by 2020 in Western India.Agric. Situat. India2012,68, 635–646.
5. Amarender Reddy, A.; Yadav, O.; Dharm Pal Malik, S.I.; Ardeshna, N.; Kundu, K.; Gupta, S.K.; Sharma, R.; Sawarganokar, G.L.; Shyam, M.; Reddy, K.S.Utilization Pattern, Demand and Supply of Pearl Millet Grain and Fodder in Western India; Working Paper Series No. 37; ICRISAT: Patancheru, India, 2013.
6. De Assis, R.L.; de Freitas, R.S.; Mason, S.C. Pearl millet production practices in Brazil: A review.Exp. Agric. 2018,54, 699–718. [CrossRef]
Agriculture2019,9, 97 18 of 21
7. Dias-Martins, A.M.; Pessanha, K.L.; Pacheco, S.; Rodrigues, J.A.S.; Carvalho, C.W.P. Potential use of pearl millet (Pennisetum glaucum(L.) R. Br.) in Brazil: Food security, processing, health benefits and nutritional products.Food Res. Int.2018,109, 175–186. [CrossRef]
8. IGFRI (Indian Grassland and Fodder Research Institute). Vision 2050. 2013. Available online:
http://www.igfri.res.in/(accessed on 28 August 2018).
9. Rai, K.; Yadav, O.; Gupta, S.K.; Mahala, R. Emerging research priorities in pearl millet. J. SAT Agric. Res. 2012,10, 1–5.
10. Rai, K.N.; Reddy, B.V.S.; Dakheel, A.J. Forage potential of sorghum and pearl millet adapted to dry lands. InProceedings of the Seventh International Conference on the Development of Drylands, Tehran, Iran, 14–17 September 2003; Beltagy, K.B., Saxena, Eds.; Sustainable Development and Management of Drylands in the Twenty-First Century; International Centre for Agricultural Research in the Dry Areas: Aleppo, Syria, 2005; pp. 243–251. 11. Bidinger, F.; Blummel, M.; Hash, C.; Choudhary, S. Genetic enhancement for superior food-feed traits in a pearl millet (Pennisetum glaucum(L.) R. Br.) variety by recurrent selection. Anim. Nutr. Feed Technol.2010,10, 61–68.
12. Gupta, S.; Ghouse, S.; Atkari, D.; Blümmel, M. Pearl millet with higher stover yield and better forage quality: Identification of new germplasm and cultivars. In Proceedings of the 3rd Conference of Cereal Biotechnology and Breeding/CBB3, Berlin, Germany, 2–4 November 2015.
13. Stich, B.; Haussmann, B.I.; Pasam, R.; Bhosale, S.; Hash, C.T.; Melchinger, A.E.; Parzies, H.K. Patterns of molecular and phenotypic diversity in pearl millet [Pennisetum glaucum(L.) R. Br.] from West and Central Africa and their relation to geographical and environmental parameters. BMC Plant Biol. 2010,10, 216.
[CrossRef]
14. Nepolean, T.; Gupta, S.; Dwivedi, S.; Bhattacharjee, R.; Rai, K.; Hash, C. Genetic diversity in maintainer and restorer lines of pearl millet.Crop Sci.2012,52, 2555–2563. [CrossRef]
15. Gupta, S.K.; Nepolean, T.; Sankar, S.M.; Rathore, A.; Das, R.R.; Rai, K.N.; Hash, C.T. Patterns of molecular diversity in current and previously developed hybrid parents of pearl millet [Pennisetum glaucum(L.) R. Br.]. Am. J. Plant Sci.2015,6, 1697–1712. [CrossRef]
16. Hu, Z.; Mbacké, B.; Perumal, R.; Guèye, M.C.; Sy, O.; Bouchet, S.; Vara Prasad, P.V.; Morris, G.P. Population genomics of pearl millet (Pennisetum glaucum(L.) R. Br.): Comparative analysis of global accessions and Senegalese landraces.BMC Genom.2015,16, 1048. [CrossRef] [PubMed]
17. Gupta, S.K.; Nepolean, T.; Shaikh, C.G.; Rai, K.; Hash, C.T.; Das, R.R.; Rathore, A. Phenotypic and molecular diversity-based prediction of heterosis in pearl millet (Pennisetum glaucumL. (R.) Br.).Crop J.2018,6, 271–281.
[CrossRef]
18. Ramya, A.R.; Ahamed, M.; Satyavathi, C.T.; Rathore, A.; Katiyar, P.; Raj, A.G.B.; Kumar, S.; Gupta, R.; Mahendrakar, M.D.; Yadav, R.S.; et al. Towards defining heterotic gene pools in pearl millet [Pennisetum glaucum(L.) R. Br.].Front. Plant Sci.2018,8, 1934. [CrossRef]
19. Sattler, F.; Sanogo, M.; Kassari, I.; Angarawai, I.; Gwadi, K.; Dodo, H.; Haussmann, B.I.G. Characterization of West and Central African accessions from a pearl millet reference collection for agro-morphological traits andStrigaresistance.Plant Genet. Resour.-C2018,16, 260–272. [CrossRef]
20. Singh, S.; Gupta, S.; Thudi, M.; Das, R.R.; Vemula, A.; Garg, V.; Varshney, R.K.; Rathore, A.; Pahuja, S.K.; Yadav, D.V. Genetic Diversity Patterns and Heterosis Prediction Based on SSRs and SNPs in Hybrid Parents of Pearl Millet.Crop Sci.2018,58, 2379–2390. [CrossRef]
21. Chowdari, K.; Venkatachalam, S.; Davierwala, A.; Gupta, V.; Ranjekar, P.; Govila, O. Hybrid performance and genetic distance as revealed by the (GATA) 4 microsatellite and RAPD markers in pearl millet. Theor. Appl. Genet.1998,97, 163–169. [CrossRef]
22. Betran, F.; Beck, D.; Bänziger, M.; Edmeades, G. Genetic analysis of inbred and hybrid grain yield under stress and nonstress environments in tropical maize.Crop Sci.2003,43, 807–817. [CrossRef]
23. Wegary, D.; Vivek, B.; Labuschagne, M. Association of parental genetic distance with heterosis and specific combining ability in quality protein maize.Euphytica2013,191, 205–216. [CrossRef]
24. Cai, J.; Lan, W. Using of AFLP marker to predict the hybrid yield and yield heterosis in rice. Chin. Agric. Sci. Bull.2005,21, 39.
25. Zhao, Q.Y.; Zhu, Z.; Zhang, Y.D.; Zhao, L.; Chen, T.; Zhang, Q.F.; Wang, C.L. Analysis on correlation between heterosis and genetic distance based on simple sequence repeat markers in japonica rice.Chin. J. Rice Sci. 2009,23, 141–147.
Agriculture2019,9, 97 19 of 21
26. Darvishzadeh, R. Phenotypic and molecular marker distance as a tool for prediction of heterosis and F1 performance in sunflower (Helianthus annuus’ L.) under well-watered and water-stressed conditions. Aust. J. Crop Sci.2012,6, 732.
27. Dreisigacker, S.; Melchinger, A.; Zhang, P.; Ammar, K.; Flachenecker, C.; Hoisington, D.; Warburton, M.L. Hybrid performance and heterosis in spring bread wheat, and their relations to SSR-based genetic distances and coefficients of parentage.Euphytica2005,144, 51–59. [CrossRef]
28. Ndhlela, T.; Herselman, L.; Semagn, K.; Magorokosho, C.; Mutimaamba, C.; Labuschagne, M.T. Relationships between heterosis, genetic distances and specific combining ability among CIMMYT and Zimbabwe developed maize inbred lines under stress and optimal conditions.Euphytica2015,204, 635–647. [CrossRef] 29. Xie, F.; He, Z.; Esguerra, M.Q.; Qiu, F.; Ramanathan, V. Determination of heterotic groups for tropical Indica
hybrid rice germplasm.Theor. Appl. Genet.2014,127, 407–417. [CrossRef] [PubMed]
30. Wang, K.; Qiu, F.; Larazo, W.; dela Paz, M.A.; Xie, F. Heterotic groups of tropicalindicarice germplasm. Theor. Appl. Genet.2015,128, 421–430. [CrossRef] [PubMed]
31. Gvozdenovi´c, S.; Safti´c-Pankovi´c, D.; Joci´c, S.; Radi´c, V. Correlation between heterosis and genetic distance based on SSR markers in sunflower (Helianthus annusL.).J. Agric. Sci.2009,54, 1–10.
32. Burton, G.W. Pearl millets Tift 23DA and Tift 23DB released.Georgia Agric. Res.1967,9, 6.
33. Burton, G.W. Registration of Pearl Millet Inbreds Tift 23B1, Tift 23A1, Tift 23DB1, and Tift 23DA11 (Reg. Nos. PL 1, PL 2, PL 3, and PL 4).Crop Sci.1969,9, 397. [CrossRef]
34. Allouis, S.; Qi, X.; Lindup, S.; Gale, M.; Devos, K. Construction of a BAC library of pearl millet, Pennisetum glaucum.Theor. Appl. Genet.2001,102, 1200–1205. [CrossRef]
35. Budak, H.; Pedraza, F.; Cregan, P.; Baenziger, P.; Dweikat, I. Development and utilization of SSRs to estimate the degree of genetic relationships in a collection of pearl millet germplasm.Crop Sci.2003,43, 2284–2290.
[CrossRef]
36. Qi, X.; Pittaway, T.; Lindup, S.; Liu, H.; Waterman, E.; Padi, F.; Hash, C.T.; Zhu, J.; Gale, M.D.; Devos, K.M. An integrated genetic map and a new set of simple sequence repeat markers for pearl millet,Pennisetum glaucum. Theor. Appl. Genet.2004,109, 1485–1493. [CrossRef]
37. Rajaram, V.; Nepolean, T.; Senthilvel, S.; Varshney, R.K.; Vadez, V.; Srivastava, R.K.; Shah, T.M.; Supriya, A.; Kumar, S.; Kumari, B.R.; et al. Pearl millet [Pennisetum glaucum(L.) R. Br.] consensus linkage map constructed using four RIL mapping populations and newly developed EST-SSRs.BMC Genom.2013,14, 159. [CrossRef] 38. Senthilvel, S.; Jayashree, B.; Mahalakshmi, V.; Kumar, P.S.; Nakka, S.; Nepolean, T.; Hash, C.T. Development and mapping of simple sequence repeat markers for pearl millet from data mining of expressed sequence tags.BMC Plant Biol.2008,8, 119. [CrossRef]
39. Prasanth, V.; Chandra, S.; Hoisington, D.; Jayashree, B.AlleloBin: A Program for Allele Binning in Microsatellite Markers based on the Algorithm of Idury and Cardon (1997); International Crops Research Institute for the Semi-Arid Tropics (ICRISAT): New Delhi, India, 2006.
40. Elshire, R.J.; Glaubitz, J.C.; Sun, Q.; Poland, J.A.; Kawamoto, K.; Buckler, E.S.; Mitchell, S.E. A robust, simple genotyping-by-sequencing (GBS) approach for high diversity species.PLoS ONE2011,6, e19379. [CrossRef]
[PubMed]
41. Lu, F.; Lipka, A.E.; Glaubitz, J.; Elshire, R.; Cherney, J.H.; Casler, M.D.; Buckler, E.S.; Costich, D.E. Switchgrass genomic diversity, ploidy, and evolution: Novel insights from a network-based SNP discovery protocol. PLoS Genet.2013,9, e1003215. [CrossRef] [PubMed]
42. Bradbury, P.J.; Zhang, Z.; Kroon, D.E.; Casstevens, T.M.; Ramdoss, Y.; Buckler, E.S. TASSEL: Software for association mapping of complex traits in diverse samples.Bioinformatics2007,23, 2633–2635. [CrossRef]
[PubMed]
43. Bidinger, F.; Blümmel, M. Determinants of ruminant nutritional quality of pearl millet [Pennisetum glaucum(L.) R. Br.] stover: I. Effects of management alternatives on stover quality and productivity.Field Crops Res.2007, 103, 119–128. [CrossRef]
44. Blümmel, M.; Bidinger, F.; Hash, C. Management and cultivar effects on ruminant nutritional quality of pearl millet (Pennisetum glaucum(L.) R. Br.) stover: II. Effects of cultivar choice on stover quality and productivity. Field Crops Res.2007,103, 129–138. [CrossRef]
45. Liu, K.; Muse, S.V. PowerMarker: An integrated analysis environment for genetic marker analysis. Bioinformatics2005,21, 2128–2129. [CrossRef] [PubMed]
Agriculture2019,9, 97 20 of 21
46. Li, Y.; Guan, R.; Liu, Z.; Ma, Y.; Wang, L.; Li, L.; Lin, F.; Luan, W.; Chen, P.; Yan, Z.; et al. Genetic structure and diversity of cultivated soybean (Glycine max(L.) Merr.) landraces in China.Theor. Appl. Genet.2008,117, 857–871. [CrossRef]
47. Upadhyaya, H.D.; Dwivedi, S.L.; Baum, M.; Varshney, R.K.; Udupa, S.M.; Gowda, C.L.; Hoisington, D.; Singh, S. Genetic structure, diversity, and allelic richness in composite collection and reference set in chickpea (Cicer arietinumL.).BMC Plant Biol.2008,8, 106. [CrossRef]
48. Excoffier, L.; Smouse, P.E.; Quattro, J.M. Analysis of molecular variance inferred from metric distances among DNA haplotypes: Application to human mitochondrial DNA restriction data.Genetics1992,131, 479–491.
[PubMed]
49. Perrier, X.; Jacquemoud-Collet, J.P. DARwin Software. Available online:https://darwin.cirad.fr/(accessed on 11 March 2017).
50. Mantel, N. The detection of disease clustering and a generalized regression approach.Cancer Res.1967,27, 209–220. [PubMed]
51. R Core Team.R: A Language and Environment for Statistical Computing; R Foundation for Statistical Computing: Vienna, Austria, 2016. Available online:https://www.R-project.org/(accessed on 21 July 2017).
52. SAS Institute Inc.SAS/STAT®14.1 User’s Guide; SAS Institute Inc.: Cary, NC, USA, 2017.
53. Kapila, R.; Yadav, R.; Plaha, P.; Rai, K.; Yadav, O.; Hash, C.; Howarth, C.J. Genetic diversity among pearl millet maintainers using microsatellite markers.Plant Breed.2008,127, 33–37. [CrossRef]
54. Sumanth, M.; Sumathi, P.; Vinodhana, N.; Sathya, M. Assessment of Genetic Distance Among the Inbred Lines of Pearl Millet (Pennisetum glaucum(L.) R. Br) Using SSR Markers.Int. J. Biotechnol. Allied Fields2013,1, 153–162.
55. He, Z.; Xie, F.; Chen, L.; Paz, M.A.D. Genetic diversity of tropical hybrid rice germplasm measured by molecular markers.Rice Sci.2012,19, 193–201. [CrossRef]
56. Filippi, C.V.; Aguirre, N.; Rivas, J.G.; Zubrzycki, J.; Puebla, A.; Cordes, D.; Moreno, M.V.; Fusari, C.M.; Alvarez, D.; Heinz, R.A.; et al. Population structure and genetic diversity characterization of a sunflower association mapping population using SSR and SNP markers.BMC Plant Biol.2015,15, 52. [CrossRef] 57. Hamblin, M.T.; Warburton, M.L.; Buckler, E.S. Empirical comparison of simple sequence repeats and single
nucleotide polymorphisms in assessment of maize diversity and relatedness. PLoS ONE2007,2, e1367.
[CrossRef]
58. Jones, E.; Sullivan, H.; Bhattramakki, D.; Smith, J. A comparison of simple sequence repeat and single nucleotide polymorphism marker technologies for the genotypic analysis of maize (Zea maysL.). Theor. Appl. Genet.2007,115, 361–371. [CrossRef]
59. Akmal, M.; Naeem, M.; Nasim, S.; Shakoor, A. Performance of different pearl millet genotypes under rainfed conditions.J. Agric. Res.1992,30, 53–58.
60. Byregowda, M. Performance of fodder bajra genotypes under rainfed conditions.Curr. Res.-Univ. Agric. Sci. 1990,19, 128–129.
61. Mohammad, D.; Hussain, A.; Khan, S.; Bhatti, M.B. Performance of new pearl millet cultivars.Pakistan J. Sci. Ind. R.1993,36, 261–263.
62. Naeem, M.; Nasim, S.; Shakoor, A. Performance of new pearl millet varieties under rainfed conditions. J. Agric. Res.1993,31, 295–298.
63. Rai, K.N.; Blümmel, M.; Singh, A.K.; Rao, A.S. Variability and relationships among forage yield and quality traits in pearl millet.Eur. J. Plant Sci. Biotechnol.2012,6, 118–124.
64. Van Soest, P. Nitrogen metabolism. InNutritional Ecology of the Ruminant, 2nd ed.; Comstock Publishing Associates-Cornell University Press: Ithaca, NY, USA, 1994; pp. 290–311.
65. Blümmel, M.; Rai, K. Stover quality and grain yield relationships and heterosis effects in pearl millet. Int. Sorghum Millets Newsl.2003,44, 141–145.
66. Hash, C.; Blummel, M.; Bidinger, F. Genotype x environment interactions in food-feed traits in pearl millet cultivars.Int. Sorghum Millets Newsl.2006,47, 153–157.
67. Vinayan, M.; Babu, R.; Jyothsna, T.; Zaidi, P.; Blümmel, M. A note on potential candidate genomic regions with implications for maize stover fodder quality.Field Crops Res.2013,153, 102–106. [CrossRef]
68. Zaidi, P.; Vinayan, M.; Blümmel, M. Genetic variability of tropical maize stover quality and the potential for genetic improvement of food-feed value in India.Field Crops Res.2013,153, 94–101. [CrossRef]
Agriculture2019,9, 97 21 of 21
69. Blümmel, M.; Deshpande, S.; Kholova, J.; Vadez, V. Introgression of staygreen QLT’s for concomitant improvement of food and fodder traits in Sorghum bicolor.Field Crops Res.2015,180, 228–237. [CrossRef] 70. Kristjanson, P.; Zerbini, E.; Rao, K.Genetic Enhancement of Sorghum and Millet Residues Fed to Ruminants: An Ex
Ante Assessment of Returns to Research; Impact Assessment Series No. 3; ILRI (aka ILCA and ILRAD): Nairobi, Kenya, 1999.
71. Blümmel, M.; Rao, P.P. Economic value of sorghum stover traded as fodder for urban and peri-urban dairy production in Hyderabad, India.Int. Sorghum Millets Newsl.2006,47, 97–100.
72. Melchinger, A.E.; Lee, M.; Lamkey, K.R.; Woodman, W.L. Genetic diversity for restriction fragment length polymorphisms: Relation to estimated genetic effects in maize inbreds. Crop Sci. 1990,30, 1033–1040.
[CrossRef]
73. Charcosset, A.; Lefort-Busen, M.M.; Gallais, A. Relationship between herosis and heterozgosity at marker loci: A theoretical computation.Theor. Appl. Genet.1991,81, 571–575. [CrossRef] [PubMed]
©2019 by the authors. Licensee MDPI, Basel, Switzerland. This article is an open access article distributed under the terms and conditions of the Creative Commons Attribution (CC BY) license (http://creativecommons.org/licenses/by/4.0/).