Post-MiFID Developments in Equity Market Liquidity
Carole Gresse
To cite this version:
Carole Gresse. Post-MiFID Developments in Equity Market Liquidity. Autorit´
e des March´
es
Financiers, Research Department, AMF Working Papers #8. 2010, pp.26.
<
halshs-00559919
>
HAL Id: halshs-00559919
https://halshs.archives-ouvertes.fr/halshs-00559919
Submitted on 26 Jan 2011HAL is a multi-disciplinary open access
archive for the deposit and dissemination of sci-entific research documents, whether they are
pub-lished or not. The documents may come from
teaching and research institutions in France or abroad, or from public or private research centers.
L’archive ouverte pluridisciplinaire HAL, est destin´ee au d´epˆot et `a la diffusion de documents scientifiques de niveau recherche, publi´es ou non, ´emanant des ´etablissements d’enseignement et de recherche fran¸cais ou ´etrangers, des laboratoires publics ou priv´es.
by Carole Gresse
Professor at Université Paris Dauphine
Post-MiFID developments in equity
market liquidity
W
o
rking Papers - n°8
Research Department Special thanksThe data used in this study were kindly provided by Intelligent Financial Systems (IFS). The AMF and Carole Gresse wish to extend special thanks to IFS directors Sabine and Darren Toulson, and to Sugandha Sharma, also of IFS.
Note — The Working Papers series is coordinated by the Research Department of the Autorité des marchés financiers (AMF). It contains research carried out in-house or by outside researchers from the academic world with whom the AMF cooperates on a regular basis, notably through the Scientific Advisory Board.
Articles in Working Papers express the personal views of their authors, which are not necessarily those of the AMF.
SOMMAIRE
Introduction ...4
I. Institutional framework and data ...5
I.1. Sample and observation periods...6
I.2. Data...7
II.Competition between trading venues...8
II.1.Fragmentation of regulated and OTC order flow in September 2009 ...8
III.2.Fragmentation of non-internalised order flow, October 2007 to September 2009 ...13
III.Liquidity and relative competitiveness of different markets...14
III.1.Price spreads ...15
III.2.Depth...19
III.3.Price competitiveness of different markets ...20
Conclusion ...21
I
NTRODUCTION
The Markets in Financial Instruments Directive (MiFID), which came into force on 1November 2007, fostered competition between established exchanges and alternative trading systems while creating a legislative framework to regulate that competition. MiFID abolished the concentration rule, which required orders to go through domestic regulated markets, and created three categories of venues for the organisation and execution of securities transactions: regulated markets (RMs), multilateral trading facilities (MTFs) and systematic internalisers (SIs). The same pre- and post-trade transparency requirements apply to all venues except dark pools, which are MTFs whose trading mechanisms do not generate price discovery and which are exempt from pre-trade transparency rules. Under the post-trade transparency rules introduced by MiFID, all transactions in regulated financial instruments must be reported to the market, even if they are carried out over the counter (OTC). Such disclosures do not have to be made to the regulated primary market; they may be made using proprietary resources or submitted to a trade reporting facility (TRF).
The biggest change since MiFID came into effect is surely the rise of MTFs and their ability to capture a substantial share of order flow. There has been much debate over this issue: some believe that heightened competition has pushed down transaction costs; others argue that increased fragmentation has widened bid-ask spreads on the main equity markets. To assess MiFID's impact on transaction costs, it is important to distinguish explicit and implicit costs. In terms of explicit transaction costs, MTFs have generally grown market share in return for drastically reduced explicit fees1
. In terms of implicit costs, several regulated markets agree that bid-ask spreads on the most actively traded stocks have increased since end-2007. However, it is hard to say to what extent increased spreads are attributable to fragmentation or to the financial crisis and the ensuing surge in volatility.
This study seeks to measure the change in liquidity and implicit transaction costs for a sample of large and mid caps since the introduction of MiFID, contextualising these developments by taking fluctuations in volatility into account. Section 2 describes the institutional framework, selected observation periods and data used. Section 3 assesses order-flow fragmentation and the intensity of competition between trading systems since MiFID's introduction. Section 4 looks at how liquidity changed between the observation periods. Section 5 summarises the main findings.
1
Generally, MTFs apply an explicit costs structure that treats aggressive orders differently from orders that provide liquidity to the market. Chi-X, Turquoise and BATS Europe charge around 30 basis points (bps) for aggressive orders, while orders that provide liquidity earn a rebate of 15 or 20 bps. Some exchanges have responded by lowering their explicit costs, a step taken by the London Stock Exchange in August 2008.
I.
I
NSTITUTIONAL FRAMEWORK AND DATA
Three groups – Deutsche Boerse, LSE-Borsa Italiana and NYSE-Euronext – currently dominate Europe's securities trading industry. They run the most active regulated markets and also own MTFs. Their RMs are challenged by a handful of pan-European MTFs that emerged in 2007 and 2008: Chi-X, owned by Instinet, a broker; Turquoise, which was launched by a consortium of investment banks and then acquired by LSE; Nasdaq OMX Europe, which belongs to the Nasdaq OMX group; and BATS Europe, the subsidiary of BATS, a US exchange. PLUS Markets, a new UK exchange, operates as an RM for small caps and as an MTF for European securities, although it is mainly specialised in small and mid caps. The legislation on transaction reporting introduced by MiFID also led to the creation of several TRFs that offer MiFID-compliant services. The largest of these by market share is the BOAT platform of Markit, a financial information provider. Table 1 charts the key events in the development of Europe's RMs, MTFs and TRFs.
Table 1. Development of the main European RMs, MTFs and TRFs: a brief history
Date Event
22 September 2000 Amsterdam, Brussels and Paris exchanges merge, Euronext created
30 January 2002 Euronext group absorbs Lisbon exchange
September 2006 Nine investment banks create BOAT, a MiFID-compliant TRF
30 March 2007 Chi-X MTF begins trading in 5 Dutch stocks and 5 German stocks 4 April 2007 NYSE and Euronext merge, following announcement on 1 June 2006 12 April 2007 Chi-X extends trading to all DAX 30 constituents
13 April 2007 Chi-X extends trading to all AEX 25 constituents 29 June 2007 Chi-X begins trading in 11 FTSE 100 stocks 13 July 2007 Chi-X extends trading to all FTSE 100 stocks 28 September 2007 Chi-X begins trading in 19 CAC 40 stocks 8 and 22 October 2007 Chi-X extends trading to all other CAC 40 stocks 4 July 2008 Chi-X begins trading in Belgian stocks 21 August 2008 Chi-X extends trading to mid caps
2008 to today Progressive expansion in universe of stocks traded on Chi-X 1 October 2007 LSE acquires Borsa Italiana
22 January 2008 Financial information provider Markit acquires BOAT TRF 22 September 2008 Pan-European platform Turquoise launched
1 October 2008 Pan-European platform Nasdaq OMX Europe launched
31 October 2008 BATS Europe launched as MTF for LSE, Euronext and Deutsche Boerse stocks 9 March 2009 NYSE-Euronext launches MTF NYSE Arca Europe
21 December 2009 Announcement that LSE is taking 60% stake in Turquoise, later reduced to 51%; Turquoise merged with Baikal, another MTF
I.1.
Sample and observation periods
The study analyses a sample comprising 32 CAC 40 stocks, 51 FTSE 100 stocks and 57 SBF 120 stocks that are not in the CAC 40 index. These stocks were selected because they were continually in the index in 2007, 2008 and 2009. Financial stocks were excluded. (See the annex for a complete list.)
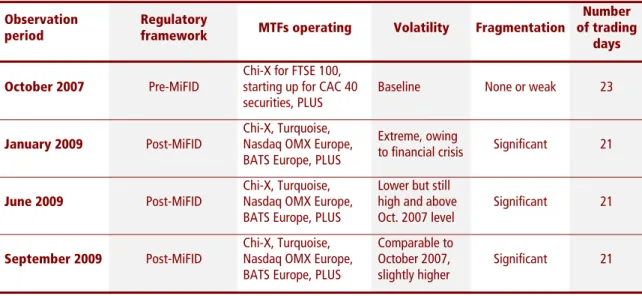
The study consisted in comparing the liquidity of the stocks in the sample over four one-month observation periods. One period is before MiFID's entry into force, while the other three are after. The post-MiFID periods correspond to different levels of fragmentation and volatility. Table 2 gives a timetable and details some of the characteristics of the four observation periods.
The pre-MiFID period (October 2007) comes just after the start-up of Chi•X but precedes the launch of the other MTFs. The three post-MiFID observation periods (January, June and September 2009) come after the launch of all the MTFs that now have visible market share, but correspond to different levels of market volatility. October 2007 and September 2009 are very different in terms of fragmentation, but are comparable in terms of volatility, measured by the standard deviation of daily returns on the CAC 40 and FTSE 100 indices.
Table 2. Characteristics of observation periods
Observation period
Regulatory
framework MTFs operating Volatility Fragmentation
Number of trading
days
October 2007 Pre-MiFID
Chi-X for FTSE 100, starting up for CAC 40 securities, PLUS
Baseline None or weak 23
January 2009 Post-MiFID
Chi-X, Turquoise, Nasdaq OMX Europe, BATS Europe, PLUS
Extreme, owing
to financial crisis Significant 21
June 2009 Post-MiFID
Chi-X, Turquoise, Nasdaq OMX Europe, BATS Europe, PLUS
Lower but still high and above Oct. 2007 level
Significant 21
September 2009 Post-MiFID
Chi-X, Turquoise, Nasdaq OMX Europe, BATS Europe, PLUS
Comparable to October 2007, slightly higher
I.2.
Data
Intelligent Financial Systems (IFS) kindly provided the high-frequency data used in this study. The data were generated from the original dataflows of the Euronext, LSE and Deutsche Boerse regulated markets, the Chi-X, Turquoise, Nasdaq OMX Europe, BATS Europe and PLUS MTFs, and BOAT, Markit's TRF. The database includes transaction and best-limit data time-stamped to the second for all the abovementioned markets.
For each trade, transaction data include the price, the volume and the best limits displayed on each RM and MTF in the sample at the time of the trade. Euronext and LSE data cover opening and closing auction transactions as well as transactions during continuous trading. LSE data include an indicator that can be used to identify trades executed on the SETS order book, off-book trades executed by LSE members, and trades reported to LSE's European Trade Reporting Service but not executed on LSE's regulated market. The third category of trades (reported to LSE's European Trade Reporting Service but not executed on the regulated market) and trades reported by BOAT are OTC trades or trades executed by SIs.
For each RM and MTF, the data on best limits include the best bid and ask price as posted every second of the session with associated disclosed quantities. No quotes are provided for BOAT, so any prices offered by SIs are not available. Based on these data, the best bid price on all competing markets and the best ask price on the same markets are determined. The difference between these two prices divided by their median value is the quoted spread resulting from matching quotes on all markets. It will be called the global quoted spread in the remainder of the study, as contrasted with the local quoted spreads observed on individual markets.
II.
C
OMPETITION BETWEEN TRADING VENUES
This section assesses the fragmentation of order flow since MiFID's introduction. A first sub-section reviews the distribution of trading volumes between the primary markets, other RMs, MTFs and OTC or regulated internalisation in September 2009. The second sub-section describes the evolution of competition between RMs and MTFs between October 2007, just before MiFID came into force, and September 2009, two years later.
II.1.
Fragmentation of regulated and OTC order flow in
September 2009
Charts 1, 2 and 3 describe the market shares of the primary market, other regulated markets, MTFs and internalisation in FTSE 100, CAC 40 and other SBF 120 stocks respectively in September 2009. Part A of Table 3 condenses the data from Charts 1, 2 and 3, while Part B presents the same statistics for continuous trading only, excluding opening and closing auctions on the primary market. The primary market is found to have a majority share of order-flow execution in all the samples. If we calculate a fragmentation index by summing the squares of the market shares of each trading venue and the square of the internalisation share2
, then taking the inverse of that sum, fragmentation is comparable for FTSE 100 stocks (index of 2.7) and CAC 40 stocks (index of 2.65). Comparing the CAC 40 and the SBF 120 reveals that order flow is much less fragmented in mid caps than in large caps, with Euronext capturing over 70% of volumes for the former, compared with 55% for the latter.
In terms of the MTFs' competitive position, three players stand out: Chi•X, Turquoise and BATS Europe. Chi-X is the clear frontrunner with over 10% of volumes in the three samples. BATS Europe and Turquoise are on a par in terms of market share (3%-4% for the CAC 40, 4%-5% for the FTSE 100). BATS Europe leads Turquoise in UK stocks, but Turquoise has the edge in French stocks.
There is virtually no competition between the regulated markets. Euronext loses a few trades to LSE and Deutsche Boerse, but no more than 1%-2% of volumes, and Euronext and Deutsche Boerse have zero market share in LSE stocks. If the RMs are to compete, they will surely do so through the pan-European MTFs that they have created, namely NYSE Arca Europe for Euronext and Xetra International Market for Deutsche Boerse.
2
Internalisation and OTC account for around 20% of total volumes on the CAC 40 and FTSE 100. The share is slightly lower than 20% for UK large caps and significantly higher (approximately 24%) for French large caps. These percentages are almost certainly underestimated because BOAT and LSE's reporting service do not account for all OTC and internalised volumes, but since BOAT is the market leader in post-trade reporting, the estimate may be considered to be in the right order of magnitude.
Chart 1. Distribution of trading volumes, FTSE 100 stocks, September 2009
0.00% 55.65% 0.00% 13.93% 5.05% 4.43% 0.96% 0.68% 18.66% 0.64%
Euronext LSE Deutsche
Boerse
Chi‐X BATS
Europe
Turquoise Nasdaq OMX Eur.
PLUS BOAT LSE
reporting service
These statistics are based on a transaction universe including trades executed in LSE opening and closing auctions (SETS system) and trades executed OTC or by SIs (BOAT and LSE reporting service). LSE's market share encompasses transactions executed on and off the order book.
Chart 2. Distribution of trading volumes, CAC 40 stocks, September 2009 55.08% 0.55% 0.94% 11.63% 2.96% 3.96% 0.91% 0.00% 21.11% 2.86%
Euronext LSE Deutsche
Boerse
Chi‐X BATS
Europe
Turquoise Nasdaq OMX Eur.
PLUS BOAT LSE
reporting service
These statistics are based on a transaction universe including trades executed in Euronext opening and closing auctions (UTP system) and trades executed OTC or by SIs (BOAT and LSE reporting service).
Chart 3. Distribution of trading volumes, SBF 120 stocks (excluding CAC 40), September 2009 70.53% 0.34% 0.20% 10.18% 1.11% 2.75% 0.40% 0.00% 14.37% 0.11%
Euronext LSE Deutsche
Boerse
Chi‐X BATS
Europe
Turquoise Nasdaq OMX Eur.
PLUS BOAT LSE
reporting service
These statistics are based on a transaction universe including trades executed in Euronext opening and closing auctions (UTP system) and trades executed OTC or by SIs (BOAT and LSE reporting service).
Chart 4. Distribution of trading volumes between RMs and MTFs, FTSE 100 stocks, October 2007 to September 2009 56.46% 67.44% 59.92% 55.39% 43.53% 8.50% 11.67% 13.57% 0.01% 24.06% 28.41% 31.04%
Oct. 2007 Jan. 2009 Jun. 2009 Sep. 2009
LSE (On‐book) LSE (Off‐book) MTF Euronext +DB
These statistics are based on a reduced transaction universe including only RMs and MTFs. Trades executed in LSE opening and closing auctions (SETS system) are included. OTC and internalisation are excluded. LSE's share is separated into on- and off-book trades.
Table 3. Relative market shares, trading volumes, September 2009 Trading
volumes, EUR 000
Euronext LSE Deutsche
Boerse Chi-X BATS Europe Turquoise Nasdaq OMX Eur. PLUS BOAT LSE Reporting service Part A.
Auctions and continuous trading
FTSE 100 stocks 97,610,437.95 0.00% 55.65% 0.00% 13.93% 5.05% 4.43% 0.96% 0.68% 18.66% 0.64%
CAC 40 stocks 99,760,432.13 55.08% 0.55% 0.94% 11.63% 2.96% 3.96% 0.91% 0.00% 21.11% 2.86%
SBF 120 stocks
not in CAC 40 13,959,376.78 70.53% 0.34% 0.20% 10.18% 1.11% 2.75% 0.40% 0.00% 14.37% 0.11%
Part B.
Continuous trading only
FTSE 100 stocks 84,694,595.90 0.00% 53.35% 0.00% 16.05% 5.82% 5.10% 1.10% 0.78% 17.29% 0.50%
CAC 40 stocks 83,918,213.46 51.51% 0.57% 1.03% 13.82% 3.52% 4.71% 1.08% 0.00% 20.81% 2.94%
SBF 120 stocks
not in CAC 40 12,131,265.95 70.18% 0.37% 0.22% 11.71% 1.28% 3.17% 0.46% 0.01% 12.46% 0.13%
This table shows the relative market shares of trading venues in September 2009 for each sample of stocks. The second column shows total trading volumes in thousands of euros. All trading volumes, regulated and OTC, are included in the statistics. OTC trades and trades executed by SIs included in the statistics are those reported by BOAT or LSE. Part A of the table reports market shares when primary market auction transactions are included. Part B reduces the sample to transactions executed in continuous trading.
Table 4. Distribution of trading volumes between RMs and MTFs, October 2007 to September 2009
Sample Period
Trading volumes,
EUR 000
Euronext LSE Deutsche
Boerse Chi-X
BATS
Europe Turquoise
Nasdaq
OMX Eur. PLUS
Fragmentation index Oct. 2007 191,652,999.96 0.00% 99.99% 0.00% 0.00% 0.00% 0.00% 0.00% 0.01% 1.00 Jan. 2009 76,368,643.35 0.00% 75.94% 0.00% 14.72% 1.72% 5.82% 0.29% 1.52% 1.66 Jun. 2009 90,706,501.84 0.00% 71.59% 0.00% 17.14% 4.36% 4.58% 0.71% 1.62% 1.83 FTSE 100 stocks Sep. 2009 78,769,760.35 0.00% 68.96% 0.00% 17.26% 6.26% 5.49% 1.19% 0.84% 1.95 Oct. 2007 105,322,607.21 96.45% 2.92% 0.63% 0.00% 0.00% 0.00% 0.00% 0.00% 1.07 Jan. 2009 66,111,453.33 76.41% 1.63% 0.61% 13.07% 1.28% 6.93% 0.08% 0.01% 1.65 Jun. 2009 67,564,708.11 70.35% 1.18% 1.30% 16.42% 6.18% 3.74% 0.84% 0.00% 1.90 CAC 40 stocks Sep. 2009 75,847,833.64 72.44% 0.72% 1.24% 15.29% 3.89% 5.21% 1.19% 0.01% 1.81 Oct. 2007 17,582,701.32 99.99% 0.00% 0.01% 0.00% 0.00% 0.00% 0.00% 0.00% 1.00 Jan. 2009 8,569,063.99 92.87% 1.15% 0.01% 5.11% 0.31% 0.51% 0.03% 0.01% 1.16 Jun. 2009 9,625,223.73 80.61% 0.95% 0.02% 13.87% 2.11% 2.26% 0.19% 0.00% 1.49 SBF 120 stocks not in CAC 40
Chart 5. Distribution of trading volumes between RMs and MTFs, CAC 40 stocks, October 2007 to September 2009 96.45% 76.41% 70.35% 72.44% 21.36% 27.18% 25.60% 3.55% 2.23% 2.47% 1.96%
Oct. 2007 Jan. 2009 Jun. 2009 Sep. 2009
Euronext MTF LSE+DB
These statistics are based on a reduced transaction universe including only RMs and MTFs. Trades executed in Euronext opening and closing auctions (UTP system) are included. OTC and internalisation are excluded.
Chart 6. Distribution of trading volumes between RMs and MTFs, SBF 120 stocks not in CAC 40 index, October 2007 to September 2009
99.99% 92.87% 80.61% 82.47% 5.98% 18.43% 16.90% 0.01% 1.16% 0.97% 0.63%
Oct. 2007 Jan. 2009 Jun. 2009 Sep. 2009
Euronext MTF LSE+DB
These statistics are based on a reduced transaction universe including only RMs and MTFs. Trades executed in Euronext opening and closing auctions (UTP system) are included. OTC and internalisation are excluded.
III.2. Fragmentation of non-internalised order flow, October
2007 to September 2009
To estimate the change in fragmentation between October 2007 and September 2009, volumes executed OTC are excluded from the analysis for the sake of comparability, since these volumes were not reported in October 2007, i.e. pre-MiFID, and only fragmentation between multilateral platforms is comparable across all the observation periods.
Charts 4 to 6, which look at the FTSE 100, the CAC 40 and SBF 120 stocks not included in the CAC 40 respectively, describe the market share of the primary market, the aggregated market share of the other two RMs and the share of the MTFs over each of the four observation months in 2007 and 2009. In Chart 4, which considers the FTSE 100, LSE's market share is separated into volumes executed on the SETS order book and off-book transactions executed by LSE members according to the counterparty principle. Table 4 lists the monthly market shares of all the markets and provides a fragmentation index3
in the last column, which reveals that fragmentation was substantial in June and September 2009 (around 1.9 for the CAC 40 and FTSE 100 and between 1.4 and 1.5 for the non-CAC 40 SBF 120) and was at an intermediate level in January 2009. In the two samples of large caps, the primary market's share of non-internalised volumes fell from over 95% in October 2007 to around 70% in the final period. Among French mid caps, the primary market's share remained above 80% in September 2009. The share of volumes executed on MTFs stabilised at over 25% for CAC 40 constituents and reached about 30% for FTSE 100 constituents, but did not exceed 18% for the smaller stocks of the SBF 120.
The structure of the large-cap order flow on LSE changed radically between 2007 and 2009, reflecting competition from MTFs and increased automation of securities trading. In October 2007, over 40% of trading volumes were executed by LSE members off the order book, but by September 2009, just 13.6% of LSE's 69% market share was traded off-book. According to Chart 4, the SETS system has not really lost market share, but the off-book order flow seems to have diminished as the competition has gained ground.
3
Fidessa, a company that provides trading systems, market data and connectivity solutions, uses this index to measure market fragmentation. It is the inverse of the sum of the squares of the market shares of the different trading venues. Its minimum value is 1 when order flow is totally concentrated on one market.
III.
L
IQUIDITY AND RELATIVE COMPETITIVENESS OF DIFFERENT
MARKETS
Three metrics are used to measure liquidity: quoted spreads, effective spreads, and displayed depth at best limits.
Quoted spreads
At a given time, the quoted spread is the difference between the best ask price and the best bid price quoted on a market relative to their median value. It measures the implicit transaction cost borne on the purchase and instant resale of a unit of stock. In the data provided by IFS, quoted spreads are observable for every second in the session. The quoted spread observed for a given market will be called the local quoted spread. A global quoted spread is calculated by comparing the best limits on all platforms and distinguishing between the ask price on the platform offering the lowest best ask limit and the bid price on the platform offering the highest best bid limit. Local quoted spreads for the primary market and the four main MTFs4
and global quoted spreads are averaged for each stock and each month in the study. Monthly average quoted spreads are then computed for each sample by weighting the averages of the individual stocks by market capitalisation5
.
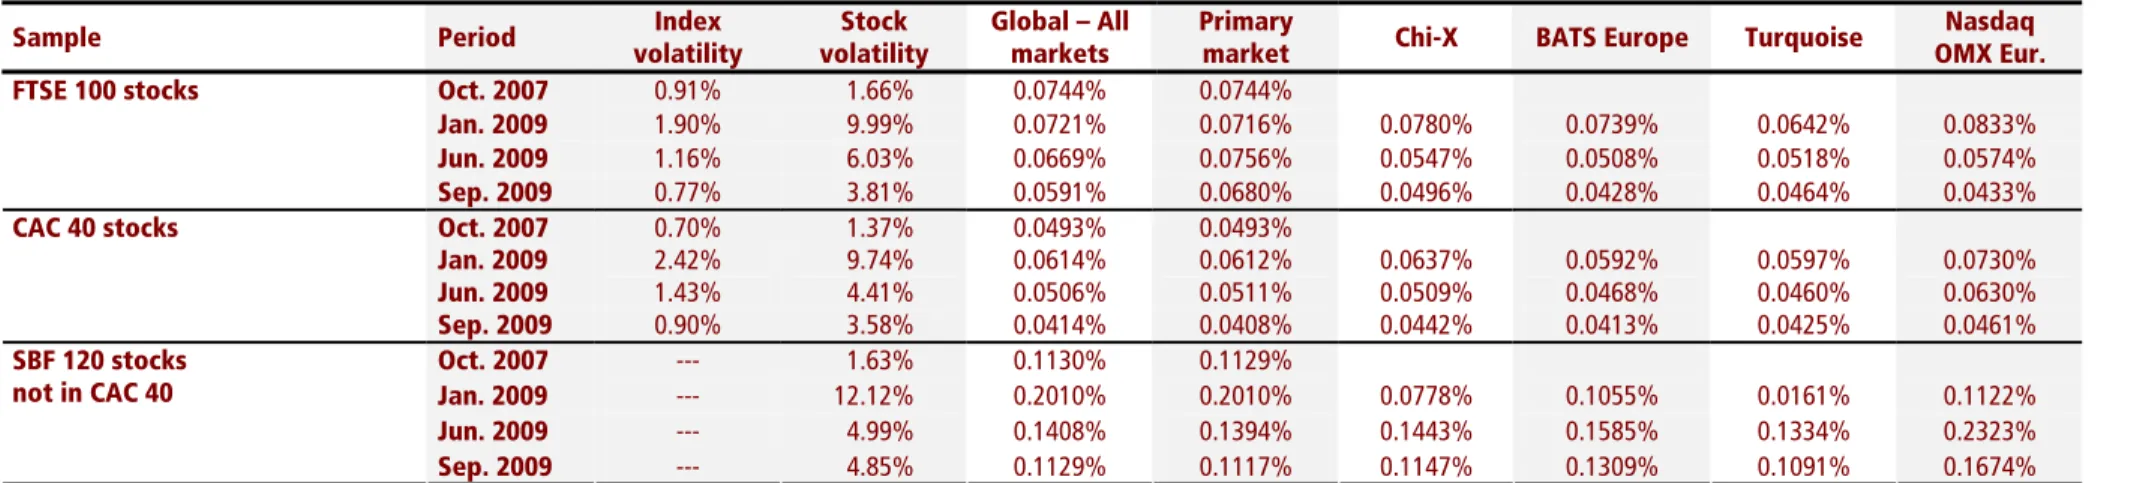
Effective spreads
The effective spread is the implicit cost paid on a given transaction. It corresponds to the difference between the transaction price and the median price observed on the market at the time of the transaction, measured as a percentage of the median price. It is doubled to make it comparable with the quoted spread. The median price used as the baseline is the global median price, i.e. the mid-point of the best bid and ask prices, all markets combined.
Average effective spreads for each month and sample are prepared in the same way as average quoted spreads, except that in the case of effective spreads, the averages per stock are weighted by transaction size. The transaction universe used to calculate these averages is reduced to trades executed in on-book continuous trading. OTC, internalised and off-book transactions are excluded. Local effective spreads are obtained by averaging the effective spreads of transactions
4
BATS Europe, Chi-X, Nasdaq OMX Europe and Turquoise. 5
Market capitalisation for weighting purposes is the average of the stock's market capitalisation at 1 October 2007 and at 30 September 2009. Capitalisation data are taken from Datastream.
executed on each individual market, and global effective spreads are obtained by averaging spreads for all the markets.
Depth at best limits
Depth at best limits is the sum of the quantities associated with the best bid and ask prices. It can be understood at the quantity of stock that can be instantaneously exchanged with no impact on quoted prices. To ensure that depth is comparable between stocks regardless of price level, it is expressed in terms of capital, specifically in thousands of euros, by multiplying quantities by the median price6
. Global depth is determined by aggregating the quantities demanded at the best bid limit on all markets quoting the best bid price and the quantities offered at the best ask limit on all markets quoting the best ask price. Average depths are then calculated using the same procedure as for average quoted spreads.
III.1.
Price spreads
The global and local spreads of the primary markets, which are reported in Tables 5 and 6, narrowed between October 2007 and September 2009 for the three samples. The biggest decline was on the FTSE 100, where the average global quoted spread fell from 9.21 to 5.43 bps and LSE's average local quoted spread fell from 9.21 to 7.07 bps. Spreads narrowed far less dramatically for the mid caps of the SBF 120. Effective spreads contracted by less than quoted spreads but nonetheless narrowed significantly, except in the case of SBF 120 mid caps. The decline in spreads is especially noteworthy given that the average volatility of individual stocks was higher in September 2009 than in October 2007 despite returning to levels on a par with those of the pre-MiFID period.
6
Table 5. Quoted spreads, October 2007 to September 2009
Sample Period Index
volatility Stock volatility Global – All markets Primary
market Chi-X BATS Europe Turquoise
Nasdaq OMX Eur. Oct. 2007 0.91% 1.66% 0.0921% 0.0921% Jan. 2009 1.90% 9.99% 0.0898% 0.1129% 0.1275% 0.1688% 0.4060% 0.2803% Jun. 2009 1.16% 6.03% 0.0638% 0.0864% 0.0862% 0.1024% 0.1614% 0.1295% FTSE 100 stocks Sep. 2009 0.77% 3.81% 0.0543% 0.0707% 0.0695% 0.0801% 0.0949% 0.1100% Oct. 2007 0.70% 1.37% 0.0604% 0.0617% Jan. 2009 2.42% 9.74% 0.0644% 0.0943% 0.1121% 0.1871% 0.1107% 0.3566% Jun. 2009 1.43% 4.41% 0.0502% 0.0735% 0.0714% 0.0850% 0.1728% 0.1191% CAC 40 stocks Sep. 2009 0.90% 3.58% 0.0446% 0.0595% 0.0606% 0.0933% 0.0833% 0.0989% Oct. 2007 --- 1.63% 0.1452% 0.1454% Jan. 2009 --- 12.12% 0.2502% 0.2644% 0.3064% 0.2848% 0.0053% 0.2975% Jun. 2009 --- 4.99% 0.1615% 0.1945% 0.2650% 0.3375% 0.4252% 0.3924% SBF 120 stocks not in CAC 40 Sep. 2009 --- 4.85% 0.1198% 0.1399% 0.2722% 0.3017% 0.2553% 0.2882%
This table reports average global quoted spreads and average local quoted spreads for the primary market and the four leading MTFs, by month and by sample. The third column shows the volatility of daily returns on the index during the month. The fourth column is the capitalisation-weighted average volatility of daily returns for the stocks in the sample.
Table 6. Effective spreads, October 2007 to September 2009
Sample Period Index
volatility Stock volatility Global – All markets Primary
market Chi-X BATS Europe Turquoise
Nasdaq OMX Eur. Oct. 2007 0.91% 1.66% 0.0744% 0.0744% Jan. 2009 1.90% 9.99% 0.0721% 0.0716% 0.0780% 0.0739% 0.0642% 0.0833% Jun. 2009 1.16% 6.03% 0.0669% 0.0756% 0.0547% 0.0508% 0.0518% 0.0574% FTSE 100 stocks Sep. 2009 0.77% 3.81% 0.0591% 0.0680% 0.0496% 0.0428% 0.0464% 0.0433% Oct. 2007 0.70% 1.37% 0.0493% 0.0493% Jan. 2009 2.42% 9.74% 0.0614% 0.0612% 0.0637% 0.0592% 0.0597% 0.0730% Jun. 2009 1.43% 4.41% 0.0506% 0.0511% 0.0509% 0.0468% 0.0460% 0.0630% CAC 40 stocks Sep. 2009 0.90% 3.58% 0.0414% 0.0408% 0.0442% 0.0413% 0.0425% 0.0461% Oct. 2007 --- 1.63% 0.1130% 0.1129% Jan. 2009 --- 12.12% 0.2010% 0.2010% 0.0778% 0.1055% 0.0161% 0.1122% Jun. 2009 --- 4.99% 0.1408% 0.1394% 0.1443% 0.1585% 0.1334% 0.2323% SBF 120 stocks not in CAC 40 Sep. 2009 --- 4.85% 0.1129% 0.1117% 0.1147% 0.1309% 0.1091% 0.1674%
This table reports average global effective spreads and average local effective spreads for the primary market and the four leading MTFs, by month and by sample. These statistics are based on a reduced universe comprising transactions exchanged in on-book continuous trading. The third column shows the volatility of daily returns on the index during the month. The fourth column is the capitalisation-weighted average volatility of daily returns for the stocks in the sample.
Table 7. Depth at best limits, October 2007 to September 2009
Echantillon Période Global - Tous
marchés Marché primaire Chi-X BATS Europe Turquoise Nasdaq OMX Eur.
Somme des moyennes
(Nasdaq OMX exclus)
Oct. 2007 531,017 531,017 531,017 Jan. 2009 118,782 113,545 106,008 78,746 88,798 16,484 387,097 Juin 2009 137,711 159,549 131,612 83,381 36,401 51,881 410,943 Titres du FTSE 100 Sep. 2009 142,950 134,107 116,373 68,551 38,685 68,272 357,716 Oct. 2007 132,637 137,146 137,146 Jan. 2009 43,280 41,015 34,062 32,386 33,798 33,172 141,261 Juin 2009 44,582 43,194 29,296 25,813 23,224 23,562 121,527 Titres du CAC 40 Sep. 2009 59,401 54,846 38,263 27,556 28,664 18,279 149,329 Oct. 2007 35,028 35,222 35,222 Jan. 2009 16,937 16,919 8,329 7,079 0,339 6,285 32,666 Juin 2009 17,955 18,216 14,489 12,610 13,110 13,069 58,425 Titres du SBF120
n'appartenant pas au CAC 40
Sep. 2009 21,113 21,594 14,378 13,153 13,459 11,432 62,584
This table reports average global depth and average local depth for the primary market and the four main MTFs, by month and by sample, expressed in thousands of euros. Quantities taken into account are disclosed quantities at best limits. The last column is the sum of average depths on the primary market, Chi-X, Turquoise and BATS Europe.
Table 8. Average transaction size, October 2007 to September 2009
Sample Period Average transaction size, EUR 000 Oct. 2007 91.227 Jan. 2009 18.037 Jun. 2009 19.924 FTSE 100 stocks Sep. 2009 18.444 Oct. 2007 44.557 Jan. 2009 16.151 Jun. 2009 14.830 CAC 40 stocks Sep. 2009 17.208 Oct. 2007 16.077 Jan. 2009 7.858 Jun. 2009 6.988 SBF 120 stocks not in CAC 40 Sep. 2009 7.842
Table 9. Time at one of the best limits, primary market and main MTFs, October 2007 to September 2009
Sample Period Primary
market Chi-X BATS Europe Turquo ise Nasdaq OMX Eur. Oct. 2007 100.00% Jan. 2009 68.28% 57.59% 15.12% 23.70% 1.82% Jun. 2009 70.36% 60.72% 19.63% 13.52% 7.01% FTSE 100 stocks Sep. 2009 72.31% 56.16% 17.80% 12.63% 9.52% Oct. 2007 99.84% Jan. 2009 56.18% 59.72% 14.93% 37.18% 2.45% Jun. 2009 57.87% 58.31% 31.77% 15.14% 4.55% CAC 40 stocks Sep. 2009 65.90% 59.01% 17.95% 20.85% 4.46% Oct. 2007 99.99% Jan. 2009 92.78% 26.41% 3.14% 1.10% 0.61% Jun. 2009 68.87% 63.07% 11.61% 12.15% 1.42% SBF 120 stocks not in CAC 40 Sep. 2009 78.87% 53.13% 5.47% 15.01% 1.76%
Spreads declined steadily over the three months observed in 2009, despite high volatility in January and June 2009. Spreads did widen for Euronext stocks in January 2009, but this was weak compared with the surge in the volatility of the CAC 40 index and individual stocks over the period.
III.2.
Depth
Depth did not display such a favourable change over the same period. Between October 2007 and September 2009, average global depth was divided by 3.7 for FTSE 100 stocks, by 2.2 for CAC 40 stocks and 1.7 for the SBF 120. Local depth on the primary markets showed a similar change between the two periods. Although substantial, the reduction in depth is far smaller than the decline in average transaction size. Whereas depth was divided by 3.7 on average for FTSE 100 stocks, average transaction size was divided by 5. Average size was divided by 2.6 for CAC 40 stocks and by 2 for the other stocks of the SBF 120.
These figures also have to be set in the context of the sharp decline in trading volumes between October 2007 and September 2009 (cf. Table 4): -59% for FTSE 100 stocks, -28% for CAC 40 stocks and -32% for the other stocks of the SBF 120.
Moreover, the statistics in the table reveal dispersion in instant depth across the competing systems. If we sum the local depths of the primary market and the three most active MTFs, the total goes down only for FTSE 100 stocks. It is relatively stable for the CAC 40, and actually increases among SBF 120 constituents that are not in the CAC 40.
Additionally, the measure of depth used in this study, which is the most widely used indicator, is a static measure of instantly available quantities. It does not take account of the frequency with which these quantities are renewed. Yet with the proliferation of trading facilities and the rise of algorithmic trading, the frequency of order submission has increased exponentially and orders are much more broken up. In an ideal world, we would measure depth dynamically, but the data do not allow this.
III.3.
Price competitiveness of different markets
A comparison of the local price spreads provided in Tables 5 and 6, and the time spent by each market at at least one of the best limits, reported in Table 9, show that the primary markets remain highly price competitive. In terms of effective spreads, MTFs are well positioned. In terms of quoted spreads and time at best limits, Chi-X is the clear leader and is best positioned relative to the primary market. It is also the only MTF whose time at one of the best limits exceeds 50% for all stocks, including those of the SBF 120 that do not belong to the CAC 40. Its competitiveness relative to the primary market is better for UK stocks than for French stocks.
C
ONCLUSION
Based on two samples of non-financial large caps from the FTSE 100 and the CAC 40 and a third sample of non-financial mid caps from the SBF 120, this study looks at four monthly periods to compare market liquidity before and after the entry into effect of MiFID. Over the last monthly period, i.e. September 2009, order-flow fragmentation reached substantial levels in all three samples, although it was less pronounced among the mid caps of the SBF 120. Between 20% and 25% of total volumes on the FTSE 100 and the CAC 40 were traded OTC or internalised. As regards non-internalised regulated order flow, 25% to 30% of volumes in large caps were executed on MTFs outside the primary market, compared with around 17% for mid caps of the SBF 120. Despite the high levels of fragmentation, primary markets continue to dominate the European securities trading landscape, with market share of approximately 70% for regulated volumes in large caps and 80% for mid caps. The primary markets also have good relative price competitiveness.
The rise in competition between trading venues has been accompanied by a significant decline in price spreads. This reduction in implicit transaction costs is relatively proportionate to the strength of competition, because it is more marked among large caps than among mid caps. The decline has take place at the cost of reduced depth at best limits. Several points temper this conclusion, however. First, trading volumes fell sharply between October 2007 and September 2009. Next, competition between trading systems combined with the rise of algorithmic trading have resulted in orders being more broken up, such that average transaction size has fallen even more steeply than depth at best limits. The frequency of trading and quote changes has also increased greatly. In such an environment, a static measurement of depth has drawbacks, because the frequency with which the depth is renewed is not captured. Also, the available depth appears to be divided between the most active platforms. Ultimately, increased competition has resulted in a decline in implicit transaction costs. The investors best placed to take advantage are logically those that operate on several platforms through smart order routing systems.
A
NNEX
- D
ETAILED COMPOSITION OF SAMPLES
Index Stock Average market
capitalisation, EUR million
BP 133,845
ROYAL DUTCH SHELL A(LON) 113,332
GLAXOSMITHKLINE 87,660
ROYAL DUTCH SHELL B 65,670
RIO TINTO 53,171
BHP BILLITON 49,969
ASTRAZENECA 48,368
BRITISH AMERICAN TOBACCO 46,427
ANGLO AMERICAN 46,254 BG GROUP 40,568 XSTRATA 38,216 SABMILLER 27,854 UNILEVER (UK) 27,041 BT GROUP 23,505 NATIONAL GRID 22,805 BAE SYSTEMS 19,054
BRITISH SKY BCAST.GROUP 14,073
ROLLS-ROYCE GROUP 11,609
MARKS & SPENCER GROUP 10,761
SAINSBURY (J) 10,517
ANTOFAGASTA 9,769 MORRISON(WM)SPMKTS. 9,487
LAND SECURITIES GROUP 8,218
KAZAKHMYS 8,215
ASSOCIATED BRIT.FOODS 8,083
COMPASS GROUP 8,060
TULLOW OIL 8,038
VEDANTA RESOURCES 7,227
SMITH & NEPHEW 6,610
BRITISH LAND 6,433
CARNIVAL 6,013 KINGFISHER 5,814
CAPITA GROUP 5,583
CABLE & WIRELESS 5,349
NEXT 4,918 SMITHS GROUP 4,869 BRITISH AIRWAYS 4,656 LIBERTY INTL. 4,383 JOHNSON MATTHEY 4,212 SAGE GROUP 4,020 REXAM 3,851
HOME RETAIL GROUP 3,751
SEVERN TRENT 3,627 ICTL.HTLS.GP. 3,391 RENTOKIL INITIAL 3,335 PETROFAC 3,032 COBHAM 2,946 INMARSAT 2,861 SERCO GROUP 2,804 RANDGOLD RESOURCES 2,799 FTSE 100 (51 stocks) INTERTEK GROUP 2,159
Index Stock Average market capitalisation, EUR million
TOTAL 115,329 EDF 105,285 SANOFI-AVENTIS 73,545 FRANCE TELECOM 54,815 GDF SUEZ 52,424 L'OREAL 49,503 LVMH 37,689 VIVENDI 30,482 CARREFOUR 28,316 DANONE 27,520 VINCI (EX.SGE) 23,442 SAINT GOBAIN 23,252 AIR LIQUIDE 21,688 VEOLIA ENVIRON. 20,693 SCHNEIDER ELECTRIC 20,242 RENAULT 19,653 LAFARGE 18,168 ALSTOM 17,335 BOUYGUES 16,591 PERNOD RICARD 15,463 EADS 15,041 PPR 14,186 ACCOR 11,892 ALCATEL-LUCENT 11,650 MICHELIN 10,965 PEUGEOT 9,313 ESSILOR INTL. 8,733 VALLOUREC 8,728 STMICROELECTRONICS 8,306 LAGARDERE S.C.A. 6,152 TECHNIP 5,882 CAC 40 (32 stocks) CAP GEMINI 5,838
Index Stock Average market capitalisation, EUR million
HERMES INTL 9,535 SES 8,216 THALES 7,545 SODEXO 7,109 ADP 7,045 CASINO GUICHARD 6,550 GECINA NOM. 6,248 SAFRAN 6,184 AIR FRANCE -KLM 5,714 LEGRAND 5,705 EIFFAGE 5,639 PUBLICIS GROUPE SA 5,602 KLEPIERRE 5,274 DASSAULT SYSTEMES 5,008 CGG VERITAS 4,386 JC DECAUX SA. 4,372 EUTELSAT COMMUNIC. 4,212 ILIAD 3,892 CIMENTS FRANCAIS 3,831 IMERYS 3,525 TF1 3,287 PAGESJAUNES 3,266 BIC 2,645 ATOS ORIGIN 2,606 NEOPOST 2,532 METROPOLE TV 2,496 GEMALTO 2,347 NEXANS 2,293 VALEO 2,231 BOURBON 2,224 ZODIAC AEROSPACE 2,145 ARKEMA 2,039 S.E.B. 2,014 REMY COINTREAU 1,853 NEXITY 1,849 RHODIA 1,837 MAUREL ET PROM 1,740 UBISOFT ENTERTAIN 1,703 THOMSON (EX:TMM) 1,641 HAVAS 1,510 TELEPERFORMANCE 1,405 BENETEAU 1,379 ORPEA 1,351
VILMORIN & CIE 1,146
SOITEC 925 DERICHEBOURG 873 IPSOS 806 INGENICO 800 SBF 120 (excl. CAC 40, 57 stocks) AREVA CI 794
ALTEN 702 GROUPE STERIA 698 EUROFINS SCIENT. 681 CLUB MEDITERRANEE 666 BONDUELLE 659 CARBONE LORRAINE 631 ALTRAN TECHN. 566 SPERIAN PROTECTION 545 ALTEN 702 GROUPE STERIA 698 EUROFINS SCIENT. 681 CLUB MEDITERRANEE 666 BONDUELLE 659 CARBONE LORRAINE 631 ALTRAN TECHN. 566 SPERIAN PROTECTION 545
______________________________________________
Publisher:
Edouard Vieillefond e.vieillefond@amf-france.org 01.53.45.63.65
Editor-in-chief:
Fabrice Pansard f.pansard@amf-france.org
01.53.45.63.57
Secretary:
Muriel Visage m.visage@amf-france.org
01.53.45.63.35
Note — The Working Papers series is coordinated by the AMF Research Department. It contains research carried out in-house or by outside researchers from the academic world with whom the AMF cooperates on a regular basis, notably through the Scientific Advisory Board.
Articles in Working Papers express the personal views of their authors, which are not necessarily the views of the AMF.