An Initial Case Study. Understanding
Warranty Management Issues
Case studies have normally been used to support and help theoretical subjects in engineering and other research fields. When these cases are developed, it is usually found that such an amount of information can either trivialize the study or com-plicate it beyond a reasonable level. Therefore, the intention here is to synthesize a practical case, which transmits easily how a proper management of warranty assistance helps to reduce costs, enables us to make suitable decisions, and improves the image of the company in front of the client. As mentioned at the beginning of this research, there are different types of warranties according to the different products in the market (consumption products, commercial products,
industrial, standard or personalized products, etc.) [1]:
• Standard Products: Free Replacement Warranty (FRW), Pro Rata Warranty
(PRW), or a combination of both.
• Commercial Products (purchased in volume): Warranty applied to a fleet or
group of items.
• Personalized Products: Reliability Improvement Warranty (RIW).
• Base Warranty and Extended Warranty.
• Etc.
The case examined here deals with a customized product and the warranty management with the client. This study starts summarizing the background related to warranty, highlighting the importance of a warranty cost management system. Once the problem is defined and along with the development of a particular case study, analysis of data and conclusions will be shown. Besides, a procedure is also proposed related to the way of working among different sections inside a generic company. This procedure will be examined succinctly using a workflow chart.
Other practical cases in the field of warranty can be found in [2].
V. González-Prida Díaz and A. Crespo Márquez,After-sales Service of Engineering Industrial Assets, DOI: 10.1007/978-3-319-03710-3_2, Springer International Publishing Switzerland 2014
2.1 Background
In order to apply an effective warranty management, it is critical to gather proper data and exchange the different types of information between the modules into
which a management system can be divided [3]. In our case, a warranty
man-agement will be proposed, as a system based on a several modules organization. In the literature review (this chapter), one can observe different interactions between warranty and other disciplines, and how they are dealt with by the different models and authors. In particular summarizing, three important interactions must be considered:
1. Warranty and Maintenance: In many cases, the warranty period is the time
when the manufacturer still has a strong control over its product and its behavior. Additionally, the expected warranty costs normally depend, not only on warranty requirements, but also on the associated maintenance schedule of
the product [4].
2. Warranty and Outsourcing: The warranty service or, in general, the after-sales
department of a company, is usually one of the most susceptible to be out-sourced due to its low risk and also to the fact that, among other features,
outsourcing provides legal insurance for such assistance services [5].
3. Warranty and Quality: The improvement of the reliability and quality of the
product not only has an advantageous and favorable impact in front of the
client, but also this improvement highly reduces the expected warranty cost [6].
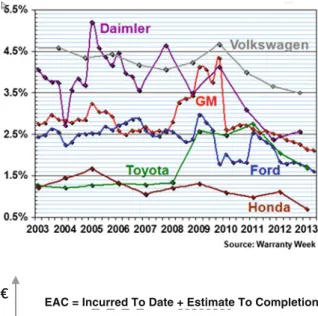
However, in the vehicle industry for example (see Fig.2.1), it is probably a
simplification to consider a low ratio of client’s claims supposes high quality, that is because such situation has to do with those companies that reject
cus-tomer claims redirecting them to the suppliers. In Fig. 2.1, the axis of ordinate
indicates the percentage dedicated to warranties in respect of the income in vehicle sales.
4. Warranty and Cost Analysis: In reference to costs estimations (see Fig. 2.2), and
apart from warranty issues, there are nowadays several methods to accurately estimate the final cost of a specific acquisition contract. In our case study, the method applied in a simplified way is denominated ‘‘Estimate at Completion’’ (EAC).
In few words, EAC is a management technique used in a project for the cost control progress. Here, the manager foresees the total cost of the project at completion, combining measurements related to the scope of supply, the delivery schedule, and the costs, using for that purpose a single integrated system. Warranty costs can be included in the global analysis of the project, providing the estimation costs of the same service generated at the end of contractual responsibility.
2.2 Case Study Scenario
The company that is focused on in the case study is a large manufacturer in the metal industry that operates globally. The company designs, manufactures, and purchases a wide range of industrial vehicles (such as machinery used in forestry, hydraulic excavators, or track loaders) for industrial customers, as well as other related products such as spare parts. In addition to the purchase of standard vehicles, nowadays the customization of machines is also common. In our case, the company must supply the client with a specified amount of customized vehicles on a defined schedule. In the contract, warranty assistance is included for the vehicles of the fleet during a period of time that starts when each vehicle is delivered to the customer. To provide the after-sales service in a satisfactory way, the fulfillment of some conditions is required:
1. Teams formed by properly trained personnel. 2. Tools for maintenance/warranty tasks.
3. Materials and spare parts to carry out the repairs.
Fig. 2.1 Ratios of warranty claims from 2003 to 2013
EAC = Incurred To Date + Estimate To Completion
Time Now
Program Follow-up
Fig. 2.2 EAC formula (adapted from [7])
The first two conditions are considered fulfilled. Regarding the third condition, the necessary materials for warranty operations are obtained from the same warehouse as the assembly line. This way, there are two possibilities to recuperate the material:
• When the piece is repairable, a spare part is taken from the warehouse, which is
later returned after the disassembly of the product being repaired.
• When the piece is not repairable, a spare part is also taken from the warehouse,
but it must be restored by the purchase of another.
This situation is possible because the manufacturing stock allows the supply of material for warranty assistance without risking the necessities of the assembly line. The problem in this scenario is defined as follows: Due to the fact that manufacturing and warranty assistance share the same warehouse, there will be instances where the manufacturing is at a very advanced stage and simultaneously there will be many vehicles under warranty. From this moment onwards, every decision made prioritizes one of the two activities. Apart from the context described above, the study takes place during the lifetime distribution of delive-rables. This means that, historical data regarding costs, faulty items, etc., are available for the research. In reference to the faulty items, it has been used a classification tree with several levels following a hierarchical structure based mainly on their functionality, and reaching a sufficient level of detail in terms of procurement aspects. In figures, the described scenario and the delivery schedule
are shown in Table2.1. Our case study will be developed considering also the
following hypothesis:
• Every vehicle has the same reliability (they have the same failure probability).
• The warranty cost is constant with the time.
• The warranty time does not stop at any moment.
The EAC for warranty depends on company policy. Usually, the budget for warranty is determined as a percentage of the total project cost. In our case study, the total cost, manufacturing plus indirect costs for each vehicle, is supposed,
amounts to ca. 375,000.00 €and the percentage for warranty attendance will be
2 % of the budget for total costs. That yields around 2,625,000.00 € for the
attendance of warranties during the whole project.
2.3 Analysis, Development, and Results of the Case Study
In the literature review of the previous chapter, many case studies can be found which are related to the data analysis taken from warranty assistance (qualitative and quantitative date). This analysis is based on real data and offers a substantial
amount of detail. Two references that offer a complete revision of this topic are [8]
2.3.1 Costs Analysis of the Warranty Assistance
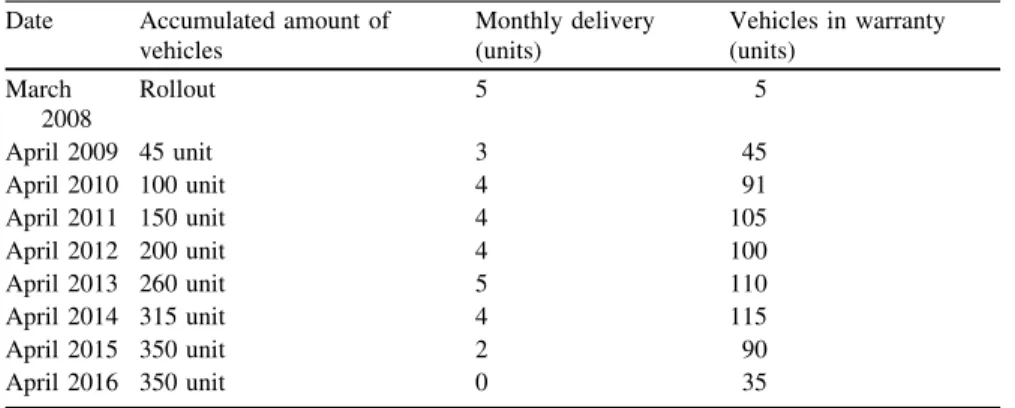
As mentioned, the study takes place when the company has already delivered a number of 150 vehicles. In this time, there are 105 vehicles under warranty. Some
preliminary data are shown in Table2.2. Together with this, there is also a sample
regarding the number of vehicles under warranty according to the defined delivery schedule. Some figures here have been rounded off in order to simplify their use during the study.
Table2.2 (as commented) is only a sample extracted from the complete
delivery schedule. From this complete schedule, it is possible to note that the warranty expiration date of the first vehicles is obviously on March 2010 and, also,
that the most critical moment (t2) will be in September 2013. The graphic in
Fig.2.3can help to illustrate it.
In April 2014 (t2), the already delivered fleet—315 units—will have a
maxi-mum number of vehicles simultaneously under warranty—115 units—(see con-tinuous graphic line). In this moment, we can observe how close the due date of the deliveries is (April 2015). Consequently, much closer (and critical) is the
manufacturing of the last vehicles. In t2, our teams of maintenance/warranty
technicians will have to attend a high number of vehicles which will demand a huge number of spare parts. At the same time, the operators of the assembly line will request pieces for the production of the last vehicles. The shared warehouse will have in storage enough pieces for manufacturing, but not for more, so the supply of any spare parts demanded by the after-sales personnel must be carried out taking into consideration the importance of the material, the time to repair the disassembled piece, and/or the time to restore it by purchase. Every piece in the
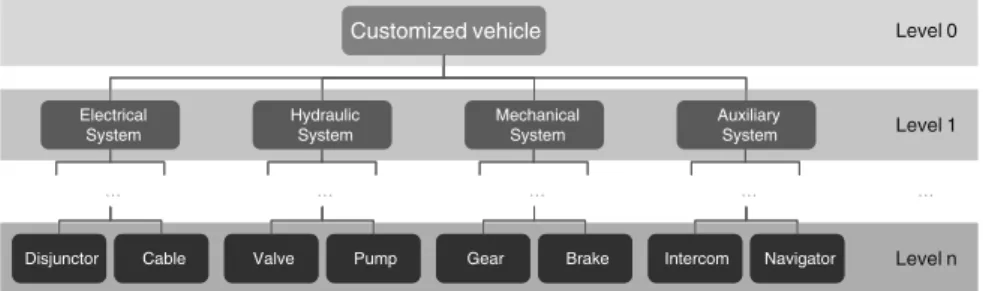
classification tree (see Fig.2.4) belonging to the lowest level (level where
mate-rials can be procured) will have a weight (or critical) which changes with time. Every piece will be considered much more critical as the end of the manufacturing process gets closer. Therefore, and taking also into account a costs analysis, it is
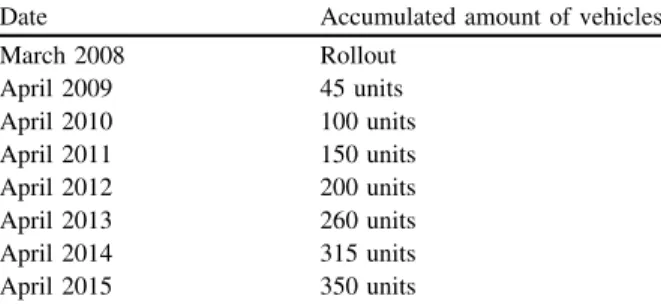
Table 2.1 Data of the
described scenario Date Accumulated amount of vehicles
March 2008 Rollout April 2009 45 units April 2010 100 units April 2011 150 units April 2012 200 units April 2013 260 units April 2014 315 units April 2015 350 units
Total amount of customized vehicles to be delivered: 350 units Warranty period for each vehicle: 2 years
Warranty expiration for last vehicle: March 2017
Time point of the case study (t1): April 2011 (150 unit already
necessary to bear the investment of a minimum strategical stock in mind in order not to leave warranty claims unattended.
Considering the data indicated above, it is possible to carry out a simple costs analysis obtaining some average values. Calculation of some values:
• Warranty cost per complaints:
CC =C1/R1=1,000,000.00/1,200 =833.33 €
Table 2.2 Extract of the delivery schedule Date Accumulated amount of
vehicles Monthly delivery (units) Vehicles in warranty (units) March 2008 Rollout 5 5 April 2009 45 unit 3 45 April 2010 100 unit 4 91 April 2011 150 unit 4 105 April 2012 200 unit 4 100 April 2013 260 unit 5 110 April 2014 315 unit 4 115 April 2015 350 unit 2 90 April 2016 350 unit 0 35
Number of delivered vehiclest1:V1=150 units
Number of warranty claims int1:R1=1,200 warranty claims
Warranty incurred cost int1:C1=1,000,000.00€
EAC for Warranty: EACw=2,625,000.00€
Number of vehicles to be delivered:V(t)=(according to delivery schedule)
Evolution of vehicles under warranty
0 50 100 150 200 250 300 350 400 ma r-0 8 sep -08 ma r-0 9 sep -09 ma r-1 0 sep -10 ma r-1 1 sep -11 ma r-1 2 sep -12 ma r-1 3 sep -13 ma r-14 sep -14 ma r-1 5 sep -15 ma r-1 6 sep -16 ma r-1 7 Month Am ount of ve hi cl e s
Monthly delivery Cumulative Vehicles under warranty
t1 t2
• Warranty cost per vehicle:
CV=C1/V1=1,000,000.00/150=6,666.67€
• Complaints per vehicle:
RV=R1/V1=1,200/150 =8 complaints
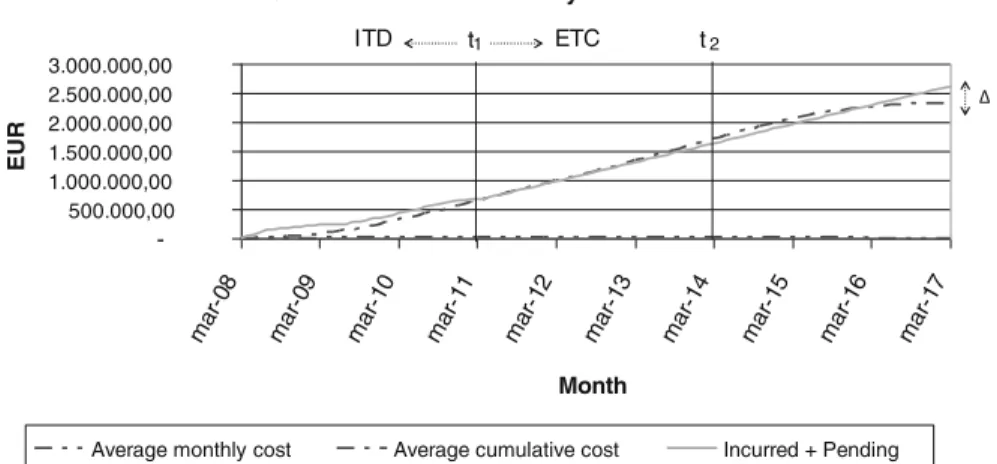
With these values, and in order to illustrate them more clearly, a graphic
(Fig.2.5) is included in the warranty evolution in terms of costs. That is because
the total incurred warranty cost of every vehicle has been considered in a con-servative way. That means they have been treated as already incurred costs when each vehicle is delivered to the customer. Therefore, the accumulate warranty cost does not increase after the delivery of the last vehicle. In further studies, it will be possible to consider as well several destinations of the vehicles, where a maximum number of local vehicles can happen in different moments of the defined lifetime and costs must include the movement of warranty teams to different locations.
Comparing the above results with the foreseen costs indicated in the EAC, a
graphic is obtained as the one set out in Fig.2.5. The EAC is formed by a first part
already known, which refers to the Incurred to Date (ITD), plus a second foreseen part (continuous gray line), which refers to the Estimate to Completion (ETC). Apart from the EAC line, the warranty cost line obtained from the cost average in
t1 is also here implemented (discontinuous black line). As a result from this
graphic comparison, one can see that the cost at the end (ca. 2,335,000.00€) is
slightly lower than the budget considered at the beginning of the project
(2,625,000.00 €). This means, there is a budgetary buffer of ca. 290,000.00 €,
which can be used for the investment of a strategic stock of spare parts. This amount would correspond to the budget for attending the warranty of around 43 vehicles, or equivalent as if the warranty assistance should be taking the advantage of ca. 15 months before the end of the manufacturing process. Other interesting average values that can be obtained from this exercise are for example the esti-mated total amount of warranty claims, which shall be around 2,800 reclamations. Anyway, and as the main conclusion of this analysis, the procurement of these strategic spare parts should avoid the use of the stock shared with the assembly line, offering this way an appropriate service to the client. That is due to the possibility of assisting warranties independently of the manufacturing department and consequently, not affecting the final goal of the project.
Customized vehicle Electrical System Disjunctor Cable Hydraulic System Valve Pump Mechanical System Gear Brake Auxiliary System
Intercom Navigator Level n
Level 1 Level 0 … … … … … Customized vehicle Electrical System Disjunctor Cable Disjunctor Cable Hydraulic System Valve Pump Valve Pump Mechanical System Gear Brake Gear Brake Auxiliary System Intercom Navigator
Intercom Navigator Level n
Level 1 Level 0
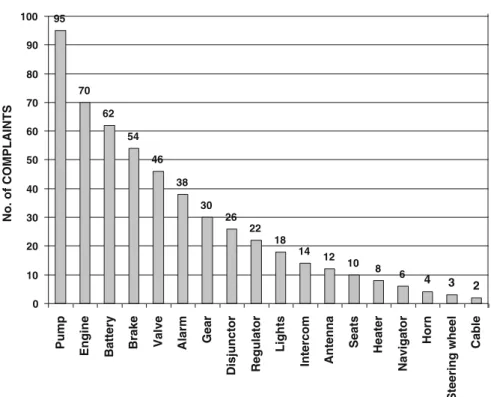
2.3.2 Quantitative Analysis of the Claims
It has been possible to compile data for a large variety of items with customer complaints. These items are classified according to their functionality and also
divided into components that can be procured (see Fig.2.4: Classification tree of
components). Fig.2.6exposes a sample of the gathered data as an example for this
case study.
This kind of analysis usually helps not only the quality department, but also the manufacturing process, in order to focus on the components which have more incidents during the warranty period. By improving the manufacturing process or taking special care during the assembly of components, it is possible to reduce complaints regarding a specific item. Due to the large amount of components in complex systems such as an industrial customized vehicle, it is suggested to select the items to make all the gathered information easier to manipulate. The set of criteria to select a group of items is not exclusively related to the number of failure occurrences. The cost of such components is also important, as well as the delivery time to procure them, etc. In general, it is important to know how critical each component is for the company and for the fulfillment of the production line. All these features will be conditions to bear in mind when the time to make a decision comes. In other words, these features will be turned into factors which will give a specific weight to each component. This weight will finally help the manager to make the proper decision. By taking this into account, and referring back to the previous figures and data included in the graphic, it is possible to transform the data in terms of relative frequency. This relative frequency refers to the number
(ni) of times that an event (i) takes place (in our case, failures) and divided per the
total number of events (Rni). Considering therefore statistical concepts (and
together with other factors) is possible further on to weigh, as mentioned, the value
Costs evolution of warranty assistances
-500.000,00 1.000.000,00 1.500.000,00 2.000.000,00 2.500.000,00 3.000.000,00 ma r-08 ma r-09 mar -10 ma r-11 ma r-12 mar -13 ma r-14 ma r-15 ma r-16 ma r-17 Month EU R
Average monthly cost Average cumulative cost Incurred + Pending
t1 t2
ITD ETC
of each component in order to prioritize between the supplies for warranty
assistance or to keep the available piece for the manufacturing process (Table2.3).
A very interesting reference regarding analysis of data statistics is [10], where
data analysis is used for the improvement of TQM. The rest of the components are basically not considered because:
• They have been affected by a very small number of failures.
• They have been delivered fast enough and mostly in time.
• There is extra stock in warehouse due to the purchasing of a minimum amount
of pieces, greater than the real necessity.
• Or they are not, definitively, under the interest of the project managers’ point of
view, due to other reasons.
Summarizing, with the tasks previously explained in order to obtain a set of chosen components (those acknowledged as critical), what we are really com-posing is a list of strategical spare parts. This means that, in case the company approves the use of the budgetary buffer that supports of the warranty service, the purchasing process can be quickly launched. All these actions will finally lead the company to positive returns:
95 70 62 54 46 38 30 26 22 18 14 12 10 8 6 4 3 2 0 10 20 30 40 50 60 70 80 90 100 Pump
Engine Battery Brake Valve Alarm
Gear Disjunctor Regulator Lights Intercom Antenna Seats Heater Navigator Horn Steering wheel Cable No. of COMPLAINTS
COMPLAINTS ACCORDING TO COMPONENT
• By reducing the probability of paying penalties due to global delay in the project delivery.
• By improving the confidence of the client due to the completion of contractual
terms, such as the warranty assistance.
It is necessary to remark that everyone of the failures referred so far are dences considered to be under warranty. For further research in this field, inci-dences not considered under warranty are also included. The analysis of such events must take into account the reasons why these situations occur (bad training of the user?, poor information for maintenance?, clients accustomed to other family product with different behavior?, etc.). Anyway, in each case and even when the failure is not attributed to the manufacturer, the company must take interest in the possible causes.
2.3.3 Spare Parts Management for Warranty Assistance
Regarding logistics of warranty services, Ref. [11] discusses diverse questions in
this context. The change in the utilization of pieces from assembly line to warranty assistance has a negative effect in terms of cost on the whole project. The extra costs associated with the spare parts are of course due to the different prices between the acquisition of a piece at the beginning of the project for the whole fleet, and the acquisition of a piece punctually during the lifetime of the project and for a specific incident. Therefore, management must provide compensation
Table 2.3 Relative frequencies
Component Number of claims fi¼ni=Pni
Pump 95 0.1827 Engine 70 0.1346 Battery 62 0.1192 Brakes 54 0.1038 Valve 46 0.0885 Alarm 38 0.0731 Gear 30 0.0577 Disjunctor 26 0.05 Regulator 22 0.0423 Lights 18 0.0346 Intercom 14 0.0269 Antenna 12 0.0231 Seats 10 0.0192 Heater 8 0.0154 Navigator 6 0.0115 Horn 4 0.0077 Steering wheel 3 0.0058 Cable 2 0.0038
between the difference of values in order not to keep such increments in the total costs of manufacturing, but to incur in the total warranty costs.
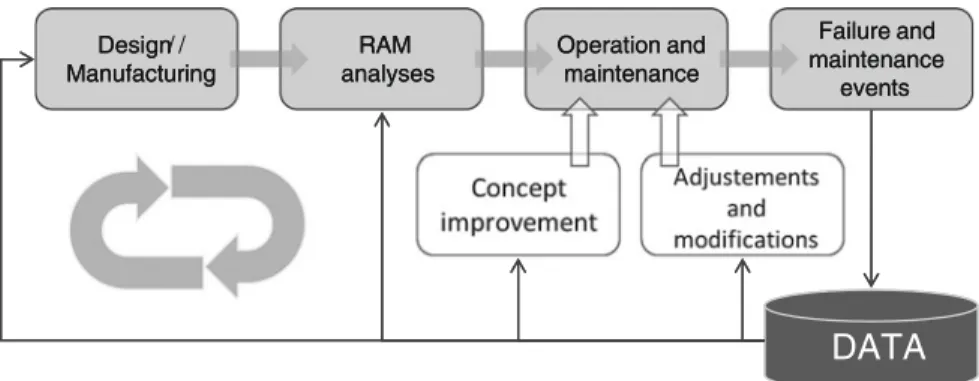
Consequently, the percentage incremented in the final price of purchase can also be a factor to bear in mind when estimating the weight for each component. In order to ascertain a correct warranty support service, the proposed action is basically to acquire various reserves that would allow repairs without delays in the vehicle manufacturing and simultaneously during the process and to supply spares to the warranty service from the assembly line in a reasonable way. According to the aforementioned considerations, and together with the data collected, the experience of warranty/maintenance technicians, the knowledge of the engineering department, and of course using the already developed techniques in maintenance
(Fig.2.7), it is possible not only to elaborate a spare parts purchase plan for
warranty, but also to improve the business decision-making process as well as to contribute with improvement actions for engineering and manufacturing. This purchase plan refers to an applicable list of essential parts to assure the satisfactory assistance of a large number of reclamations. At the end of the warranty period, the remaining spare parts can be negotiated with the client for their use in further maintenance tasks. This fact forces strict control of all these material parts so that they remain available for supply to the customer at the conclusion of the project. At the same time, this action will represent an opportunity to recuperate, at a determined point in the future, one part of the incurred cost. In general, decision-making will be the result of a process focused on a final choice among several alternatives. In our case, in order to lead the company to a fast and adequate decision-making process, every department should clearly identify what needs to be done and what is the scope of their responsibility. For the company in this case, we have adapted the idea of a warranty management system divided into modules, proposing furthermore, certain interactions among different departments within the company, which share the information, make suitable decisions according to their responsibilities, and coordinate activities to a common and profitable goal for the whole company. In order to illustrate such interactions, activities, etc., a workflow
has been used (Figs.2.8, 2.9) following a business process modeling notation
(BPMN) methodology as a graphical representation for this specific business process, making it more easily understandable. The considered departments here (including the client) are as follows:
• Logistics department (LD)
• Manufacturing department (MD)
• Administration (MB)
• After-sales department (AD)
• Quality department (QD)
• Purchasing department (PD)
• Engineering department (ED)
The process starts when the customer detects a failure in a vehicle and con-sequently informs the company. Communication can be addressed to different department of the company, but the most appropriate way is to channel them in only one communicator as, for example, the service or after-sales department. Anyway, the after-sales department can also detect failures in the course of its
maintenance activities (see Fig.2.8). In any case, once the information reaches the
after-sales department, the facilitated information is analyzed. If the incidence is considered not to be object of repair under warranty (for example, when the cause of the failure has been a wrong or bad utilization), the after-sales department informs the management board who finally decides if, in spite of this, the inci-dence is repaired as warranty. If the inciinci-dence is discarded as warranty repair, the management board should also inform the customer. The customer can of course disagree with such a consideration. Therefore, a list of interventions (those not considered firstly as warranty) must be negotiated between the parts. If the inci-dence is considered under warranty conditions, the after-sales department must carry out a diagnosis of the incidence, detecting the problem, analyzing its solu-tion, and determining the resources (staff and materials) and the necessary time for repair. In reference to the material, the warranty technicians must identify between the repairable and the non-reparable/consumable materials. In reference to the materials, warranty technicians must identify those repairable from those that are not or material for sale. The necessities in general are communicated to the company management who addresses the actions to the corresponding department (logistics, manufacturing, and/or purchasing department), in order to finally facilitate the material to the after-sales department. This is the moment when the company administration must make the most important decisions in terms of costs and manufacturing prevision. Once the after-sales department has the material (either by a loan from warehouse, by a loan by cannibalization, or acquisition by purchasing), they inform the management board (and afterward the client) (see
Fig.2.9) the subsequent action plans. The damaged material is sent to the
com-pany where the quality department (together in some cases with the engineering department) analyzes the failure. If the repair has been by replacement and the
Design/ Manufacturing RAM analyses Operation and maintenance Failure and maintenance events
DATA
Design / Manufacturing RAM analyses Operation and maintenance Failure and maintenance eventsDATA
CLIENT QUALITY DE PT. MANUFACT URING DE PT. AFT E R-SALES DEPT. ENGIN E ERIIN G DE PT. LOGIST IC DEPT. PURCHASING DE PT. Communi cates the fai lure t o M B .
Analizes the initial data.
Must the failure b
e con sid ered u nd er warranty?
Transmits the info
rmation to AD. NO YE S Decides , as a last resort,
if the failure must
be repaired u nder warranty . Re pair unde r warranty ? YE S Determines resources a nd dead lines
for the repair.
Is any material needed for the repair?
NO SI Communicates the corresponding d ept. th e n ecessary actions in o rd er to facilitate th e material to AD. Are t here sp ares in war eho us e? NO Is acepted? NO YE S YE S NO ADMINISTRA TION Fig. 2.8 Workflow of the warranty management process (part 1 o f 2 )
Is it a systematic failure?
Makes and manag
es the D
ata Base associated to the
in
ci
dences,
n
eeded for its follow-up
an d p erio d ical rev iew. Manages
the repair whose
charges impact in AD.
Is p ossible to obtain it b y cannibalization? Does it affect to the d eliv ery sch ed ule? YE S YE S Decides , as a las t res ort, if the p iece is lent. YE S Is the p iece lent? NO Informs t o AD ab ou t t he dis
position of materials for the
repair. YE S NO NO Manages the p urchasing whose
charges impact in AD.
NO YE S Makes the corres ponding N on Conformity Regis ter and se nds th e
failured material to the factory. Analyzes
and jus tifi es the causes . Inf orms to MB and C ab
out its Action
Plan . Resolv es th e in cidence an d fulfils the Closing Report. Informs t he C a bout th e clos ing of the in cidence. S ends to MB its Approval. NO NO YE S CLIENT QUALITY DE PT. MANUFAC T U RING DE PT. AFT E R-SALES DEPT. ENGINEE RIIN G DE PT. LOGIST IC DEPT. PURCHASING DE PT. ADMINISTRA TION Fig. 2.9 Workflow of the warranty management process (part 2 o f 2 )
material is identified as repairable, the quality department manages the repair, taking into account the appropriate certification.
The material, once repaired and certificated, will be stored again in a warehouse for its usage in the assembly line. In this process, every piece of data about the incidence, damaged material, repair, etc., gathered by the after-sales, quality, and engineering departments are introduced in a database which is followed up and reviewed by the quality department. Once the incidence is resolved, the after-sales department communicates the closure of the assistance to the company adminis-tration, who transmits this to the client. It is important to receive a document from the customer with the approval of the performed tasks and the acceptance of the service closure. The database associated with these incidences and necessary for their follow-up and should include, not only those incidences considered to be under warranty, but also the data about preventive and corrective maintenance performed on every vehicle, in order to enable the analysis of, for example, repetitive or systematic failures among others studies. The described workflow refers to a particular management of a specific case study. This workflow does not intend to be generic and therefore is susceptible to improvement. It is proposed in Chap. 5 a general management with the aim of, later in Chap. 6, criticizing or evaluating the way management works. Likewise, in continuation to this chapter, it is suggested to consult Appendices 1 and 3, where matters such as quantification of maturity and analytical hierarchy processes are dealt with based on what it has been developed in this chapter.
References
1. Murthy DNP, Blischke WR. 2005. Warranty management and product manufacturing. Springer-Verlag London Limited, pp 302?xviii. ISBN 1852339330.
2. Blischke WR, Murthy DNP. 2002. Case Studies in Reliability and Maintenance -, Wiley, New York, pp 661?xxiii.
3. Lyons K, Murthy DNP. 2001. Warranty and manufacturing, integrated optimal modelling. Production Planning, Inventory, Quality and Maintenance. Rahim MA, Ben-Daya M (Eds.). Kluwer Academic Publishers, New York, pp. 287–322.
4. Boyan Dimitrov, Stefanka Chukova, Zohel Khalil. 2004. Warranty Costs: An Age-Dependent Failure/Repair Model. Wiley InterScience, Wiley Periodicals, Inc.
5. Gómez J, Crespo Márquez A, Moreu P, Parra C, González-Prida V. 2009. Outsourcing maintenance in services providers. Safety, Reliability and Risk Analysis: Theory, Methods and Applications – Martorell et al. (eds), pp. 829-837. Taylor & Francis Group, London, ISBN 978-0-415-48513-5.
6. Stefanka Chukova, Yu Hayakawa. 2004. Warranty cost analysis: non-renewing warranty with repair time. John Wiley & Sons, Ltd. Appl. Stochastic Models Bus Ind, 20:59–71. 7. D. Christensen. 1993. Determining an accurate Estimate At Completion. National Contract
Management Journal 25:17-25.
8. Lawless JF. 1998. Statistical analysis of product warranty data. International Statistical Review, 66:41-60.
10. Murthy DNP, Solem O, Roren T. 2004. Product Warranty logistics: Issues and challenges. Euro. Jr. Oper. Res., 156:110-126.
11. International Standard. 2004. ISO/DIS 14224/2004. Petroleum, petrochemical and natural gas industries. Collection and exchange of reliability and maintenance data for equipment.