San Jose State University
SJSU ScholarWorks
Master's Projects Master's Theses and Graduate Research
Spring 5-20-2019
Emulation vs Instrumentation for Android
Malware Detection
Anukriti Sinha
San Jose State University
Follow this and additional works at:https://scholarworks.sjsu.edu/etd_projects
Part of theArtificial Intelligence and Robotics Commons, and theInformation Security Commons
This Master's Project is brought to you for free and open access by the Master's Theses and Graduate Research at SJSU ScholarWorks. It has been accepted for inclusion in Master's Projects by an authorized administrator of SJSU ScholarWorks. For more information, please contact
Recommended Citation
Sinha, Anukriti, "Emulation vs Instrumentation for Android Malware Detection" (2019).Master's Projects. 700. DOI: https://doi.org/10.31979/etd.5y5x-fm5n
Emulation vs Instrumentation for Android Malware Detection
A Project Presented to
The Faculty of the Department of Computer Science San José State University
In Partial Fulfillment
of the Requirements for the Degree Master of Science
by Anukriti Sinha
© 2019 Anukriti Sinha ALL RIGHTS RESERVED
The Designated Project Committee Approves the Project Titled
Emulation vs Instrumentation for Android Malware Detection
by Anukriti Sinha
APPROVED FOR THE DEPARTMENT OF COMPUTER SCIENCE
SAN JOSÉ STATE UNIVERSITY
May 2019
Dr. Mark Stamp Department of Computer Science
Fabio Di Troia Department of Computer Science
ABSTRACT
Emulation vs Instrumentation for Android Malware Detection by Anukriti Sinha
In resource constrained devices, malware detection is typically based on offline analysis using emulation. In previous work it has been claimed that such emulation fails for a significant percentage of Android malware because well-designed malware detects that the code is being emulated. An alternative to emulation is malware analysis based on code that is executing on an actual Android device. In this research, we collect features from a corpus of Android malware using both emulation and on-phone instrumentation. We train machine learning models based on emulated features and also train models based on features collected via instrumentation, and we compare the results obtained in these two cases.
ACKNOWLEDGMENTS
I would like to give my utmost appreciation, gratitude and respect to my advisor Prof. Mark Stamp for his guidance, encouragement, amiable and positive attitude as well as having confidence and faith in his student to take on and complete a challenging project. I would like to thank him for giving me the opportunity to go an uplifting and exciting journey of learning and implementing knowledge. I would also like to thank my committee members, Prof. Fabio Di Troia and Prof. Philip Heller for their continued guidance and motivation towards my project. Lastly I would like to thank my parents, Dr. Ajay Kumar Sinha and Alpana Varma for their blessings, love, support and encouragement all these years.
TABLE OF CONTENTS
CHAPTER
1 Introduction . . . 1
2 Background . . . 3
2.1 Existing feature analysis techniques for malware detection . . . . 3
2.1.1 Static feature analysis . . . 3
2.1.2 Dynamic feature analysis . . . 5
2.2 Flaws in current emulator scanning process . . . 7
3 Methodology . . . 9
3.1 Process for data collection . . . 9
3.1.1 Dataset 1: dataset used for malware detection experiment 9 3.1.2 Dataset 2: dataset used for classification of malware into families . . . 9
3.1.3 Environmental setup for feature extraction . . . 9
3.1.4 Dynalog: Dynamic feature extraction Framework . . . 10
3.1.5 Feature extraction using Weka . . . 13
3.2 Supervised Machine Learning Models . . . 13
3.2.1 Metrics to evaluate effectiveness of emulator vs instrumentation based malware detection . . . 15
4 Experiments . . . 17
4.1 Evaluating effectiveness of emulator vs instrumentation based analysis . . . 17
4.1.2 Classification of samples into malware families based on
phone vs emulator features . . . 22
5 Conclusion and Future Work . . . 25
APPENDIX
Appendix A . . . 29 A.1 Graphs for evaluating effectiveness between emulator vs.
LIST OF TABLES
1 Drebin data collected . . . 10
2 Effectiveness of feature extraction from both environments for
Dataset 1 . . . 17
3 Effectiveness of feature extraction from both environments for
Dataset 2 . . . 17
4 Features exclusively extracted from the phone environment using
Dataset 1 . . . 19
5 Calculation of evaluation metrics for emulator based features . . 20
6 Calculation of evaluation metrics for phone based features . . . . 21
7 Calculation of evaluation metrics for emulator-based features
extracted from apps executed on both environments . . . 21
8 Number of FN classified by ML models . . . 23
9 Number of FP classified by ML models . . . 23
10 Accuracy of classifying samples into families using phone and
LIST OF FIGURES
1 Relevant Android trends. . . 2
2 APK bundle. . . 5
3 Sample AndroidManifest.xml file. . . 6
4 Dynalog tool working [22]. . . 11
A.5 SVM performance for phone vs emulator based features. . . 29
A.6 Naive Bayes performance for phone vs emulator based features. . 29
A.7 Random Forest performance for phone vs emulator based features. 30 A.8 J48 performance for phone vs emulator based features. . . 30
A.9 MLP performance for phone vs emulator based features. . . 30
A.10 PART performance for phone vs emulator based features. . . 31
CHAPTER 1 Introduction
In 2007, Google developed a mobile operating system (OS) called Android, based on the Linux kernel and other open software implementation, which is used primarily on touchscreen devices like tablets and smartphones. Google distributes Android as an open source platform, the benefits of which are access to usage data and profiling (understanding usage data to give more personalized experience), higher market penetration and encourage use of smartphones as a computing platform [1]. Android's exponential growth and dominance in the mobile OS market have impressed market shareholders, researchers, developers and users alike [1]. With over a billion devices sold and more than 65 billion applications (apps) downloads from Google Play Store, Android has over 80% of the market share in the mobile OS field [2].
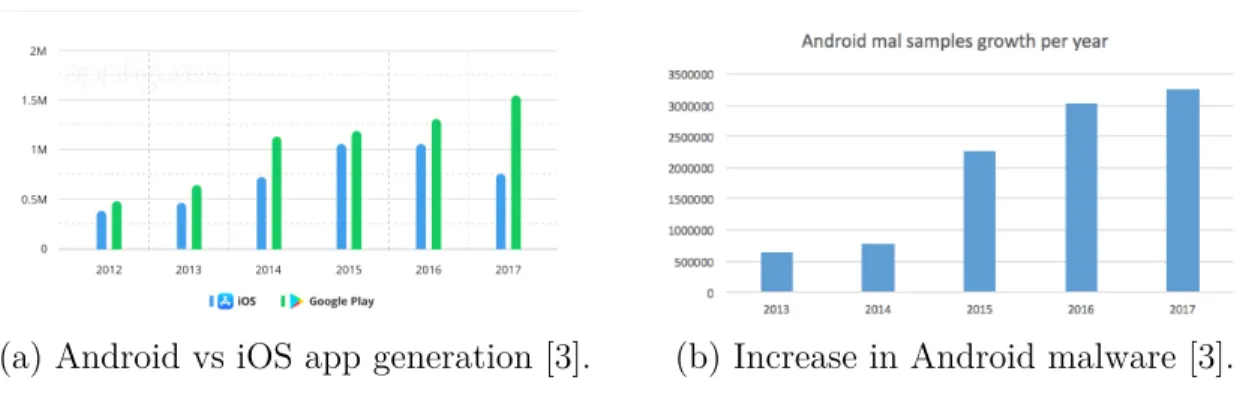
Figure 1 (a) shows the growth of Android app generation compared to Apple's iOS app development from 2012 till 2017 [2]. Such prominence has attracted the development of Android malicious applications, or malware. According to McAfee, more than 3,000,000 Android malware apps were detected in 2017---which represents a 70% increase from 2016---and some 700,000 malicious apps were removed from the Google Play Store in 2017 [3]. Figure 1 (b) shows the number of malicious apps increase from 2012 to 2018 [3].
With each new malware being developed, new anti-detection techniques to mask the malware from being scanned is on the rise [3]. Google Play Store uses emulators to scan third party apps for content. Smart malware writers, aware of this scanning bot, write their malware in a way to recognize if an emulator is running in the background and obfuscate the malware's runtime variables and permission calls to avoid detection [3].
(a) Android vs iOS app generation [3]. (b) Increase in Android malware [3]. Figure 1: Relevant Android trends.
extraction derived from instrumentation (on-phone analysis) vs. emulation for counter-ing anti-malware detection techniques devised by malware writers based on the flaws of the current detection techniques. We shall compare the robustness analysis of two different feature collection platforms to understand if one can be significantly better than the other. This exploration will provide insight into the following questions:
• How can we collect and analyze data from an emulation and instrumentation based setup?
• How can we increase the efficiency of Android malware detection while making malware detection techniques more robust and foolproof
The remainder of this paper is organized as follows. Chapter 2 gives a basic overview of current feature analysis methods to detect android malware. Chapter 3 discusses the proposed methodology. Chapter 4 explains the experiments performed and the results obtained, while Chapter 5 contains our conclusion and discusses future work.
CHAPTER 2 Background
The number of users dependent on Android apps and the amount of user sensitive data being handled by these apps make securing them a critical aspect. It is necessary to have good feature set that can be used to give a good accuracy for detection of Android malware apps. As time progresses, the attacks become more sophisticated and malware detection techniques should be improved [4].
2.1 Existing feature analysis techniques for malware detection
For mitigation of Android attacks, there are two probable methods---static feature analysis and dynamic feature analysis [4].
2.1.1 Static feature analysis
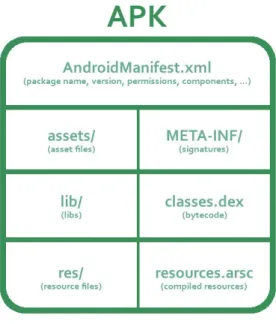
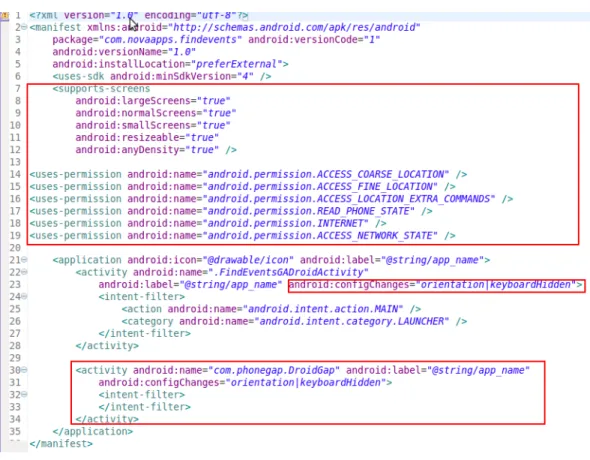
An Android app consists of bundled package known as Application package, abbreviated as .apk files. The package contains an AndroidManifest.xml, classes.dex and external libraries. Figure 2 shows the components of an APK bundle. Figure 3 shows an example of a typical AndroidManifest.xml file. Static features are extracted from the manifest.xml files of Android app codes.
Static analysis of apps means that the apps are checked for malicious content without being executed, just by analyzing the source code [5]. There are various emulators that can extract static features from apps [6]. A considerable amount of research has been done on static feature extraction. Researchers first started by using permission numbers (functionalities given a permit to run on the Android emulator environment) as a major static feature to judge apps for suspicious activities, but the detection rates were not as high as expected [6]. Other static features such as application programming interface (API) scans and developer certificates were used in further research but were not optimal due to cost of extraction of features for API scans and sparse data issues in case of developer certificates [7]. The main constraint
of static feature analysis is that it may miss some part of the code (as the code is not being executed but analyzed manually) and not be able to detect malicious code [7].
Static features can be used in two ways [8]:
1. Signature based detection---In signature based detection, the behavior of already labeled malware data is used to create data flow dependencies to analyze the behavior of the apps. Internal component control graphs are used to flag new unknown samples if the same behavior is shown by the new samples.
2. Anomaly based detection---Features extracted from the apps are passed to machine learning models for analysis. The models are trained on these features and the same set of features extracted from new unknown samples is passed through these models. Using the results from the machine learning models, researchers flag samples as malware or benign. Different malware families can also be classified together.
The advantages of using static feature analysis are: 1. The cost of computation is low.
2. Less execution time consumption than dynamic analysis. 3. Low resource utilization.
The disadvantages of static feature analysis are: 1. Code obfuscation can confuse static feature analysis.
2. High possibility of missing out chunks of codes as the code is scanned but not executed.
Figure 2: APK bundle.
Code obfuscation is the main reason that research was focused towards using dynamic features for Android malware detection. It was a technique to provide security and privacy by disabling reverse engineering of the code to understand it's behavior or tamper with the code. Malware writers use obfuscation tools like IBM ProGuard which is inbuilt in Android Studio to change data pathnames, variables, functions names to make it look like benign code [9].
2.1.2 Dynamic feature analysis
Dynamic feature analysis is analysis of runtime variables and dynamic code loading (analyzing the code while it is executing) [10]. Dynamic feature analysis is still in it's nascent stages. Some popular methods of dynamic feature analysis are kernel processing, sensitive API monitoring and dynamic loading. These techniques deal with analyzing the internal system calls made by the application at runtime [10].
Researchers incorporated machine learning models like 𝐾-means clustering at server side which analyzed log files generated by apps after execution and sorted into benign and malicious apps [11]. For dynamic feature extraction, people in academia
Figure 3: Sample AndroidManifest.xml file.
and research also use API calls like systrace to extract dynamic features of apps [11]. Dynamic analysis is more intuitive as it is difficult to obfuscate runtime variables to fool security scanners and emulators while passing as a benign piece of code. Methods like scanning frequency of system permission level requests and dynamic loading of runtime variables are being experimented with to gain more accurate results [11]. Even though there is a slight increase in accuracy, the cost of execution is high [11].
Dynamic feature extraction requires running the code on an emulator to under-stand it's runtime behavior, calls and variables [12]. Malware writers found loopholes in this scanning feature by tracking if an emulator is running in the background and obfuscating the runtime behavior to avoid detection of their apps. The next section
methods to counteract these anti-detection techniques.
2.2 Flaws in current emulator scanning process
Malware infected Android applications can have access to phone data and attain privacy sensitive information, page texts or calls to contacts or even root the phone and tampers with phone settings. Malware apps try to read the background environment using methods like Application Programming Interface (API) which can help them identify if an emulator is scanning them.
An example of an API used to detect emulators would be Telephony Manager API method
TelephonyManager.getDeviceId()
which returns000000000000000when an emulator runs in the background. This result of running the API shows that the runtime environment is that of an emulator and not a real physical device because a phone does not return 0's as the device identifier. This is one of the emulator detection methods used by the Pincer family of Android malware [14]. The emulator networking environment differs from a real phone's networking capabilities. Thus, by reading the networking calls and functionalities of the runtime environment, some malware apps have been shown to detect emulator scans.
Morpheus was a malware infected app which when executed on different emulators has exposed more than 10,000 detection heuristics based on some artifacts that can be used to detect the run-time analysis environments [16]. These artifacts can be modified and used in malware apps to to hide the malicious activities accordingly during run time scans. To deal with these flaws, researchers have tried to develop better versions of emulators. Emulators require hardware virtualizations and most emulators use open source hypervisors like QEMU which is also has a functionality that can be read by malware apps. Several dynamic analysis tools such as TaintDroid [17], DroidBox [18],
CopperDroid [15], Andrubis, AppsPlayground and online based tools are available for Android malware analysis such as SandDroid [19], CopperDroid [15], TraceDroid [20], and NVISO ApkScan [21]. These dynamic approaches can again be discarded on the assumption that they are running on an emulator or virtualized environment [22].
CHAPTER 3 Methodology
This chapter explains about the process of dynamic feature extraction from Android malware and benign apps on emulator and a real phone. The next section gives detail about the data collection methods used for the feature extraction.
3.1 Process for data collection
Data collection was a critical aspect in judging effectiveness of malware detection based on features collected from emulator and phone based environments. To do the same, there were configurations and constraints to be setup and followed. These along with dataset details are explained in the sections below.
3.1.1 Dataset 1: dataset used for malware detection experiment
In order to perform and evaluate malware detection, 2 types of files are involved: • The apk file containing the malware --- Malware file
• An apk file containing no malicious content --- Benign file
The dataset used in the experiments contains a balanced or equal set of malware and benign files to avoid data bias in experiments. It contains 2444 files, 1222 of which are malware and the rest are benign. The 1222 malware samples were obtained from 49 families of the Android Malware Genome Project [22]. The benign files were from Mcafee Labs data [22].
3.1.2 Dataset 2: dataset used for classification of malware into families
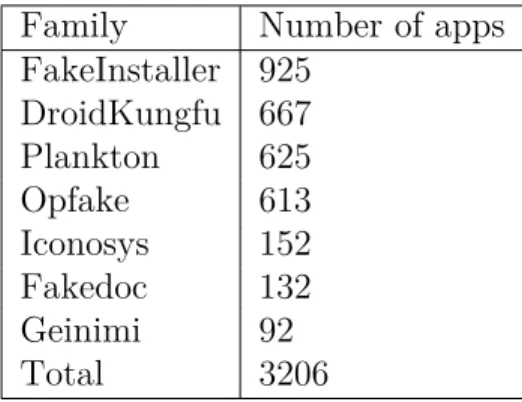
We used 7 families from the Drebin dataset, details given in Table 1 to extract features to be used for classifying malware samples into families.
3.1.3 Environmental setup for feature extraction
Feature extraction was performed on two different environments, emulator and real phone.
Table 1: Drebin data collected
Family Number of apps
FakeInstaller 925 DroidKungfu 667 Plankton 625 Opfake 613 Iconosys 152 Fakedoc 132 Geinimi 92 Total 3206
Phone setup: The Android smartphone which was used for data collection had the
following configuration: Android 5.0 Lollipop, 1.3 GHz CPU, 16 GB internal memory and 32 GB of external SD card storage. Along with these specifications it was made sure that the phone also contained a SIM card with activated service to enable 3G data use and outgoing calls [22].
Emulator setup: A Santoku Linux VirtualBox based machine was used to emulate
an Android device. It had the following configurations: 8 GB of external SD card memory, 2 MB of memory, 4.1.2 Jelly Bean (API level 16) android version. The emulator also had the following enhancements were also made to the emulator to emulate the working of a real phone --- adding contact numbers, images, pdf files, text files and changing the default IMEI, IMSI, Sim serial number and phone numbers. After each application is executed, the emulator is restored which ensures the removal of all third party apps [22].
3.1.4 Dynalog: Dynamic feature extraction Framework
creates logs of dynamic features and extract these features for future processing. It is described in [23] and was created by researchers at Queen’s University in Ireland. The components included in Dynalog as explained in [23] are --- APK instrumentation module, emulator-based analysis sandbox, app trigger, feature logging and extraction as well as processing scripts. It has the capability to execute applications by creating an environment to execute required API calls. This gives us access to monitor, log and extract features during run-time analysis. The base or core of Dynalog is the MonkeyRunner API that is able to trigger apps with multiple random events like press, swipe, touch screen and many others which makes sure that activities that can cover maximum code functionalities is covered.
Figure 4: Dynalog tool working [22].
To perform dynamic feature extraction from the phone, Dynalog can be imple-mented with python based tool, keeping in mind the following constraints/setup that were explained and taken directly from [23].
• For the first step make sure to populate the phone's contact list by pushing a list of contacts to the device SD card and then importing them by using adb
shell command.
• Find and uninstall all third-party applications before installing the app from which the features will be extracted from (app we want to analyze). This process is performed by the instructions below.
uninstall = "adb shell pm list packages -3 | cut -d’:’-f2 | tr ’˚’’’| xargs -r -n1 -t adb unistall"
print("unistalling all 3rd party user apps")
• Make sure the phone is not in airplane mode as it disconnects network and call connectivity which will hinder the dynamic analysis process. Another aspect to be careful about is that the MonkeyRunner API sometimes activates the airplane mode due to its randomly sending events such as touch screens, presses and swipes.
• Make sure that the phone had adequate charge (is not on low battery). If the phone becomes almost discharged during the analysis, put the analysis on sleep, recharge the phone and then continue the analysis.
• Outgoing call dialing using adb shell.
• Put data inside the phone SD card in the form of folders containing dummy images , pdf and text files.
Each application is executed for 15 minutes so that we can log and collect the runtime dynamic features from both the phone and emulator environment. The API calls are logged because of the use of adb logcat command [23]. As stated in [23] for malicious apps that have capabilities to implement anti-emulator techniques, it is expected that the execution of API call which could lead to the extraction of features that show malicious behavior of the app would not be logged as the malware will attempt to mask this behavior. Figure 4 shows the working of the Dynalog tool [22].
3.1.5 Feature extraction using Weka
The features processed from the phone and emulator after all apps are executed is then preprocessed into log file containing feature vectors which represent extracted from the apps. The files are saved in ARFF format so that they can be inputed into the Weka tool, a dynamic machine learning implementation platform. At first, the 178 features extracted for both the emulator and phone were fed into the Information Gain (InfoGain) feature ranking algorithm present in Weka tool. For performing experiments, only the top 100 features from each analysis environment were used to test and train several machine learning algorithms.
3.2 Supervised Machine Learning Models
For the purpose of carrying out supervised learning implementation, the following machine learning models were implemented:
• Support Vector Machine --- In this discriminative algorithm the classification is computed using a separator between two classes and then maximizing the width of the margin from a hyperplane. It calculates the maximization by splitting the problem into smaller parts. Each problem consists of optimizing two multipliers in order to maximize or minimize the solution. The algorithm solves the smallest first and adds these to the overall optimization.
• Naïve Bayes --- A classifier where the assumption is made that features are independent of each other. The classification is based on the calculating the maximum probability of the attributes which belong to a particular class. Let
𝑟= ( 𝑟1,𝑟2,. . . ,𝑟𝑛) belong to class𝐶, 𝑃(𝐶) be the probability of the class and
𝑃(𝐶|𝑟) be the probability of feature for a given class, then an application is considered as a benign if,
• Simple Logistic --- An ensemble learning algorithm created to evaluate the base learners by applying logistic regression using simple regression functions. Similar to linear regression, it tries to find a function that will fit the training data well by computing the weights that maximizes the log-likelihood of the logistic regression function. In this algorithm, the training phase is relatively longer than the testing phase.
• Multilayer Perceptron (MLP) --- A feed forward artificial neural network imple-mentation that consists of 3 layers --- input, hidden and output layer. All layers use a non-linear activation function except the input layer. For training the MLP as it is a supervised learning algorithm, a process called backpropagation is used.
• Partial Decision Trees (PART) --- A partial decision tree is a simple decision tree that contains branches to undefined sub-trees. In order to develop a partial decision tree, construction and pruning operations of decision trees are used and the target is to find a sub-tree which cannot be any more simplified.
• J48 Decision Tree --- An implementation of the C4.5 decision tree algorithm, it splits the dataset by creating a node for the tree. The data with highest information gain is chosen in such a manner that it effectively is able to split the data into class variable. After the data is chosen, it is followed by creation of a decision to split based on the data chosen. The data obtained by splitting is the recursed and then added as children of the decision node.
• IBk --- An implementation of K- Nearest neighbors in Weka. It is a lazy algorithm instance based learner. All training samples are saved and tested against test samples until the closed match is found. In Weka, euclidean distance is used to find the nearest neighbors.
is a part of boosting ensemble classifiers that combine new machine learning models to subsequent models for fixing the prediction errors made by previously implemented models.
3.2.1 Metrics to evaluate effectiveness of emulator vs instrumentation
based malware detection
Recall or sensitivity which is also known as True Positive Rate measures the proportion of true positives (TP) correctly identified (number of malware samples correctly classified). In other words, the calculation of recall gives us a fair idea about the percentage of relevant items that are correctly classified by the machine learning model being implemented. Precision is the percentage of true positives out of all the actual results (true positives + false positives). Thus precision gives us a sense of how many selected items are relevant.
There is a trade-off between precision and recall -- when one will increase, the other decreases. Thus using a metric which will take both precision and recall into account would be helpful as then our focus would be to maximize this metric to get a better model (without considering any trade-off related issues). This metric is called F-measure. F-measure is the accuracy measure obtained from both precision and recall
F-measure = 2*precision*recall recall + precision
Apart from these metrics we can calculate the following metrics as well: True Negative Rate (TNR) which is also known as specificity --- it measures the proportion of true negatives (TN) correctly identified (number of benign samples correctly classified). Relationship between TNR and False Positive Rate (FPR)
TNR = 1−FPR
False Negative Rate (FNR) measures the proportion of false negatives (FN) correctly identified (number of malware samples incorrectly classified). Relationship between
TPR and FNR
FNR = 1−TPR
False Positive Rate (FPR) measures the proportion of false positives (FP) correctly identified (number of benign samples incorrectly classified).
These metrics are able to give us a fair judgment if any feature set collected respectively from the phone and emulator environment actually gives better results over the other. For each of the machine learning models implemented, we shall calculate the above given metrics. The Weka tool allows the us to choose the output parameters we want to calculate and thus for all implemented models we can efficiently calculate these metrics. Chapter 4 provides the results with the values of these metrics which will help us determine if phone based feature collection can give better results than emulator based features.
CHAPTER 4 Experiments
This chapter presents the results of the evaluation from 2 broad experiments of detection and classification of malware samples. The first category of experiments deals with evaluating the effectiveness of emulator vs phone based android malware detection [22]. The next step of experiments shows classification of samples into malware families based on emulator and phone based features.
4.1 Evaluating effectiveness of emulator vs instrumentation based
analy-sis
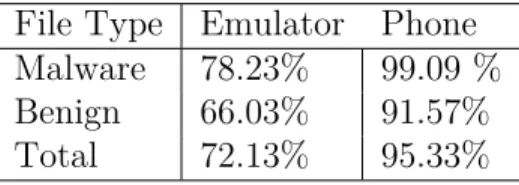
The first aspect that we evaluate is the outcome of the data collection phase--how many apps we were able to execute on the phone vs. on the emulator. Table 2 gives the percentage of apps from dataset 1 analyzed on both environments. Table 3 presents the results of how many malware apps considered from dataset 2 were actually executed successfully on both phone and emulator.
Table 2: Effectiveness of feature extraction from both environments for Dataset 1
File Type Emulator Phone
Malware 78.23% 99.09 %
Benign 66.03% 91.57%
Total 72.13% 95.33%
Table 3: Effectiveness of feature extraction from both environments for Dataset 2
File Type Emulator Phone
Number of files executed 2598 3201
It can be seen that as a feature extraction platform, more apps in both the datasets ran on the phone compared to emulator. While extracting data from dataset 1, we found that from the 1222 malware samples used, 1211 were successfully able to run on a real phone compared to only 956 successfully running on an emulator. From the benign samples, 1119 out of 1222 were successfully examined using a real phone vs. 807 from the emulator for the same dataset as illustrated in Table 2. For the Drebin dataset (dataset 2) the extraction efficiency results from both platforms are shown in table 3. In both datasets more number of apps are executed on the phone compared to the emulator.
As mentioned in [22], for the phone based experiments it was necessary to use USB 2.0 or 3.0 along with the Linux VM. The reason stated for this was that files greater than 1MB size would experience timeout if connection was made using USB 1.0. Apps which had no activities failed to run on emulator and phone, explaining why few number of apps did not execute on any platform.
A probable reason why more apps are executed by using phone as an extraction platform is because more number of APIs can be executed on a phone environment. Especially for apps that have API calls for performing network or reading incoming and outgoing call activities, whether it is a benign or malware code, the phone is able to provide capabilities to perform and log those API calls. These API calls can not be emulated on a virtual device.
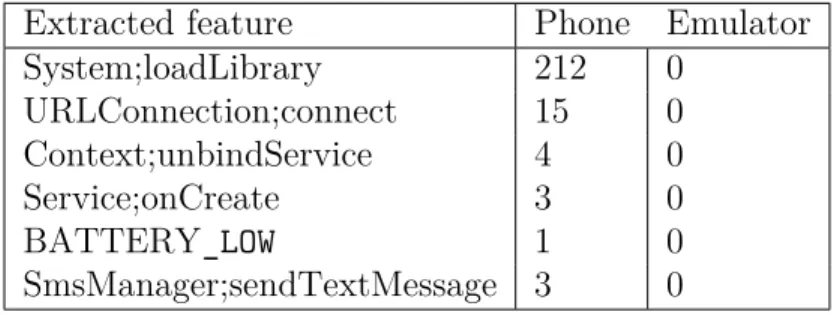
Another interesting observation is related to the extraction of API calls associated with native code in android over both the extraction environments [22]. Table 4 shows these features that were extracted exclusively from the phone but not with the
emulator. The System.loadLibrary feature is the API call associated with native
shows a much higher efficiency of detecting and extracting features for analysis of the apps or training machine learning classifiers.
Table 4: Features exclusively extracted from the phone environment using Dataset 1
Extracted feature Phone Emulator
System;loadLibrary 212 0 URLConnection;connect 15 0 Context;unbindService 4 0 Service;onCreate 3 0 BATTERY_LOW 1 0 SmsManager;sendTextMessage 3 0
4.1.1 Machine learning classifiers results
In this section we will look at the accuracy results of the different implemented models for data collected from both extraction platforms. For the experiments, 33% of the samples were used for testing while 66% were used for training the model using dataset 1. These splits can be defined in the test options in Weka settings. The models were fine tuned using input parameters and the settings for the same are explained below:
• Simple Logistic--- Classifier to implement logistic regression. Settings-- ridge estimator for regularization defines reducing the size of coefficients. Also the setting of number of iterations (specified as the maxIts field in Weka) was given as -1 which will run till the model converges.
• Naive Bayes---The kernel estimator field and supervisedDiscretization field were kept as False.
• Suppport Vector Machine---2 important settings : complexity parameter, c set to 1.0 and a polynomial kernel setting while choosing kernel.
the trees (maxDepth field) and the accuracy was returned for depth of 50. The noPruning parameter was set to False.
• Random Forest---The model was implemented by running the RF with 100 trees • Multi Layer Perceptron---The number of hidden layers was kept as 3.
• IBk---distance being calculate is euclidean distance and number of neighbors was given as 10.
• AdaBoost--- implement AdaBoostM1 method and the classifier (weak learner) is set to Decision Stump algorithm.
It is essential to note that the model should not be overfitted on the training data. Also another Weka setting that was used in all the models was to implement 10 folds cross validation in the test options.
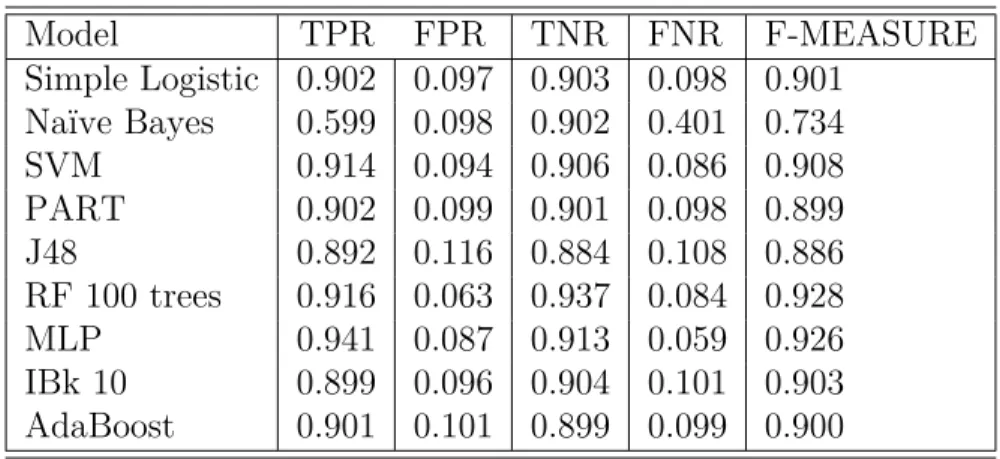
In the first step of the experiment we test and train the machine learning models solely on features collected out of the emulator. The results for this are shown in Table 5. The best accuracy was returned by the random forest model which was implemented with 100 trees.
Table 5: Calculation of evaluation metrics for emulator based features
Model TPR FPR TNR FNR F-MEASURE Simple Logistic 0.902 0.097 0.903 0.098 0.901 Naïve Bayes 0.599 0.098 0.902 0.401 0.734 SVM 0.914 0.094 0.906 0.086 0.908 PART 0.902 0.099 0.901 0.098 0.899 J48 0.892 0.116 0.884 0.108 0.886 RF 100 trees 0.916 0.063 0.937 0.084 0.928 MLP 0.941 0.087 0.913 0.059 0.926 IBk 10 0.899 0.096 0.904 0.101 0.903 AdaBoost 0.901 0.101 0.899 0.099 0.900
the features collected from running the apps on the phone. The same model settings and data split was kept to perform the models. The results are shown in Table 6. Again random forest returns the best F - measure of 0.934.
Table 6: Calculation of evaluation metrics for phone based features
Model TPR FPR TNR FNR F-MEASURE Simple Logistic 0.923 0.081 0.919 0.077 0.921 Naïve Bayes 0.634 0.119 0.881 0.366 0.748 SVM 0.918 0.090 0.910 0.082 0.914 PART 0.907 0.098 0.902 0.093 0.905 J48 0.929 0.101 0.899 0.071 0.916 RF 100 trees 0.942 0.074 0.926 0.058 0.934 MLP 0.924 0.082 0.918 0.076 0.925 IBk 10 0.906 0.086 0.914 0.094 0.910 AdaBoost 0.908 0.087 0.913 0.092 0.906
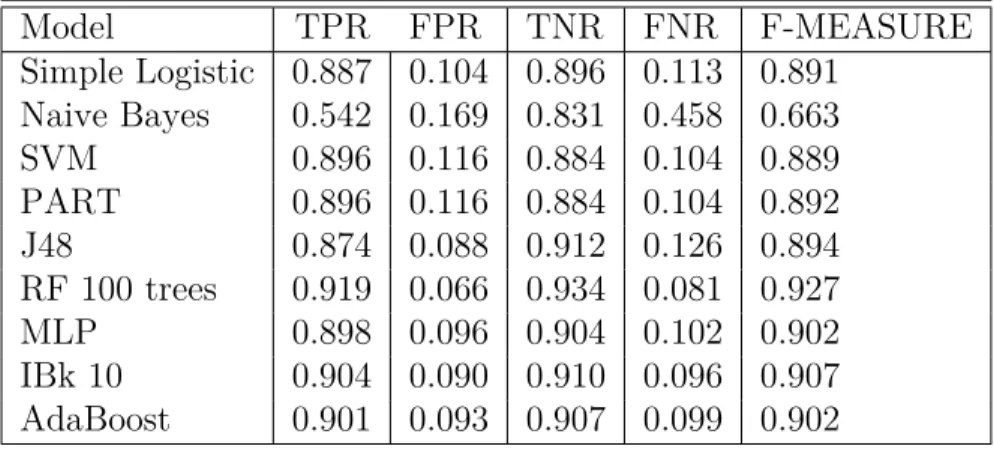
Another set of experiments were performed with only the apps that executed in both the emulator and phone successfully. The results of testing and training the ML models using 66% training and 33% testing split are shown in Tables 7
Table 7: Calculation of evaluation metrics for emulator-based features extracted from apps executed on both environments
Model TPR FPR TNR FNR F-MEASURE Simple Logistic 0.887 0.104 0.896 0.113 0.891 Naive Bayes 0.542 0.169 0.831 0.458 0.663 SVM 0.896 0.116 0.884 0.104 0.889 PART 0.896 0.116 0.884 0.104 0.892 J48 0.874 0.088 0.912 0.126 0.894 RF 100 trees 0.919 0.066 0.934 0.081 0.927 MLP 0.898 0.096 0.904 0.102 0.902 IBk 10 0.904 0.090 0.910 0.096 0.907 AdaBoost 0.901 0.093 0.907 0.099 0.902
seen that training and testing the RF model on phone based features returns the best accuracy of 93.4 %. The phone based features give a slight accuracy increase over the emulated features. While judging recall calculations, all models except Naive Bayes trained and tested on phone features gave TPR greater than 0.9.
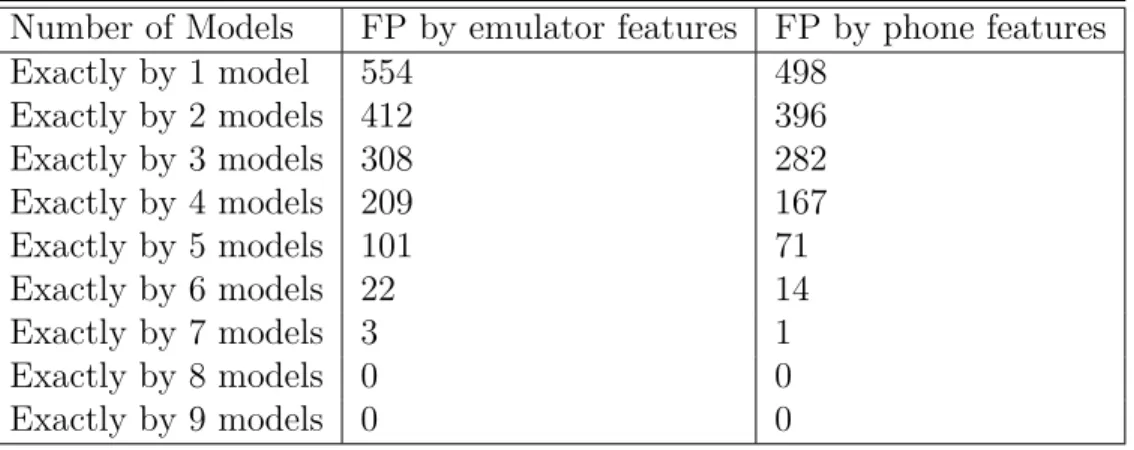
Another interesting experiment would be to see exactly how many models classify samples as false negatives. As the number of models used increases, the number of false negatives should decrease. So FN given by exactly 1 model would be the sum of FN coming out of each model -- 92 from SL + 80 from RF + 88 from SVM + 92 from PART and so on (thus we are just adding the total number of FN given by each model). For exactly 2 models, we will see how many samples were classified incorrectly as malware by 2 models (Now, we are seeing the common samples labeled incorrectly by multiple models). So if sample A was marked as a FN by 2 models, only then will we count it. For the 3 models experiment, count all samples marked as FN by 3 models. This experiment would be done till finding samples classified as FN by all 9 models. The results can be seen in Table 8. There is a decline in the numbers of FN as more models are used. For phone, both 8 and 9 models give no commonly misclassified sample. Thus, using more number of models can ensure that no app might be able to fool multiple number of classifiers. Similarly, table 9 shows the experiments repeated with FP. Again more models used shows lesser common misclassified samples, eventually becoming 0 after using 8 and 9 models.
4.1.2 Classification of samples into malware families based on phone vs
emulator features
In this experiment we determine by using a multi class SVM using a 60:40 split to train and test the model. The goal was to judge the effectiveness of classifying malware samples based on phone and emulator features into their respective malware
Table 8: Number of FN classified by ML models
Number of Models FN by emulator features FN by phone features
Exactly by 1 model 728 694 Exactly by 2 models 605 586 Exactly by 3 models 456 407 Exactly by 4 models 209 201 Exactly by 5 models 139 113 Exactly by 6 models 36 19 Exactly by 7 models 8 3 Exactly by 8 models 2 0 Exactly by 9 models 0 0
Table 9: Number of FP classified by ML models
Number of Models FP by emulator features FP by phone features
Exactly by 1 model 554 498 Exactly by 2 models 412 396 Exactly by 3 models 308 282 Exactly by 4 models 209 167 Exactly by 5 models 101 71 Exactly by 6 models 22 14 Exactly by 7 models 3 1 Exactly by 8 models 0 0 Exactly by 9 models 0 0 4.1.2.1 Results of classification
Table 10 shows the results of the classification in both environments which clearly shows that phone based features give better results in classifying malware samples in families. The metric used in this experiment is the accuracy of the classification. As we are doing classification within multiple classes, each iteration has multiple combinations of results. For example, to classify 2 families, we will have 𝐶7
2 that is 7
in all combinations.
Table 10: Accuracy of classifying samples into families using phone and emulator features
Number of Families Number of combinations Emulator Phone
2 21 92.78 93.64 3 35 91.82 92.76 4 35 91.13 92.02 5 21 90.79 91.84 6 7 89.82 90.64 7 1 88.90 89.97
The results for these 7 families clearly show that phone based features give better results for classifying malware samples into families. On-phone analysis can be used as a promising feature extraction and evaluation method which can be further tested with recent advanced malware as well as testing more malware families data for classification.
CHAPTER 5
Conclusion and Future Work
This project was an attempt to understand and implement feature extraction from dynamic environments outside of the normal used industry and research practices. We judged the effectiveness of instrumentation based analysis which gave us better results than the emulation based features in Android malware detection and classification. The use of Dynalog tool to make the feature extraction possible from both phone and emulator makes it a powerful tool in data collection when it comes to feature extraction in Android apps. Comparative analysis using various machine learning classifiers like Random Forest, Naive Bayes, Multilayer Perceptron, Simple Logistics, J48 decision tree, PART, IBK,Adaboost and SVM algorithms gave us solid results to judge the platforms used for app extraction (emulator vs. phone). The experiments show that multiple apps executed features that were efficiently extracted on the phone rather than on the emulator from both the datasets used for the experiments.That implies that more data from more apps can be collected by running apps on the phone. The results of the on-phone analysis where ML models were trained and tested on just phone based features, we obtained up to 0.934 F - measure with the Random Forest classifier and even for the rest, the phone analysis did better than the emulator. The recall calculations for all models except Naive Bayes while experimenting with phone based features was above 0.9. For the classification problem (classify malware into families), the accuracy after training and testing the SVM model on phone based features returned better results than the emulator based features.
As phone based analysis is a promising aspect for enhanced data collection and dealing with anti-emulation techniques, it is an interesting domain to explore . Malware apps are becoming more advanced and harder to detect. Most publicly available datasets contain samples from 2010 - 2014 period. For possible future work,
using larger datasets with more recent malware apps to extract data from will be a promising start to further test instrumentation vs emulation experiments with advanced malware. Using more ML models, metrics, techniques or even exploring different feature sets could also be an experiment to implement.
LIST OF REFERENCES
[1] Smartphone OS market share worldwide 2009-2017 [online]. Available:-
https://www.statista.com/statistics/263453/global-market-share-held-by-smartphone-operating- systems
[2] Global smartphone shipments by OS [online].
Available:- https://www.statista.com/statistics/263437/global-smartphone-sales-to-end-users-since-2007/
[3] 2017 McAfee Threats Report, December 2017 [online]. Available:- https: //https://www.mcafee.com/us/resources/reports/rp-quarterly-threats-dec-2017.pdf
[4] M. Martinelli, T. Fabio, M. Francesco, A. Saracino, and C. Visaggio, "I find your behavior disturbing: Static and dynamic app behavioral analysis for detection of Android malware," In Privacy, Security and Trust (PST), 2016 14th Annual Conference, pp. 129-136, IEEE, 2016.
[5] A.Karpatwar,F. Troia, M.Stamp, "Static and Dynamic Analysis of Android Mal-ware",InIn Proceedings of the 3rd International Conference on Information Systems Security and Privacy, 653-662, 2017, Porto, Portugal.
[6] Kang, Hyunjae, Jae-wook Jang, Aziz Mohaisen, and Huy Kang Kim, "Detecting and classifying android malware using static analysis along with creator information,"
International Journal of Distributed Sensor Networks, vol. 6, pp.479174, 2015. [7] Varsha, M. V., P. Vinod, and K. A. Dhanya, "Identification of malicious android
app using manifest and opcode features,"Journal of Computer Virology and Hacking Techniques 13, vol. 2, pp: 125-138, 2017.
[8] M.Stamp,"Information security: principles and practice", John Wiley & Sons, 2011.
[9] IBM Proguard. Available: https://mobilefirstplatform.ibmcloud.com/blog/2016/09/19/mfp-80-obfuscating-android-code-with-proguard/
[10] M. Lindorfer and M. Neugschwandtner. "Marvin: Efficient and comprehensive mobile app classification through static and dynamic analysis",In Computer Software and Applications Conference (COMPSAC), 2015 IEEE 39th Annual, pp:422-433, 2015.
[11] B. Amos, H. Turner, and J. White, "Applying machine learning classifiers to dynamic android malware detection at scale", In9th International Wireless Com-munications and Mobile Computing Conference, IWCMC 2013, pages 1666-1671, 2013.
[12] Van Der Veen, Victor, Herbert Bos, and Christian Rossow, "Dynamic analysis of android malware.",Internet & Web Technology Master thesis, VU University Amsterdam, 2013.
[13] T. Vidas and N. Christin, "Evading android runtime analysis via sandbox
de-tection", In ASIA CCS ’14 (9th ACM symposium on Information, computer and
communications security), pp: 447-458, 2014.
[14] Pincer android attacks. Available:- https://www.fsecure.
com/we-blog/archives/00002538.html
[15] K. Tam, S. J. Khan, A. Fattori, and L. Cavallaro,"CopperDroid: Automatic Reconstruction of Android Malware Behaviors" InNdss, February PP: 8-11, 2015. [16] Y. Jing, Z. Zhao, G.-J. Ahn, and H. Hu, "Morpheus: Automatically Generating
Heuristics to Detect Android Emulators", In Proceedings of the 30th Annual Computer Security Applications Conference on - ACSAC ’14, pp: 216-225, 2014. [17] TaintDroid. Available: http://www.appanalysis.org/
[18] DroidBox, Google Archive. Available:- https://code.google.com/archive/p/droidbox/ [19] Sandroid , Hu.Wenjun. Available:- http://sanddroid.xjtu.edu.cn/
[20] TraceDroid. Available:- https://github.com/ligi/tracedroid [21] NVISO Apkscan. Available :-https://apkscan.nviso.be/
[22] M. Alzaylaee, Y. Suleiman, and Sakir Sezer, "Emulator vs real phone: Android malware detection using machine learning." In Proceedings of the 3rd ACM on International Workshop on Security And Privacy Analytics, pp. 65-72. ACM, 2017. DOI: 10.1145/3041008.3041010
[23] M. K. Alzaylaee, S. Y. Yerima, and S. Sezer, "DynaLog: An automated dynamic analysis framework for characterizing android applications", In 2016 International Conference on Cyber Security and Protection of Digital Services, Cyber Security 2016, 2016.
APPENDIX Appendix A
A.1 Graphs for evaluating effectiveness between emulator vs.
instrumen-tation
Figure A.5: SVM performance for phone vs emulator based features.
Figure A.7: Random Forest performance for phone vs emulator based features.
Figure A.8: J48 performance for phone vs emulator based features.
Figure A.10: PART performance for phone vs emulator based features.
![Figure 4: Dynalog tool working [22].](https://thumb-us.123doks.com/thumbv2/123dok_us/1077377.2643372/21.918.162.812.504.796/figure-dynalog-tool-working.webp)