Developing social media usage and content production at
a professional services firm
Polina Vasilyeva
Bachelor’s Thesis Degree Programme in Modern Languages and
Business Studies for Management Assistants 2020
Author(s)
Polina Vasilyeva
Degree programme
Degree Programme in Modern Languages and Business Studies for Management Assistants
Report/thesis title
Developing social media usage and content production at a pro-fessional services firm
Number of pages and appendix pages
44 + 0
Social media is a key tool for companies to interact with buyers, customers and media. Started as a good-to-have addition some years ago, usage and consumption of social me-dia by businesses has grown substantially. Currently social meme-dia channels develop into full customer service platforms where buyers may not only get updates from businesses, but also purchase or subscribe to company services straight from the channel.
The aim of the thesis was to analyse social media content of a Finnish professional ser-vices firm, Dittmar & Indrenius, and to provide suggestions if any on how to improve social media usage and content production by the organisation. The theoretical framework of this thesis was developed based on social media state-of-art in B2B and B2C contexts as found in research articles and on the internet. Empirical data was collected from four social media channels of the professional service firm, Facebook, Twitter, Instagram and
LinkedIn. The data was collected over a period of three months, September, October and November, in 2019 and it was based on postings on the channels. Overall, 68 postings were found and analysed, out of which 11 were on Facebook, 33 on Twitter, 12 on LinkedIn and 12 on Instagram.
It was found out that Dittmar & Indrenius relied on Twitter as the main distributing social media channel for publishing unique content and that the organisation used the remaining three channels mostly for sharing links from its website. In general, reader’s engagement to the postings was fairly low for all channels. Instagram had the highest engagement and Twitter had the lowest engagement. There was no effect of content format and type of messaging on reader’s engagement on different channels. Postings about people received more likes and had higher readers’ engagement, but it requires further investigation. Based on the results, few improvements were suggested to the organisation, mainly re-lated to publishing unique content and experimenting with different content formats and messaging.
Keywords
Table of contents
1 Introduction ... 1
1.1 Thesis scope and limitations ... 2
1.2 Methods and structure ... 3
2 Dittmar & Indrenius ... 4
2.1 Firm presentation ... 4
2.2 Dittmar & Indrenius social media channels ... 5
3 Social media in business ... 6
3.1 Social media and current trends ... 6
3.2 Different social media channels in business ... 7
3.2.1 Facebook ... 8
3.2.2 Twitter ... 8
3.2.3 Instagram ... 9
3.2.4 LinkedIn ... 9
3.3 Professional service companies and social media ... 10
3.4 Law and legal services organisations and social media ... 10
4 The Importance of content in social media ... 12
4.1 B2B and B2C in marketing – similarities and differences ... 12
4.2 Inbound marketing ... 13
4.2.1 Attracting target audience. ... 14
4.2.2 Engaging with target audience ... 14
4.2.3 Delighting customers ... 15
4.3 Content marketing ... 15
4.4 Different content formats ... 17
4.4.1 Text ... 17 4.4.2 Image ... 17 4.4.3 Gifs ... 18 4.4.4 Memes ... 18 4.4.5 Video ... 19 4.4.6 Infographic ... 20 4.4.7 Case studies ... 21 5 Research methods ... 22 6 Results ... 24
6.1 Overall activity on social media channels ... 24
6.2 Content language ... 25
6.3 Content format ... 25
7 Discussion ... 29
7.1 Social media channels usage ... 29
7.2 Language ... 29
7.3 Content publishing calendar ... 29
7.4 Content format and social media channels ... 30
7.5 Readers engagement ... 30 7.6 Recommendations ... 31 7.6.1 Facebook ... 32 7.6.2 Instagram ... 32 7.6.3 LinkedIn ... 32 8 Evaluation ... 33 References ... 34
1 Introduction
Social media undoubtedly plays an important role in our lives today. It allows us to con-nect with friends, family, colleagues, buyers, customers, companies, government, policy makers, and resources all over the world across geographical and political borders. Social media has penetrated nearly all countries with as much as 45% of total population in-volved as of January 2019 (Dollarhide
2019
). This number will grow as developing mar-kets are catching up with infrastructure and devices’ ability to provide and maintain fast and reliable connection. In addition to network quality and coverage, spreading of mobile devices globally is the main driver of social media growth as over 90% of social media us-age comes from mobile (Lyfemarketing 2018). Social media usus-age distribution is not uni-form with developed countries having the highest percentage of population covered, while countries in Eastern Asia are leading in the number of new user registrations (Clement 2020a).On average people spend around three hours per day on messaging and browsing (Glob-alwebindex 2019) which makes social media penetrate people’s lives more and more as well gives businesses a great gateway to acquiring new customers. Indeed, over 54% of potential buyers use social media to look for services and ask for recommendations (Glob-alwebindex 2019). Moreover, over 71% of people who have had a positive experience with a brand in social media will recommend the brand to their friends and family (Lyfe-marketing 2018). As a result, businesses are looking for ways to engage with potential customers and use social media for advertising their products and building brand aware-ness. For example, 75% of marketers believe that social media marketing is effective for their business (Buffer 2019).
Out of all social media channels, there are four most important for business (Lyfemarket-ing 2018). These include Facebook, Twitter, Instagram and LinkedIn. Facebook is the 5th most visited website worldwide and is used by over 2B people across the globe (Clement 2020b). Twitter is 12th most visited website and it has over 300M users (Clement 2020c). Instagram is the 17th most popular online source with ca 1B active users, who have up-loaded over 16B photos and videos (Clement 2020c). LinkedIn has over 670M users worldwide and ca 50% of them are active monthly (Aslam 2020).
LinkedIn is the leading social media channel when it comes to B2B marketing. Usage of LinkedIn is not even, with the USA, India, China, Brazil and the UK taking up over half of all users. In addition to marketing, LinkedIn is an important recruitment channel and it is used by over 95% recruiters to find the right talent (Fertig 2017).
Usage of social media for many businesses started from static pages describing services provided. Today it has developed into communities of customers, buyers, and partners, which are maintained and run by businesses. Moreover, such communities often serve as full customer service platforms where buyers may not only get updates from a business in question, but also purchase or subscribe to company services straight from the page. For example, on Instagram over 50% of business profiles do not lead to an outside page, meaning that Instagram profile is the only business profile of that business or so call “na-tively born” (Ha 2017). This is mostly done with “business accounts”, developed specifi-cally to serve businesses. These accounts often give more freedom in sharing and creat-ing content as well as provide business analytics. For example, number of business ac-counts in Instagram was 25M as of November 2017 (Clement, 2019). There is not recent information about such number at the time of writing this thesis (April 2020), but most likely it has grown substantially.
Given the importance of social media today, efficient usage of different social media chan-nels is crucial for every modern business. The reason why I selected this topic together with a professional services firm I worked at, Dittmar & Indrenius, is toprovide suggestions for the firm's social media content publishing and overall, to share the results of this thesis with the firm's marketing department responsible for deepening customer engagement through branding activities in various marketing channels. Further, I chose this topic out of personal interest to gain better understanding of social media readers and their prefer-ences in B2B content marketing.
1.1 Thesis scope and limitations
The aim of the thesis was to analyse social media content of the professional service firm and use the results to suggest how to improve social media usage and content production by the organisation.
In this thesis, I analysed Dittmar & Indrenius social media channels content over the pe-riod three months (September – November 2019). I look at the following corporate social channels: Facebook, Instagram, LinkedIn, and Twitter. The questions that guide the work were:
● What was the publishing frequency for different channels? Was it consistent across the channels?
● Were social media channels different in respect to messaging, content types and content performance?
● Dittmar & Indrenius is a Finnish law company, but it has international customers too. What language does the firm use for social media communications?
1.2 Methods and structure
The method used for content analysis is an analysis of content postings on four social me-dia channels. Such documents and content analysis is a common method when it is not possible to find information otherwise (Drake & Salmi 2018). The four social media chan-nels, Facebook, Instagram, Twitter and LinkedIn, were selected as the most common channels for business. Before checking the channels, an analysis framework based on re-search questions was formulated and outlined as a plan.
The research was conducted in four parts. Firstly, the topic was brainstormed together with the commissioning organisation (November 2019). Secondly, relevant theory about social media usage in B2B and B2C context was gathered (January 2020). Third part in-cluded the analysis of the organisation’s social media channels (February 2020). The final fourth part included comparing the theory and the results aiming at providing an overview of the organisation social media strategy and recommendations for improvement (March – April 2020).
The thesis is structured in eight chapters. The first chapter is aiming at providing back-ground information about the topic and outlines thesis methods and structure. The second chapter represents the professional services firm, Dittmar & Indrenius, and gives a short description of its social media channels and some company history. The third chapter pro-vides an overview of different social media channels, Facebook, Twitter, Instagram and LinkedIn, in business with a focus on law and legal services industry. The fourth chapter outlines the importance of content in social media with sections on inbound strategies, content marketing, and different content formats. The fifth chapter represents research methods, whereas the sixth chapter outlines the results. The seventh chapter discusses the main results, and the thesis is evaluated in the last eighth chapter.
2 Dittmar & Indrenius
This chapter introduces the commissioner of the thesis, the professional services firm, Dittmar & Indrenius, and the social media channels used by the firm.
2.1 Firm presentation
Dittmar & Indrenius is a law firm founded in 1899. Being one of the oldest and most re-spected law firms in Finland, Dittmar & Indrenius operates in Helsinki and currently em-ploys 92 people, of whom the majority are lawyers.
Dittmar & Indrenius is famous for its Powerhouse operating model for seamless multi-practice legal services covering all legal areas relevant to its long-lasting clients including half of the 50 largest publicly listed Finnish companies, more than every third Dow Jones Industrial Average company in their operations in Finland as well as for leading global and European PE houses.
The firm has leading experience from cross-border M&A transactions, complex disputes and new innovative business models with especially strong business understanding of ICT, technology and manufacturing, aviation, banking and finance, pharmaceuticals, healthcare, media, energy and infrastructure (Dittmar & Indrenius 2020a).
The firm has been awarded several awards and recognitions by Chambers Global and Europe, Legal 500, IFLR, PLC Which Lawyer, Global Competition Review’s GCR 100 20th edition and Best Lawyers. The firm has been chosen Finland’s M&A Legal Adviser of the Year at the Mergermarket’s European M&A Awards in 2018 and in the latest KANTAR SIFO Prospera Tier 1 Law Firm Review in Finland, the firm ranked TOP3 in several key customer experience categories and base on the clients' reviews, the firm ranked #1 in "Client Understanding" and in "Forefront of Digitalisation". The firm is also famous for its collaborative culture and it was ranked #4 in Great Place to Work® (Dittmar & Indrenius 2020b).
In 2018, the company turnover was 17.5M EUR with operating profit of 5.7M EUR and net profit margin of 26.03%. The data for 2019 is not publicly available at the time of writing this thesis, but annual growth is estimated to be 9.19%. The company headcount is grow-ing annually at the rate of 10% (Kauppalehti 2020).
2.2 Dittmar & Indrenius social media channels
Dittmar & Indrenius is active in social media and it has accounts on all major channels. Despite the company long history (over 120 years), it has started using social media quite recently. The firm registered on Facebook, Twitter and Instagram in 2014. LinkedIn ac-count was registered in 2012. LinkedIn is by far the firm's most popular social media chan-nel as it has three times more followers compared to other chanchan-nels (Table 1).
Table 1. Dittmar & Indrenius activity on LinkedIn, Facebook, Instagram and Twitter as of February 2020
Link Registered Followers Posts in total LinkedIn https://www.linkedin.com/com-pany/dittmar-&-indrenius/ 2012 3315 NA Facebook https://www.facebook.com/dittma-rindrenius April 2014 1153 NA Instagram https://www.insta-gram.com/dittmarindrenius/ December 2014 910 263
3 Social media in business
Even though the first social media appeared not so long time ago (some 20 years ago), it has already penetrated our lives deeply. This chapter provides an outline of social media channels usage in business, with some historical remarks. Here four main channels, Fa-cebook, Twitter, Instagram and LinkedIn, used by Dittmar & Indrenius and studied in this thesis, are also introduced.
3.1 Social media and current trends
The term “social network” was introduced in 1954 by sociologist James Barnes (Barnes 1954). Social network by Barnes is “a social structure made of nodes which are generally individuals or organizations. A social network indicates the ways in which they are con-nected through various social familiarities ranging from casual acquaintance to close fa-milial bonds“.
Many popular social media channels are associated with the USA. However, it would be wrong to conclude that all social media originated in the North America. For example, orig-inally Russian network vk.com currently has over 400M registered users, together with Chinese Qzone and Renren networks which are also used by millions of people (Clement 2020c).
There are two main types of social media, though the distinction is blurry and intermixed even within the same platform. One type is focused on interaction between friends and family using photo and status sharing, for example Facebook, Google+ (Google+ was shut down in 2019) and Instagram. Another type is known as microblogs and aimed at quick communication and news sharing, for example Tumblr, Twitter, Telegram. Now, with Facebook, YouTube and Instagram “stories”, these two types are merging, and busi-nesses make use of the two in different contexts.
There are few trends to observe in upcoming years in social media consumption by busi-nesses. Overall, social media usage will grow, but it is predicted to be a conscious growth. In the past companies were mostly interested in a number of reactions for ads and con-tent, such as likes, shares and views by any kind of public (Barnhart 2020). However, smaller focus groups and careful analysis of user sentiments yields better business re-sults. It is now generally accepted that it is more valuable to have a smaller group of loyal supporters as opposed to a large group of audiences which is not particularly loyal to any brand. In addition, the role of social media influencers’, which are defined as a group of
media channels (Freberg, Graham, Mcgaughey, & Freberg 2011), ought to be re-evalu-ated, as there are known cases of lack of focus and moderate business performance (Ta-ble 2).
Table 2. Key trends to observe in social media in 2020 per Barnhart (2020a)
Trend Key facts
Re-evaluating user engagement Analysis of user sentiments rather than number of likes and shares gives more information on what users think about a product/service Focusing on smaller segment groups
and private groups for marketing
Mass marketing is dying out, users want to keep their privacy and have more power on who they want to interact with. Marketers prefer quality over quantity
Intense and personalized social me-dia shopping
Users are becoming more comfortable with so-cial media shopping within the channels as op-posed to clicking external links
Usage of social influencers will grow, but with more caution
“Social influencers” has become a buzzword not backup by strong data. Marketers need to un-derstand social media influencers more and must confirm their findings with data
Usage of stories will grow Stories is a type of easy-to-interact-with content. More interactive stories bring more attention Usage of video will grow Video is one of the most popular formats in
so-cial media and its consumption is growing, in-cluding live video
More user generated content Engaging user to publish on behalf of a brand creates more trust and brand loyalty
Choice of most effective social me-dia channels
Different social media have their strength and weaknesses and are targeted to different de-mographics. Marketers need to make a choice wisely and back it up with data
3.2 Different social media channels in business
It is known that each social media channel is targeted to different demographic groups (Walton 2019). As a result, usage of social media channels is largely different by different
industries. Some industries rely heavily on certain channels and skip others altogether. TrackMaven conducted a major comparison study on different social media channels and main industries worldwide in 2016 (TrackMaven 2016). Up to date, it is still one of the main sources of information and I am not aware of any other extensive reports after 2016. Similarly, I am not aware of any similar research specifically for Finland. TrackMaven re-ported that Instagram has by far the highest user engagement (which is measured as av-erage interaction per post per 1000 followers): it is 10 times higher than that of Facebook (2016). Twitter has the lowest user engagement of all. The review of the main social me-dia channels below is largely based on that report.
3.2.1 Facebook
Being one of the largest and most popular social media channels, Facebook is a general-ised channel, i.e. it is used by all age groups with over 68% of all adults in the USA having an account. There are several minor differences in demographic groups related to gender (it is used more by adult women compared to adult men) and education (it is more used by colleague graduates compared to high school graduates), but overall its usage is rather uniform (Walton 2019). In business Facebook is used by over 7M active advertisers (Fa-cebook 2020).
Several industries benefit from using Facebook for social media communication. For ex-ample, political organisations and businesses related to animation demonstrate high brand affinity due to highest average user interactions per post and average number of followers. Broadcast media demonstrate strong commitment to content publishing, as re-flected in highest average number of followers and highest number of posts per month. In-terestingly, newspapers have the highest posting frequency but low user engagement. Sports and Entertainment industries have the highest number of followers, number of in-teractions and number of posts per month and use Facebook as the main channel for communication (TrackMaven 2016).
3.2.2 Twitter
Twitter is one of the most efficient social media channels for business and it provides a plethora of tools for business accounts. For example, according to Nielsen TAR (2017) Twitter provides accurate demographic targeting 76% of the time, compared to industry standard of 59%. Twitter is not as popular as Facebook, with over 24% of adults in the USA who have an account. Gender demographics is equal, while it is less popular for older age groups. For example, 45% of 18-24 age group have an account, compared 33%
for 25-29 age group and 27% for 30-49 age group. Similarly to Facebook, it is less popular among high school graduates (Walton 2019).
Twitter is the main communication channel for Broadcast media, Online Media, Newspa-pers and Media Production companies. This is reflected in number of followers and num-ber of tweets per month, but not in user engagement. User engagement is highest for Mu-sic companies (three times more compared to the follow-up industry – Entertainment; 1700 average interactions per post and 600 interactions per post respectively, TrackMa-ven 2016).
3.2.3 Instagram
Instagram is highly popular among younger people, with over 71% of people from 18-24 age group who have an account. Popularity of Instagram is falling in the older age groups with only 54% having an account for 25-29-year olds, and 40% and 21% for 30-49- and 50-64-year olds, respectively (Walton 2019). Instagram is highly efficient channel for busi-ness communication as around 90% of Instagram accounts follow a busibusi-ness, some 200M users visit a business account at least once a day, and there are over 150M Instagram stories coming from business accounts daily (Instagram 2020).
Instagram business accounts are heavily celebrities populated. In fact, celebrities domi-nate the list of top 10 companies with the highest number of interactions per post. An in-teresting fact is that Government Relations segment is also present in the top 10 list, largely due to White House account on Instagram (5.9M followers). Defence & Space seg-ment also has the highest number of followers, which is related to NASA account with over 56M followers. Like Facebook, Music companies also have high user engagement on average on Instagram (TrackMaven 2016).
3.2.4 LinkedIn
LinkedIn is very different from other social media channels as it is a professional network which is highly popular for job postings, sharing business updates etc. Importantly, LinkedIn is less dependent on advertisements as most of its revenue comes from Talent Solutions targeted to recruiters (over 95% of recruiters use LinkedIn, Friedman 2014; Aslam 2020). Age and gender demographics for LinkedIn is slightly biased towards men and older people (Kemp 2019). Even though LinkedIn is not as popular as other social media channels due to its nature, it is still very efficient for businesses to generate leads, make connections, build brand awareness, and share content, and a very efficient tool for job and candidate seeking and other professional activities (Zantal-Weiner 2019).
Unlike other social media channels, for which there is a strong connection between num-ber of followers, publishing frequency and user engagement, LinkedIn is missing such connection. Overall, LinkedIn remains the lowest volume social media channel for busi-ness. Out of all industries, pharmaceutical companies have the highest number of follow-ers, most likely due to some massive companies with over 10000 employees which also have a very high number of followers (over 1M). Interestingly, Wine & Spirits companies have the highest number of post interactions out of all industries and those interactions are very lively (TrackMaven 2016).
3.3 Professional service companies and social media
Professional services companies do not have a product as such. Instead they provide pro-fessional services, for example, construction, law, trade etc. Social media usage by such companies seems to be lagging compared to product companies. There are multiple rea-sons for it, including, among others, potential reputation risks, issues with owning social media strategy by different departments, lack of perceived value of social media and over-all little understanding of social media world and experience connected to it (Laing 2019). Nevertheless, Twitter seems to be highly popular for people to seek for recommendations for professional services companies (Legal Futures 2012).
Overall, social media strategy for professional services companies is not any different from product companies. To develop successful strategy, companies should focus on business goals, target audience, right messaging and testing multiple approaches, and then repeating what works (Stewart 2019).
3.4 Law and legal services organisations and social media
Law and legal services organisations represent a high contrast to other professional ser-vices companies as potential client confidentiality breach is prosecuted by law and reputa-tion risks are costly (Law Society 2017). To mitigate the risks, law associareputa-tions develop social media usage guides which outline main risks and few principles to follow, for exam-ple, Law Society guidance in the UK (Law Society 2019).
On average, law and legal services industry is low in number of followers, user engage-ment and publishing frequency compared to other industries. Nevertheless, as for other professional services companies, social media strategy for law and legal services compa-nies is developed with the same principles: setting goals, targeting, and right messaging (Cheung 2020).
Apparently, despite the challenges with social media, some law companies are successful in their social media strategy implementation. Most likely this is because they follow the above-mentioned principles and are not afraid of experimenting (Zuneshine 2020).
Overall for this segment there is no data available at the time of writing apart from
TrackMaven report, which has limited granularity for industries. The report shows that Fa-cebook and Twitter are the most used social media channels, with Instagram being the least popular for the industry. Companies in law and legal services segment are frequently publishing on Twitter and Facebook, but frequency on Instagram and LinkedIn is lower by 3-10 times. Facebook is by far the most engaging channel and Instagram being the least engaging channel as seen from average number of interactions per post (Table 3).
Table 3. Social media channels in Law and Legal services industry worldwide and all in-dustries combined for average number of posts (all inin-dustries are inbold, TrackMaven 2016) FB – Facebook, T – Twitter, IG – Instagram, L – LinkedIn.
FB T IG L
Average number of followers 91152 62288 1080 16567
Average number of posts per month 47/225 112/450 11/130 19/60
4 The Importance of content in social media
This chapter introduces a concept of content in social media. Content plays a major role in building brand awareness, company reputation and growing business. There are different types of content and it is used for different purposes, both in B2B and B2C contexts. Be-low there is an overview of some of the main types.
4.1 B2B and B2C in marketing – similarities and differences
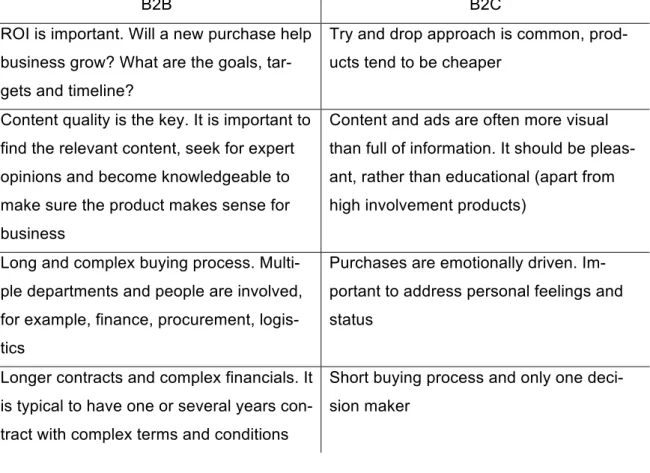
B2B stands for business-to-business, and B2C stands for business-to-customers. Some-times, business may use mixed strategies when they sell both to other business and peo-ple. For example, software companies may sell software products for corporate customers as well as individual buyers. B2B and B2C are often seen as one type, since it is essen-tially people who are behind businesses and people make buying decisions, though they make the decision on behalf of their organisations. As a matter of fact, there are some similarities, but also some drastic differences for marketing for these two segments as they target difference audiences. For B2C buying cycle is often short and emotional. For example, buying a toothbrush should be a short and enjoyable process, and media format (images, video, memes, see 4.4) plays a big role in decision making process. B2B pro-cess is built around business metrics and it tends to be much longer with multiple people on different levels involved from an organisation. Likewise, ROI is very important for B2B, both for buyers and for sellers (Table 4). Interestingly, it is common for B2B companies to have problems with content strategy and implementation, as they may make it unneces-sary complicated or instead use tactics of B2C diectly, making it too informal (Zen 2019).
Table 4. Differences between B2B and B2C (Murphy 2007, Cohn 2015, Lake 2019, Zen 2019).
B2B B2C
ROI is important. Will a new purchase help business grow? What are the goals, tar-gets and timeline?
Try and drop approach is common, prod-ucts tend to be cheaper
Content quality is the key. It is important to find the relevant content, seek for expert opinions and become knowledgeable to make sure the product makes sense for business
Content and ads are often more visual than full of information. It should be pleas-ant, rather than educational (apart from high involvement products)
Long and complex buying process. Multi-ple departments and peoMulti-ple are involved, for example, finance, procurement, logis-tics
Purchases are emotionally driven. Im-portant to address personal feelings and status
Longer contracts and complex financials. It is typical to have one or several years con-tract with complex terms and conditions
Short buying process and only one deci-sion maker
4.2 Inbound marketing
Content is the key for any marketing activity, both in B2B and B2C contexts. Attracting buyers with valuable and tailored content is called inbound marketing. Unlike outbound strategies targeted towards reaching out to potential buyers directly, inbound marketing is not based on direct reaching out to potential identified buyers, but rather a “buying per-sona”. Buying persona is a group of people from the known segment, industry, often with defined job titles (in B2B context) or age demographics (in B2C context). Potential buyers associated with this “buying persona” are attracted to content produced for that group. The core of inbound marketing is that it is not enough to attract visitors to the website. They also need to be provided with meaningful content that helps them solve business problems (in B2B) or helps them as individuals (B2C). Such strategy is called AED by Hubspot (2020) – attract, engage and delight, with it all three business departments (sales, customer support, and marketing) working in sync (Figure 1). Marketing depart-ment works effortlessly to attract visitors using content, drip campaigns, advertisedepart-ments,
events, webinars etc. Sales engage with buyers using chat, emails, phone calls or meet-ings at events. Customer success department helps customers find the best ways of using a product to solve their problems.
Figure 1. AED strategy in inbound marketing (Hubspot 2020)
4.2.1 Attracting target audience.
Attracting target audience or “buying persona” is the first step in acquiring new customers. Content creation and development is the key at this stage. Every piece of content should be optimised according to SEO strategy to bring the best conversion results. SEO is re-ferred to Search Engine Optimisation, which helps readers find information online quicker and easier in the organic search results (Oetting 2019). It is not related to content on the website per se, but it is more a technical term related to using keywords and phrases, and page optimisation to improve website position on Google due to the algorithm Google uses to rank the search results.
4.2.2 Engaging with target audience
Engaging with target audience is the second step in buying decision process, which re-quires special attention to help the audience pass through marketing journey and build long-term relationship with them. This could include inbound sales calls, emails, newslet-ter and other ways of innewslet-teraction (Fontanella 2019). All innewslet-teractions should be problem-specific and not product-problem-specific, i.e. directed towards solving audience business prob-lems or personal probprob-lems (concept of “gap selling” is gaining popularity, Keenan 2018).
Engage
Delight
Attract
4.2.3 Delighting customers
Delighting customers is the last step when buyers have already become customers. Cus-tomer success/experience teams should make sure that cusCus-tomers are satisfied and that they are provided support along the way. For this purpose, companies often use customer surveys, email/phone/chat support to help solve any issues customers might have with the product. Customer support can be passive, e.g. receiving customer tickets and respond-ing to them; or proactive, e.g. reachrespond-ing out to customers and checkrespond-ing that everythrespond-ing is on track. Social media is often used at this stage to collect customer’s feedbacks and ex-periences with products or services. This is known as “social media listening” (Amaresan 2018).
4.3 Content marketing
Content marketing is in fact an integral part of inbound marketing, where content is cre-ated and distributed among people or companies who use it to solve business problems. Content marketing is not around specific products or services an organisation has on of-fer. Instead, such content helps companies establish themselves as thought leaders and experts in their field, thus forming a strong bond between the company brand and poten-tial buyers.
Content marketing is used by leading brands such P&G, Microsoft, Cisco, Hubspot, and many smaller companies in B2B and B2C. It is considered as one of the most efficient selling channels (Sheridan 2017). The logic behind content marketing is that around 70% of the buying decision is made before a buyer talks to the company, i.e. before a sale rep-resentative is making a cold call, the buying decision has already been made (Wizdo 2017).
Marcus Sheridan, a well-known coach in content marketing, suggests that the best way to create content is to brainstorm around every question that was received from a potential buyer, be it a company or a person. Those questions should be written exactly the way potential buyers would ask them, not how sellers might see it. Sheridan points out that such list would make a great digital marketing editorial calendar and that it should be around five subjects: price, problems, comparisons, reviews, and best in class (Sheridan 2017). Such topics are of great importance for potential buyers and they are often consid-ered seriously when making a buying decision. However, it is known that contrary to what buyers might want to find, businesses generally want to ignore those questions and only address them when talk to a buyer one-on-one (Table 5).
Table 5. Topics which are important to cover by content marketing teams (Sheridan 2017)
Pricing and Costs In B2C context consumers want to know about the costs of service or product and feel frustrated if no info is provided. Pricing should be addressed in one way or another. If it is more expensive than a competitor a reason should be given. For a business, it is important to make at least one piece of content and explain the factors that dictate costs, what to expect in the industry and where the company falls as a business. In B2B context pricing is not as important if a product offered can help business grow (and close the “gap”, as per Keenan 2018) but nevertheless should be indi-cated
Problems Both in B2B and B2C potential buyers have concerns when they buy, more often about what can go wrong as opposed to what will go right. It is important to make a list of all things which may go wrong with a product or service and address each one, trying to turn weaknesses into strengths (if possi-ble)
Versus and Comparisons Especially in B2B context buyers’ ignorance is no longer the case and no business should expect potential buyers stop their search once they find a good company to buy from. This step requires collecting all comparison-based ques-tions from potential buyers in the industry and addressing them on the website with honesty and transparency. It is im-portant to give buyers a possibility to educate themselves to make a weighted buying decision
Reviews and Best in Class
In B2B context potential buyers are looking for cons and pros of any product they purchase. A business needs to ad-dress possible competitors and other similar businesses, make unbiased comparison and explain what each one is good for. Such tactics is all about helping potential buyers make the right decision and it also helps in building trust. Articles with “5 best something” drive a lot of traffic and bring many new customers as well as help making buying decisions for business
4.4 Different content formats
There are five main types of content format on the internet: text, gif, meme, image and video. Infographics and case studies are also related to content formats. There could of course be a combination of any of them. Each content format is a powerful tool when planned and implemented wisely, both for B2B and B2C cases.
4.4.1 Text
Text is the most common format and it also independent of browsers on user devices. Moreover, it is not filtered by spam detectors when sent by email (apart from certain phrases which should be avoided, e.g. “for free”, “100%”, “risk” as per Gorbach 2019). This is the most basic content format and on its own it may be dull and not entertaining. Text-only communication is rare both in B2B and B2C contexts, be it marketing emails or ads on social media (Socialbakers 2013). Even in sales emails, a rather conservative part of business in terms of format, text emails are less engaging and open rate for them is lower than emails with video (Hubspot Academy 2020).
4.4.2 Image
Image is an important content type as postings with an image are much more popular and lead to higher user engagement, both in number of shares (with at least x3 more shares) and an ability to go viral (Cohen 2013). Images and visuals are not only used in B2C con-text, but it can in fact be highly efficient in B2B campaigns (Figure 2). For example, 93% of most popular Facebook postings contain an image (Socialbakers 2013). Image as a con-tent format may be just an image, an image with overlaid text or an image alongside text.
4.4.3 Gifs
Gif is another content format, which is a series of images saved as a sequence and played in a loop. Apart from being more interactive and catching more attention, there are some other benefits of using gifs (Pierce 2020):
1. Several products can be shown within one image space 2. Better space utilisation
3. Time optimisation (seeing multiple images in a loop in one space instead of scroll-ing through multiple pages)
4. Better attention as a provocative image may be included in the sequence for “wow” effect
Can gifs be efficient in B2B context? Companies are often hesitant to use gifs in their campaigns as B2B communication is more formal and niche. In fact, gifs can be used for B2B communication the same way as for B2C communications as per points 1-4 above, especially in emails to fit product features to tights space (Figure 3), create educational material for content marketing as well as occasionally on social media channels as a con-versation and engagement tool (Grover 2019).
Figure 3. Guiding users’ gif by Typeform (Grover 2019)
4.4.4 Memes
Memes is also highly popular format and it is often a combination of an image or a gif and a layered text on top around a familiar topic. There are few advantages about using memes for marketing purposes (Table 5).
Table 5. Advantages of memes for marketing (Enthoven 2019).
Not expensive to make Plenty of existing memes on various topics, easy to choose from or modify existing. Often DIY style which is valued by followers
Sense of belonging to the community
Memes are all over the Internet, using memes is al-ready familiar for many users
Sharing power Memes original idea is to be shared; it provides a great opportunity to get plenty of shares by followers
Brand relevancy, timeliness Memes describe current trends, thus making the brand modern too
However, memes, as well as gifs and/or images, can be offensive, rude, and edgy, and thus should be used carefully not to offend anyone. In addition, memes should not have call to action when used by businesses (no “buy” or “subscribe”), as it may scare away readers and prevent social sharing (Enthoven 2019). Some research suggests that
memes may also be used in B2B communication, at least in some industries, but it should tie back to the brand (Viveiros 2019). Overall, given that B2B communication is rather conservative, memes could be that additional angle that could catch readers attention and differentiate from other brands when used wisely (Miller 2012, Cole 2018).
4.4.5 Video
Video is becoming more and more popular content format (see trends in social media in 3.1; Kallas 2018). For example, Wyzowl statistics report that 63% of businesses have started using video in content marketing in 2017, with 82% of users pointing out that video is important for their marketing strategy (Wyzowl 2020; Table 6).
Table 6. Benefits of video format in marketing
Video boosts sales According to Halko (2016) adding product video to landing page increases conversion by 80%. 74% of product video viewers subse-quently make a buying decision (Wyzowl 2020) Video is not expensive to produce Content of video is more important than quality
(Wyzowl 2020)
Video helps to build trust 57% of buyers in Etailing study (2013) reported that video helped them make a buying decision Video is mobile friendly 90% of buyers watch videos on mobile and
mobile video consumption on YouTube grows by 100% annually (Halko 2016). Video content and ads create higher brand loyalty (x1.4) on mobile compared to TV and computer (Think-withgoogle 2015)
Video is buyers friendly 98% of buyers watch explainer videos to learn more about a product (Wyzowl 2020)
Video has a high conversion rate Over 92% of viewers watch non-skippable ads and over 9% watch skippable video ads on YouTube (Pointsgroup 2015). Video in intro-ductory email increases click-through rate by 96% (Halko 2016).
Plays important role for SEO optimiza-tion and Google search results
Video on a website increases chance to be in the first page of Google search x53 (Moovly 2020)
4.4.6 Infographic
Infographic is another content type which could be efficient in both B2C and B2B commu-nication. For example, it is often used in magazines and newspapers to clarify information and make it easier to read. In B2B context it can also make information easier to compre-hend. Infographics does not have to be boring and there are many sources of inspiration online (French 2020).
4.4.7 Case studies
Case studies is one of the three most effective tactics as found by Content Marketing In-stitute (Pulizzi 2015). Case studies can be a great source to attract new customers, share information and generate leads as access to case studies is often behind the firewall of registration on the business website for a download. Despite its efficiency, preparing a good case study is a nontrivial task as it may take a lot of time to compile. It also requires agreements with customers about information disclosure as some data may be sensitive. Case studies are often done as a video in the form of interviews to increase engagement and entertaining (Nguyen 2016). Case studies are not frequently found on websites of law and legal companies, most likely due to a need to disclose client information. However, Dittmar & Indrenius has few references on their website which may be considered as case studies with client names revealed (Dittmar & Indrenius 2020b). More common for the law industry is to hide client names and replace it with “a client in industry XX” (where XX could be a bank, financial company and so on; Robert Half 2020).
5 Research methods
Both qualitative and quantitative data was used to shed more light on Dittmar & Indrenius usage of social media channels. Content analysis was used as a method to check perfor-mance of different messaging, content types, timing and types of social media channels. Content analysis method is a commonly used way when there is no other opportunity to analyse performance of social media or any other content medium (Drake & Salmi 2018). Such method is often used to analyse documents, diaries, websites and other sources of publicly available information.
Social media presence of Dittmar & Indrenius was analysed prior to any content analysis to select the main social media channels used by the organisation to promote messaging, build brand awareness and generate new leads. The main channels selected for this re-search were Facebook, Twitter, Instagram and LinkedIn, as they are the social media channels at use for Dittmar & Indrenius.
To obtain data, I analysed postings of the organisation on the four above mentioned social media channels over a period of three months in September, October, and November of 2019. The period was selected in this format so that it does not overlap with any major holidays such as Christmas, Easter, and summer holidays. This is because holiday sea-son is typically a very intense promotional period on social media (Kuckovic 2017) and analysis of content during such period may give biased results. Additionally, the period partly overlapped with the time I was employed by Dittmar & Indrenius (August 2019 – January 2020) as an assistant trainee and thus I could follow company events and news from inside the company.
I analysed each posting on all four official social media channels of Dittmar & Indrenius, according to the links presented in Table 1 (page 5). The data was accessed in February 2020. At the time of data collection, Dittmar & Indrenius social media channels were open to public (as they still are at the time of writing the thesis) and thus available to anyone on the Internet.
Each posting was analysed for the following:
• type of content format
• content sentiment
• number of shares
• number of likes
Additionally, I evaluated the publishing frequency per day. For the sake of simplicity and to have permanent access to the data, I took screenshots of each posting and saved it for future reference (in case a posting is later deleted, not shown or somehow missing from the social media timeline).
Only publicly available data was used, in other words I only used the data published on official social media channels, accessible from my own private account. Neither did I use, nor did I have access to internal social media channels data, for example related to stories on Instagram or Facebook, which have a lifetime of 24 hours and its statistics is not pub-licly available. At the same time, data availability on LinkedIn was somewhat limited, as LinkedIn does not provide actual data stamps apart from “published XX months ago”, and postings in the timeline could be difficult to time correctly.
6 Results
Overall, 68 postings were found on Dittmar & Indrenius social media channels over the study period, out of which 11 were on Facebook, 33 on Twitter, 12 on LinkedIn and 12 on Instagram.
6.1 Overall activity on social media channels
Dittmar & Indrenius was not active on Facebook in September and November in 2019, when no postings have been published. Similarly, Instagram had no postings in Septem-ber. Twitter postings were stable over the study period with 11 postings per month on av-erage (minimum 10, maximum 12), LinkedIn had four postings monthly on avav-erage, re-spectively (minimum 3, maximum 5). Facebook had 11 postings in October and Instagram had 11 postings in October and 1 in November (Figure 4).
Figure 4. Number of postings on Facebook, Instagram, LinkedIn and Twitter over a period of three months in 2019
Frequency of postings on four social media channels over the study period was irregular. On Facebook, there could be few postings in the row (3-4), followed by gaps of no content for several days, with two occasions of two postings per day. Instagram had few conse-quent postings in October, with several postings per day (maximum three), followed by major gaps of few weeks. Twitter postings were more regular compared to Facebook and Instagram across the study period, with seven days with two or more postings per day (maximum four). In several occasions number of postings was similar on different chan-nels, and it was mostly the same content across the four channels. Unfortunately,
LinkedIn does not have data stamps on postings, so it was not possible to analyse pub-lishing frequency.
6.2 Content language
Postings by Dittmar & Indrenius were either in Finnish or in English language depending on the social media channel with no exceptions. Facebook and Instagram postings were always in Finnish language, whereas LinkedIn and Twitter was always in English lan-guage over the study period.
6.3 Content format
Majority of the postings on all social media channels were in the text + image format. Out of all postings on Twitter, all but one had an image included (mostly a photograph from a seminar or an event), the remaining posting only had text. All postings on LinkedIn, Face-book and Instagram had an image included. None of the postings contained a gif or a meme. Out of all postings across the four channels, only three contained a video (on In-stagram and Facebook, the same video about Dittmar & Indrenius 120 years’ anniversary, Figure 5). This video was not published on LinkedIn or Twitter during the study period.
Figure 5. The same video posting across all social media channels (A – Facebook, B – In-stagram)
6.4 Content uniqueness and channel differences
All postings on LinkedIn and Facebook contained a link to an article from Dittmar & In-drenius website, so it was used to share website articles rather than had a unique piece of content. All postings on Instagram but two were also used to share website content and it was shared as text referring to a page in Dittmar & Indrenius yearly report (for example, “see page N for more information”) or a link. One of the two remaining postings contained the above-mentioned video, and the other contained an update from company fresh hires
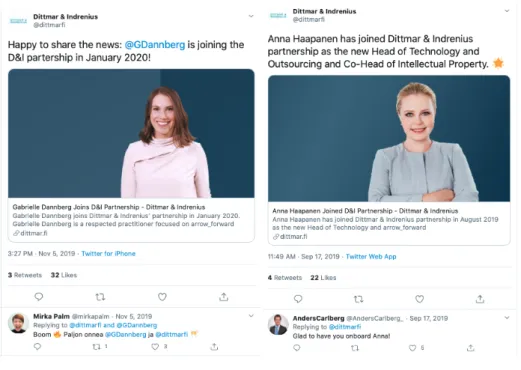
and their experience with the company. Twitter had 14 posts with unique pieces of content (42% of the total number) which did not contain any links to the company website or yearly report referrals. The postings were related to events or other news related to the company’ employees showcasing their work. The unique postings were Twitter-specific and not used on other social media channels. In general, non-unique postings were simi-lar across the four channels, in other words Twitter, Facebook, LinkedIn and Instagram were not much different in the content (Figure 6).
Figure 6. The same content across all social media channels (A – Instagram, B – Face-book, C – LinkedIn, D - Twitter)
A B
6.5 Content performance and readers’ engagement on different channels
Figure 7. Number of likes for postings on Facebook, Instagram, LinkedIn and Twitter over a period of three months in 2019 with (mean +- medians, data ranges and outliers)
In general, reader’s engagement measured as a number of likes, was low for all social media channels. Instagram had the highest reader’s engagement as reflected in average number of likes, also the engagement was most variable (40.91+-16.33, mean +- 95% CI), Twitter had the lowest engagement and it was the least variable (10,782.11, mean +-95% CI, Figure 5). There was no connection between content format and type of messag-ing on reader’s engagement. The outliers on LinkedIn and Twitter were postmessag-ings related to new partners’ announcements (Figure 5).
Postings about people had higher readers’ engagement. Interestingly, the same posting on different channels on average received x6 more likes on Instagram (36) compared to other channels (5-6 likes, Figure 7).
Out of all four social media channels postings were shared by readers on Twitter (27 out of 33 postings were shared) and Facebook (one out of 11 was shared). On average, each posting on Twitter was shared 2.66+-0.77 times (mean+-95% CI). On Facebook, the post-ing was shared three times. None of LinkedIn postpost-ings were shared, and Instagram does not have such functionality. Content format had no effect on readers’ engagement given overall low engagement level on all channels but Twitter.
On average, postings were not commented, regardless of the channel. Out of all postings, only two tweets were commented, and both were about the announcement of two new company partners (Figure 8).
7 Discussion
In this this study, social media channels of Dittmar & Indrenius were analysed. The re-search questions were around content performance on different social media channels, and differences in social media channels in respect to messaging, content types and con-tent performance.
7.1 Social media channels usage
Overall, Dittmar & Indrenius relied on Twitter as the main distributing social media channel for publishing unique content as confirmed by number of postings, publishing frequency and number of unique pieces of content published. Half of all tweets were not found on other channels; however, frequency of publishing was still extremely low comparing to other companies in the law and legal sector worldwide and so was the engagement rate (TrackMaven 2016). Facebook, Instagram and LinkedIn were mostly used for sharing links from the website. Facebook, Instagram and LinkedIn largely had the same content which was published around the same time and using similar messaging.
7.2 Language
LinkedIn and Twitter were targeted towards international audience with English as the main language of communication, whereas Instagram and Facebook were targeted to-wards local audiences in Finland. This is common for other companies who often produce content on different languages to serve different customer groups (Humphreys 2014).
7.3 Content publishing calendar
Based on the gathered data and my own user experience, Dittmar & Indrenius publishing activity on the four studied social media channels seemed not based on dates or weekly calendars but instead it seemed to be tied to the dates of their events, publishing dates of deal references and the dates of news alerts. I identified major publishing breaks for Face-book with no content in September and November, and for Instagram, with no content in September. On average, on Instagram, Facebook and Twitter there were around 10-12 postings monthly with some exceptions, where LinkedIn, in contrast, was more stable across the study period but number of postings was limited to 3-5 per month. Such fre-quency is much lower (x5-10 lower) than reported for Facebook and Twitter and about the same for Instagram for the law industry (TrackMaven 2016; Table 4). Industry-wide pub-lishing frequency is indeed shown to be lower for LinkedIn compared to other channels, but it is still 5-6 times higher than what I found in this study.
7.4 Content format and social media channels
Regardless of the social media channels, majority of the postings were in the text+image format. An image was typically a photograph or graphics mostly grabbed from a website article that the posting was promoting. Such strategy is on par with current trends in social media publishing, as using images is a good way to enrich the content and make it more entertaining (Cohen 2013; Socialbakers 2013). Out of all postings found, video was used only once on each channel (apart from LinkedIn, where video did not appear at all and Twitter, where video did not appear during the study period) and it was the same video. Interestingly, it did not receive more likes compared to postings with images, but it needs more data to be certain that video format is as engaging as images.
Dittmar & Indrenius did not use any memes or gifs in their postings. Indeed, B2B commu-nication is typically conservative and usage of memes, gifs and video is limited. Law busi-ness is a rather conservative industry and usage of memes and gifs should be done care-fully not to make any dubious or provocative/offending statements, which may in turn neg-atively affect company reputation. Also, a quick look through social media channels of some large law companies suggests that law companies’ visuals usage is limited (Baker McKenzie Twitter 2020, Kirkland & Ellis LinkedIn 2020). Nevertheless, it could be a good way to stand out from competitors as suggested by some research for B2B companies (Miller 2012, Cole 2018).
7.5 Readers engagement
Readers engagement in all social media channels was fairly low. Readers have left no comments, apart from two comments on Twitter. However, those comments were congrat-ulation messages given to two postings with content around announcement of two new partners for the company and did not lead to any further discussion. Instagram was the most engaging social media channel out of all four with number of likes four times higher than on any other channel (40 likes compared to 10-12 average likes for other channels). At the same time, postings on Instagram had the highest variation, when number of likes ranged from 0 to 81; while on Facebook, Twitter and LinkedIn user engagement was flat-ter across postings (Figure 5). Identified number of likes on Instagram was much higher than reported for law companies in general (ca 12 likes on average), but number of likes on Facebook, Twitter and LinkedIn was much lower than that reported by earlier research (TrackMaven 2016). There are several factors which could explain the difference. First, TrackMaven report is the only known extensive report comparing different social media channels and industries. However, the report was published in 2016 and things could have changed since then. Second, it is known that majority of Instagram audience is in the
18-24 age group, where 71% have an account (Smith & Anderson 2018). Perhaps, the firm's younger employees who belong to this age group were engaging the most with the company Instagram content. This, however, requires further investigation. Lastly, data col-lected is scattered as no postings were published on Facebook in September and Novem-ber, and no postings on Instagram were published in September during the study period, which could influence the results.
Nevertheless, it is not possible to say whether messaging type had any effect on readers’ engagement, as it was rather uniform on all channels, but Instagram. Clearly, postings about people received more likes and have higher readers’ engagement, but it requires more data to further analyse this question.
7.6 Recommendations
Overall, based on what was discovered during this project, I can recommend that content should be published more regularly, without gaps of several weeks between the postings. Apparently, now publishing on social media is tied to events and press releases. I recom-mend that content is published daily and not necessarily related to the firm, but it could be about overall situation in the industry. For example, one of the oldest law firms, Baker McKenzie, publishes on Twitter at least once a day and they started a podcast related to COVID-19 and its effects on employees (Baker McKenzie Twitter 2020). Also, Dittmar & Indrenius can try experimenting more with different content formats, especially with video, memes and gifs.
The firm may also experiment with publishing unique content on different channels to see what resonates with the audience and what does not. Making content modifications ac-cording to age groups for different social media channels could be worth checking as well. It is not clear whether other companies in the law industry try this approach as their chan-nels often refer to own websites and have corporate content full of jargon (Baker McKen-zie Twitter 2020, Kirkland & Ellis LinkedIn 2020). Nevertheless, it could be interesting to try as this is also recommended by some digital and marketing agencies for the industry (Cheung, 2020, Zuneshine, 2020).
Additionally, checking what other law firms in Finland or worldwide publish and how they differentiate social media channels could be a great source of inspiration. Quick check on what others are doing in this space suggests that it is not unusual for law companies to publish corporate content with limited visuals (Baker McKenzie Twitter 2020, Kirkland & Ellis LinkedIn 2020), so Dittmar & Indrenius could be a pioneer in making content more
from social media channels experiments with data before moving to the next experiment or new strategy implementation.
7.6.1 Facebook
Facebook is undoubtedly the most used social media channel worldwide and has a broad appeal (Smith & Anderson 2018; Walton 2019). Nevertheless, based on number of post-ings and reader’s engagement its usage is in my opinion underestimated by Dittmar & In-drenius. General recommendations outlined above are applicable for Facebook. In short, I recommend the firm to increase publishing frequency and experiment with different con-tent formats.
7.6.2 Instagram
Overall, Instagram performance is better compared to what is known from other compa-nies in the law industry worldwide. Instagram probably has the highest potential for younger audience of the firm as even with irregular publishing it was still the most engag-ing channel. To make the engagement even higher, I recommend publishengag-ing more unique content and test different content formats, especially video, and also try Instagram stories as those are highly popular source to generate traffic for businesses (Instagram 2020).
7.6.3 LinkedIn
LinkedIn is highly engaging social media channel for Dittmar & Indrenius compared to per-formance of Twitter and Facebook. However, it could be utilised even more, given that at the moment content is published irregularly, and it is mostly not unique to the channel. I can recommend publishing more frequently on LinkedIn, with more unique content, as well as experiment with content types.
8 Evaluation
This thesis provides some suggestions for planning social media content at Dittmar & In-drenius. Hopefully, my findings will be considered while doing evaluation of the firm social media channels, and information will be shared across stake holders of the firm. The the-sis is based on publicly available data and it is therefore not possible to obtain detailed data on content sharing, number of views of certain types of content, for example Insta-gram stories. Hopefully, a responsible person from Dittmar & Indrenius will use this thesis alongside the internal data to make readers experience even better.
This thesis was mostly manual work to compare different social media channels. I am not aware whether the firm has any analytics tools in place which can combine data from sev-eral social media channels, for example, Sprout Social or BuzzSumo (Barnhart 2020b). Such data would make it easier to analyse yearly performance and monthly trends as I have focused on data from three months in 2019 and thus the results have limited scope.
During the project, I had a great chance to work with Dittmar & Indrenius staff side by side for a period of six months. It was tough but enjoyable. I learned many new things in a very short time window, and I started having a lot of responsibility on my shoulders almost from the beginning.
Collecting theoretical information from the firm social media channels was interesting and eye opening. I had a chance to read information from various websites providing helpful content related to readers’ engagement on social media. Overall it was a great source of inspiration. Obtaining the data and analysing it helped me eget better understanding of so-cial media channels and how they are used in real life in B2B context, not by a private per-son. I realised that social media is indeed a highly powerful tool to build brand awareness and to grow business.
Naturally, there were some stressful moments too, when many things had to be done at once and I had to make some sacrifices, shift priorities and focus on what was important. Such knowledge and experience will help me in my future career development as an inde-pendent young professional.
References
Amaresan, S. 2018. What Is Social Listening & Why Is It Important? URL: https://blog.hubspot.com/service/social-listening. Accessed: 14 April 2020.
Aslam, S. 2020. LinkedIn by the Numbers: Stats, Demographics & Fun Facts. URL: https://www.omnicoreagency.com/linkedin-statistics. Accessed: 14 April 2020.
Baker McKenzie Twitter. 2020. URL: https://twitter.com/bakermckenzie. Accessed: 12 May 2020.
Barnes, J. 1954. Class and Committees in a Norwegian Island Parish. Human Relations, 7, pp. 39-58.
Barnhart, B. 2020a. The most important social media trends to know for 2020. URL: https://sproutsocial.com/insights/social-media-trends. Accessed: 14 April 2020.
Barnhart, B. 2020b. 10 of the best social media analytics tools for marketers. URL: https://sproutsocial.com/insights/social-media-analytics-tools. Accessed: 12 May 2020.
Buffer. 2019. State of Social. URL: https://buffer.com/state-of-social-2019. Accessed: 14 April 2020.
Cheung, L. 2020. The guide: social media for lawyers. URL: https://cubesocial.com/social-media-for-law-firms/. Accessed: 27 April 2020.
Clement, J. 2019. Number of active Instagram business profiles from September 2016 to November. URL: https://www.statista.com/statistics/222243/number-of-instagram-busi-ness-acounts. Accessed: 14 April 2020.
Clement, J. 2020a. Number of social network users worldwide from 2010 to 2023. URL: https://www.statista.com/statistics/278414/number-of-worldwide-social-network-users. Ac-cessed: 14 April 2020.
Clement, J. 2020b. Number of monthly active Facebook users worldwide as of 4th quarter 2019. URL: https://www.statista.com/statistics/264810/number-of-monthly-active-face-book-users-worldwide. Accessed: 14 April 2020.
Clement, J. 2020c. Most popular social networks worldwide as of January 2020, ranked by number of active users. URL: https://www.statista.com/statistics/272014/global-social-networks-ranked-by-number-of-users. Accessed: 14 April 2020.
Cohen, H. 2013. Social Media Images: 5 Ways to Go Viral. URL: http://heidico-hen.com/social-media-images-5-ways-to-go-viral. Accessed: 14 April 2020.
Cohn, C. 2015. Differences In Selling B2B Vs. B2C. URL:
https://www.forbes.com/sites/chuckcohn/2015/06/16/differences-in-selling-b2b-vs-b2c/. Accessed: 29 April 2020.
Cole, A. 2018. More Than A Trend: Meme Marketing Is Here To Stay. URL:
https://www.forbes.com/sites/forbesagencycouncil/2018/07/19/more-than-a-trend-meme-marketing-is-here-to-stay/. Accessed: 29 April 2020.
Dittmar & Indrenius. 2020a. Dittmar & Indrenius. URL: https://www.dittmar.fi. Accessed: 14 April 2020.
Dittmar & Indrenius. 2020b. References. URL: https://www.dittmar.fi/references. Ac-cessed: 14 April 2020.
Dollarhide, M. E. 2019. Social Media Definition. URL: https://www.in-vestopedia.com/terms/s/social-media.asp. Accessed: 14 April 2020.
Enthoven, J. 2019. How to Use Memes: A Guide for Marketers. URL: https://www.so-cialmediaexaminer.com/how-to-use-memes-guide-for-marketers. Accessed: 14 April 2020.
Etailing. 2013. How Consumers Shop With Video. Based on a 4Q 2012 Research Study of 1,000 Consumers. URL:
http://www.e-tailing.com/content/wp-content/up-loads/2013/03/EtailingGroup_Whitepaper_3.pdf. Accessed: 14 April 2020.
Fertig, A. 2017. How Headhunters Use LinkedIn to Find Talented Candidates. URL: https://money.usnews.com/money/blogs/outside-voices-careers/articles/2017-05-05/how-headhunters-use-linkedin-to-find-talented-candidates. Accessed: 14 April 2020.
Fontanella, C. 2019. A Simple Guide for an Effective Inbound Call Strategy. URL: https://blog.hubspot.com/service/inbound-call-strategy. Accessed: 14 April 2020.
Freberg, K., Graham, K., Mcgaughey, K., & Freberg, L. 2011. Who are the social media influencers? A study of public perceptions of personality. Fuel and Energy Abstracts, 37, pp 90-92.
French, K. 2020. 50 B2B Infographics That Prove B2B Doesn’t Have to Be Boring. URL: https://www.columnfivemedia.com/50-b2b-infographics-prove-b2b-doesnt-boring. Ac-cessed: 29 April 2020.
Friedman, J. 2014. What Makes LinkedIn Different From Facebook and Twitter. URL: https://www.investopedia.com/articles/markets/042414/what-makes-linkedin-different-fa-cebook-and-twitter.asp. Accessed: 14 April 2020.
Globalwebindex. 2019. Social media trends in 2019. URL: https://www.globalwebin-dex.com/reports/social-2019. Accessed: 14 April 2020.
Gorbach, M. 2019. How to avoid spam filters. URL: https://snov.io/knowledgebase/how-to-avoid-spam-filters. Accessed: 14 April 2020.
Grover, V. 2019. 4 Ingenious Ways to Use GIFs to Make Your B2B Content Marketing Pop. URL: https://www.martechadvisor.com/articles/content-marketing/gifs-for-b2b-mar-keting/. Accessed: 29 April 2020.
Ha, A. 2017. There are now 25M active business profiles on Instagram. URL:
https://techcrunch.com/2017/11/30/instagram-25-million-business-profiles. Accessed: 14 April 2020.
Halko, A. 2016. 50 Must-Know Stats About Video Marketing 2016. URL: https://www.in-sivia.com/50-must-know-stats-about-video-marketing-2016. Accessed: 14 April 2020.
Hirsh, S. 2017. 'The Nike Outfit' Goes Viral as New 'Dress' Debate. URL:
https://www.teenvogue.com/story/nike-outfit-the-dress-optical-illusion. Accessed: 14 April 2020.
Hubspot Academy. 2020. Using HubSpot Video For Your Sales Emails in HubSpot. URL: https://academy.hubspot.com/lessons/personalized-video. Accessed: 11 May 2020.