Efficiency of Smallholder Cocoa Farmers in
Malaysia: A DEA Approach
Wan Roshidah Fadzim#1, Mukhriz Izraf Azman Aziz#2, Ahmad Zafarullah Abdul Jalil*3 #
School of Economics, Finance and Banking, Universiti Utara Malaysia, 06010 Sintok, Kedah, Malaysia *ASEAN Integration Monitoring Office (AIMO)
1 wanroshidah@uum.edu.my 2 mukhriz@uum.edu.my 3 ahmad.zafarullah@asean.org
Abstract—Cocoa production in Malaysia faced several problems and challenges that lead to low productivity. The low productivity is evidenced from the continuous drop in cocoa production since 2001 despite efforts from governing bodies to boost output. This study investigates this issue by looking into the production efficiency among small holder cocoa farmers in Malaysia. The technical efficiencies of cocoa farmers in Malaysia are estimated using data envelopment analysis. The study relies upon primary data gathered during the 2013 production season. Data are collected from a set of structured questionnaire administered on 323 smallholder cocoa farmers throughout Malaysia. Results of the analysis reveal that the mean efficiency score is 0.576. This indicates that many cocoa farmers in Malaysia are technically inefficient and this resulted into the low productivity in the Malaysian raw cocoa beans industry in recent years. This inefficiency is largely due to poor management and usage of inputs in the cocoa production. Keywords— Cocoa, technical efficiency, data envelopment
analysis
1.
Introduction
The first cocoa project in Malaysia was started at Jerangau, covering 403 hectares of land in 1953 (Malaysian Cocoa Board). Cocoa trading commercially in Malaysia started since 1960s and it is currently ranked fourth after palm oil, rubber and forestry products in the agricultural sector. Malaysia was the fourth largest cocoa producing country in the world after Ivory Coast, Ghana and Brazil in 1990. However, in 2010, it was ranked 13th in the world. The decline of Malaysia’s position as a major exporter of cocoa in the world was due to the reduction in the local production of cocoa beans. According to Malaysian Cocoa Board (MCB hereafter), small scale farmers prefer to grow oil palm and rubber trees instead of cocoa. The preference for oil palm and rubber trees is attributed to the simplicity in the plantation process.
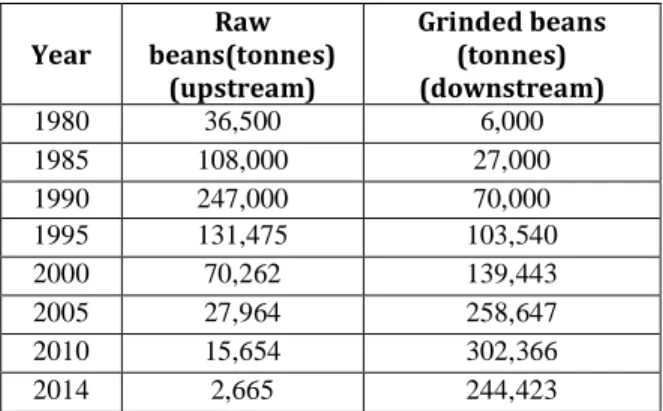
Malaysia’s raw cocoa beans production registered a continuous decline since the mid 90’s. Based on Table 1, domestic raw cocoa beans production achieved its peak in 1990 at 247,000 metric tons. A significant drop in production occurred since 1995, when output dropped from 131,475 tons in 1995 to 70,262 tons in 2000. In 2014, only 2,665 tons were produced. In the cocoa grinding sector however, production increased from 103,540 tons in 1995 to 139,443 tons in 2000 and 244,423 tons in 2014. The continued growth in the cocoa grinding sector however presents opportunities for farmers to increase raw cocoa beans output.
Nonetheless, the recent data on raw cocoa beans output in Malaysia indicate that this industry which is mostly operated by small-scale farmers is plagued with inefficiencies. Thus the fluctuations of cocoa output despite efforts from governing bodies such as Malaysian Cocoa Board and Ministry of Agriculture justifies the need to investigate this concern further. Therefore, this study addresses this issue by estimating the technical efficiency of Malaysian smallholder cocoa farmers in
order to determine the sources of their technical inefficiencies.
Table 1.Indicates Malaysia Cocoa Beans Production Source:http://www.koko.gov.my/lkmbm/industry/statistic/ p_cocoabean.cfm
Note that section 2 of this paper reviews the existing literatures on cocoa production, section 3 presents the
Year Raw beans(tonnes) (upstream) Grinded beans (tonnes) (downstream) 1980 36,500 6,000 1985 108,000 27,000 1990 247,000 70,000 1995 131,475 103,540 2000 70,262 139,443 2005 27,964 258,647 2010 15,654 302,366 2014 2,665 244,423 ______________________________________________________________ International Journal of Supply Chain Management IJSCM, ISSN: 2050-7399 (Online), 2051-3771 (Print) Copyright © ExcelingTechPub, UK (http://excelingtech.co.uk/)
empirical model and data, section 4 discusses the empirical results and section 5 is the conclusion.
2.
Literature Reviews
The study on efficiency was spearheaded by Farrel [10]) through his paper, entitled "Measurement of Productive Efficiency" with the main aim of estimating the efficiency of the agricultural sector in the United States in comparison to other countries. This paper consequently became a guide to various researches as well as efficiency measurement method. In his paper, Farrel classified efficiency into two components of technical competence, also known as pure technical efficiency and allocative efficiency or cost efficiency.
Measurement of efficiency adopted by Farrell [10], gradually evolved from a simple scale case to a complex scale, with two inputs and one output, to solve the more general case with various types of inputs. Thereafter, in the 1990s, studies focused on differences in methodology in producing different results. It is crucial to note that a big number of studies on efficiencies used a combination of non-parametric approach (Data Envelopment Analysis / DEA) and the parametric approach. The studies that used DEA approach included [14], [18], [19], [20] and [22], while studies which used parametric approach included [2], [3], [4], [9], [10], [13], [15] and [16].
Although the parametric approach has been widely utilized in most studies of efficiency, the non- parametric approach such as the DEA is more applied in the production sector particularly in the agricultural sector such as the study by [1], [10], [15] and several other researchers. It should be noted that most studies of production efficiency among smallholder cocoa farmers were mostly carried out by cocoa-producing countries such as Nigeria and Ghana, like studies by [3] and [23 and [5], [3] and [8] respectively. In Malaysia, there is lack of research that investigates the efficiencies of smallholder cocoa farmers. The only study was done by [18] in 1990 and he only covered two states in the Peninsular Malaysia, namely Selangor and Perak.
A study carried out by [17], involved 240 cocoa farmers at Ondo, Nigeria found out that farmers were very efficient in using resources in cocoa production. Further still, [2] in his study pointed out that the study of the level of efficiency performed in one sector can assist policy makers in regulating and improving cocoa production in Nigeria. Cocoa production according to him will lead to increased farmer’s revenue which will ultimately help the development process of the country.
Another study on the efficiency of smallholder cocoa farmers was carried out by [5] in four countries;- Cameroon, Ghana, Nigeria and Cote d'Ivoire. This study involved 3,746 active cocoa farmers. The study found out
that there was a big potential of cocoa farmers in one country to compete with another. This indicates the necessary role efficiency plays for the farmers to achieve productivity potential.
3.
Data and Method
This study used a cross-section of data for the production year of 2013. This data was collected through a cross sectional survey of cocoa farmers in the West and East Malaysia involving 323 smallholder cocoa farmers using simple cluster random sampling. Information were gathered through a face-to-face structured interview questionnaire designed for collecting information on output, inputs, prices of variables, and some important socio economic variables about the farmers.
3.1. Analytical Techniques
The study used Data Envelopment Analysis method (DEA hereafter) in order to estimate the production efficiency for smallholder cocoa farmers in Malaysia, which is a non-parametric approach introduced by Charnes[5] (CCR hereafter) based on the model of production efficiency that was spearheaded by Farell [8].This is due to the fact that DEA construct a piecewise linear production surface using linear programs and computes; an efficiency score for each decision making unit (DMU) along the lines suggested by Farell [10] besides being very versatile and capable of accommodating multiple inputs and outputs. Besides that, DEA does not require any parametric specification and thus it is not susceptible to specification error, even though, the DEA approach is sensitive to outliers that might exaggerate the actual frontier because it does not take into account of the possible influence of measurement error and other noise in the data.
3.2. DEA Models
This study is based on the BCC Model (BCC hereafter) introduced by [4] as indicated below.
max Φ subject to ≤ i=1,2,3,…….,m; ≥ r=1,2,3,…….,s; = 1
≥ 0
j=1,2,3,…….,n.
(1)
where;
Φ is the efficiency score
is the output i produced by farmer j is the input i used by farmer j λy is the weight for the output
λx is the weight for the input
λj =1 is the constrain
In case Φ = 1, then the cocoa farmer is said to be efficient and if Φ <1, then the farmer is said not to be efficient and his output is below the maximum. This shows that the farmer has to increase his output to the current input. In this study, the outputs and inputs for small cocoa farmers are;
y = number of dry cocoa beans produced in a year (kg) x1 = the age of matured cocoa trees that have started
giving out produce
x2 = number of workers on the farm
x3 = quantity of fertilizers used on the farm
x4 = quantity of pesticide used on the farm
x5 = number of cocoa trees planted
From the point of view of micro-economics theory,the main objective of entrepreneur is to operate at the most productive scale size or optimal, namely the constant returns of scale (CRS) to reduce costs and maximize revenue. In the short term, businesses can operate in a state of increasing returns to scale (IRS) or decreasing returns to scale (DRS). However, in the long run, the entrepreneurs would have to operate at CRS by growing larger or reducing the size in order to survive in the market. This process may involve adjustments to operating strategy, whether in terms of increasing or decreasing the size scale.
According to [7], scale efficient score can be defined as the ratio of CRS efficiency score divided by the Variable Return to Scale (VRS) efficiency score (CCR / BCC) or the ratio of technical efficiency (TE) to pure technical efficiency (PTE). Increasing returns to scale (IRS) or decreasing returns to scale (DRS) can be identified by the expression on the BCC model output in equation (1) as follows:
i. If∑ < 1 the impending incompetence scale will happen due to increasing returns to scale
ii. Conversely, if ∑ > 1 , reflects the inefficiency caused by decreasing returns to scale, and if
iii. ∑ = 1 the constant returns of scale is achieved.
Specifically, the BCC model explains technical efficiency from VRS perspective. This model assumes input and output changes disproportionately. Accordingly, efficiency scale score for the firm i can be measured using the following formula ; SE= ,"#$
% ,&#$ where SE is the
efficiency scale scores, TEi,CRS is technical efficiency
under CRS and PTEi,VRS is pure technical efficiency score
under VRS. If score SE = 1 this shows the efficiency of scale and if score SE <1 shows the inefficiency of scale. Inefficiency of scale can be attributed to the existence of either increasing or decreasing returns to scale.
This paper employs BCC maximizing output orientation model using the DEA method. Table 2 provides a list of inputs and outputs employed in the DEA method:
Table 2.Summary of definitions of inputs and outputs in the DEA analysis
Variable Measurement unit Description of variable Output Dry cocoa beans
Kilogram (kg) Quantity of dry cocoa beans produced Input Tree Labour Fertilizer Pesticides Cocoa tree Years No. of people Kilogram Litter No. of trees Age of tree Quantity of labour
Quantity of fertilizer used
Quantity of pesticide used
Quantity of cocoa trees planted
4.
Result and discussion
This section discusses the findings of technical efficiency derived from equation (1). Estimation for DEA is carried out using DEAP program version 2.1.
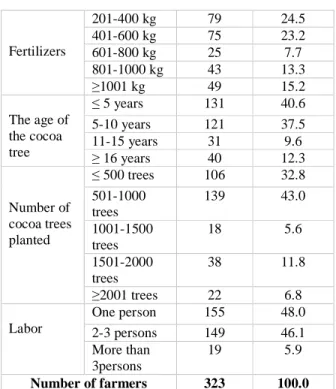
Table 3. Summary Statistics of Input and Output of Cocoa Production Production variables Cocoa Number percentage Output: Dried cocoa beans ≤500 kg 156 48.2 501-1000 kg 72 22.3 1001-1500 kg 50 15.5 ≥1501 kg 45 14 Input: Pesticide ≤20 litters 263 81.4 21-40 litters 49 15.2 41-60 litters 11 3.4 ≤200 kg 52 16.1
Fertilizers 201-400 kg 79 24.5 401-600 kg 75 23.2 601-800 kg 25 7.7 801-1000 kg 43 13.3 ≥1001 kg 49 15.2 The age of the cocoa tree ≤ 5 years 131 40.6 5-10 years 121 37.5 11-15 years 31 9.6 ≥ 16 years 40 12.3 Number of cocoa trees planted ≤ 500 trees 106 32.8 501-1000 trees 139 43.0 1001-1500 trees 18 5.6 1501-2000 trees 38 11.8 ≥2001 trees 22 6.8 Labor One person 155 48.0 2-3 persons 149 46.1 More than 3persons 19 5.9 Number of farmers 323 100.0 Source: Survey, 2013
The summary of statistics in Table 3 shows the descriptive statistics of inputs and outputs used in the production of cocoa. Output variable indicates the number of cocoa beans, which are measured by weight in kilograms produced by smallholders in the period of one year (January to December 2013). According to the descriptive information in the table, more than 48 percent (156 farmers) smallholders produced up to 500 kilograms of cocoa beans per year and 22.3 per cent or about 72 farmers produced 501-1000 kilograms of cocoa beans per year. Meanwhile around 50 and 45 smallholder of cocoa each produce over 1000 kilograms and 1500 kilograms of cocoa beans per year.
As for the for the input variables, a total of five inputs have been identified, namely pesticides, fertilizers, cocoa tree age, number of cocoa trees that have started giving out produce and number of workers. Pesticide was measured in terms of liters for a period of one year. According to the statistics, it can be concluded that the use of pesticides by cocoa farmers was up to 60 liters a year. However, 81 per cent or about 263 of them only used around 20 liters and below. It is interseting to note that farmers who use more than 40 to 60 liters are about 11 people or 3.4 per cent compared to 15.2 per cent who used more than 20-40 liters of pesticides per year. In addition, the use of pesticide also shows varying values. Based on the statistics, the highest ammount of fertilizer used by 43 cocoa smallholders in one year ranged between 2001-400 kilogram followed by 401 to 600 kilograms, meanwhile the minimum mmount of fertilizer used ranged between 801-1000 kg per year. The age of cocoa tree also showed that the majority of 131 or 40.6 per cent cocoa farmers had cocoa trees of
less than 5 years old. Nevertheless, a total of 121 farmers had very productive cocoatrees ranging between 5 to 10 years. At this age, cocoa plants produce more cocoa than less than 5 years of age. However, a small number of farmers between 31 and 40 farmers each had cocoa trees aged between 11 to 15 years old and more than 16 years. Typically, cocoa trees aged over 10 years will have a declining production compared to the younger ones. It is crucial to note that a total of 106 farmers have up to 500 while 139 farmers have between 501 to 1000, 18 farmers have between 1001 to 1500, 38 farmers have between 1501 to 2000 and 22 farmers have more than 2001 matured productive cocoa trees.
Another variable input used by cocoa smallholder is labor. From the point of view of numbers , it was found out that a total of 155 farmers were assisted by one worker and 149 farmers had two to three workers. This represents a small percentage of 5.9 a total of 19 farmers whowere being assisted by more than three workers. This difference in the use of labor may be due to several factors such as the size of the area of land cultivated and may be because farmers do other other jobs other than cocoa farming.
Table 4. Mean Technical Efficiency Score of Smallholder Cocoa Farmers
CRS VRS TE PTE SE Minimum Score 0.067 0.106 0.148 Standard Deviation 0.230 0.255 0.183 Mean Score 0.447 0.576 0.804 Efficiency Score = 1 No. of farmers 8 (2.5%) 38 (11.8%) 17 (5.3%) Efficiency score<1 No. of farmers Total samples 315 (97.5%) 323 285 (88.2%) 323 306 (94.7%) 323 Note: TE : Technical Efficiency PTE : Pure Technical Efficiency SE : Scale Efficiency
Table 4 shows the statistics of the results of technical efficiency for cocoa smallholders in Malaysia. Efficiency scores ranged from 0 to 1. It shows efficiency index for smallholder cocoa farmers in Malaysia for the production year 2013. More than 85 percent of cocoa smallholders in Malaysia have efficiency score less than one for both technical efficiency measures under CRS and VRS. It reveals that majority of cocoa farmers do not produce at the optimum level of output under the existing technology and inputs combination.The number of efficient farmers measured under CRS is lower than that of VRS.
Specifically, under CRS, 8 out of 323 smallholders were classified as efficient while under VRS, a total of 38 small farmers were efficiently classified. Differences exist because the technical efficiency index of cocoa farmers estimated under CRS is based upon the assumption that farmers will maximize output from the currently available resources. However, this assumption is not relevant for cocoa farmers who do not operate at its optimum level because they are yet to fully utilize the available resources efficiently.
From the analysis, the average score of efficiency for farmers measured using CRS was 0.447 (or 44.7%). This indicates that the smallholders can expand their output up to 55.3 percent using the same combination of inputs. For efficiency measured under VRS, the index can be observed from two aspects; Pure Technical Efficiency (PTE) and Scale Efficiency (SE). Results show that inefficiency due to PTE is higher than SE. This is based on the mean SE efficiency score of 0.827 which is higher than the mean PTE score of 0.576. The PTE score value indicated that cocoa smallholders can expand their output up to 42.4 percent at the level of existing technology and inputs.
4.1. Scale Efficiency Scores of Cocoa Farmers
Table 5. Scale Efficiency of Cocoa Farmers Scale Efficiency Number of farmers
IRS 300
CRS 18
DRS 5
No. of farmers 323
Table 5 shows the analysis of SE for all 323 cocoa farmers in the study. These scores may be decomposed into three types of returns; increasing return to scale (IRS), decreasing return to scale (DRS) and constant return to scale (KRS). For IRS, the percentage change of cocoa beans (output) is greater than the percentage change in the input. In DRS, the percentage change in output is smaller than the percentage change in input. Finally, CRS shows the percentage change in cocoa input is equal to the percentage change in output.
The analysis of the scale returns show that a majority of 92.8 per cent cocoa smallholders (300 farmers) in Malaysia are on a scale of increasing returns. The IRS was found to be the best option for improving the productivity of cocoa which may lead to reduction in the average cost of production. This has an implication for smallholders operating on IRS of being able of to produce output that will meet the market demands at a lower cost compared with cocoa farmers from other countries.
5.
Conclusion
Technical efficiency is an important determinant of competitiveness especially for smallholder cocoa farmers in Malaysia. This paper re-examine this matter that was scrutinized by [16] in 1990. The results of this study show that most of the cocoa farmers in Malaysia are technically inefficient due to poor management and usage of inputs. Based on the findings, the Malaysian Cocoa Board should organize refresher courses to engage the farmers with activities and programs that could help them improve their technical efficiency. This was due to the low efficiency scores obtained from the DEA analysis which showed that smallholder cocoa farmers need to be efficient if they wish to remain competitive in the industry. For this objective to be achieved cocoa farmers must be strongly committed to achieve this objective however, this requires their strong commitment as well as other agencies involved. Relevant policies too should be pursued which will directly have a positive bearing on the efficiency of the cocoa farmers.
References
[1] Alemdar, T., & Ören, M. N. (2006). Determinants Of Technical Efficiency Of Wheat Farming In Southeastern Anatolia, Turkey: A Nonparametric Technical Efficiency Analysis. Journal of Applied Sciences, 6(4), 827–830. http://doi.org/10.3923/jas.2006.827.830
[2] Amos, T. T.,An analysis of productivity and technical efficiency of smallholder cocoa farmers in Nigeria. Journal of Social SciencesVol 15(2), 127-133, 2007
[3] Aneani, F., Anchirinah, V. M., Asamoah, M., & Owusu-Ansah, F., Analysis of economic efficiency in cocoa production in Ghana. African Journal of Food, Agriculture, Nutrition and Development, 11(1), 2011.
[4] Banker, R. D., Charnes, A., & Cooper, W. W., Some models for estimating technical and scale inefficiencies in data envelopment analysis. Management science, Vol 30(9), 1078-1092, 1984. [5] Binam, J. N., Gockowski, J., & Nkamleu, G. B.,
Technical efficiency and productivity potential of cocoa farmers in West African countries. The Developing Economies, 46(3), 242-263, 2008. [6] Charnes, A., Cooper, W. W., & Rhodes, E.,
Measuring the efficiency of decision making units. European journal of operational research, Vol 2(6), 429-444, 1978.
[7] Coelli, T. J., Rao, D. S. P., O'Donnell, C. J., & Battese, G. E., An introduction to efficiency and productivity analysis. Springer Science & Business Media, 2005.
[8] Coelli, T., Rahman, S., & Thirtle, C. (2002). Technical, Allocative, Cost and Scale Efficiencies in Bangladesh Rice Cultivation: A Non-parametric Approach. Journal of Agricultural Economics,
53(3), 607–626. http://doi.org/10.1111/j.1477-9552.2002.tb00040.x
[9] Dhungana, B. R., Nuthall, P. L., & Nartea, G. V. (2004). Measuring The Economic Inefficiency Of Nepalese Rice Farms Using Data Envelopment Analysis. Australian Journal of Agricultural and Resource Economics, 48(2), 347–369.
http://doi.org/DOI 10.1111/j.1467-8489.2004.00243.x
[10] Damian Ila, A., Ben Ohen, S., Okoi Itam, K., & N Inyang, N., Analysis of technical efficiency of smallholder cocoa farmers in Cross River State, Nigeria. International Journal of Agricultural Management and Development,2(3), 177-18, 2012. [11] Farrell, M. J., The measurement of productive efficiency. Journal of the Royal Statistical Society. Series A (General), 120(3), 253-290, 1957. [12] Hanani, N., Setiawan, B., & Muhaimin, A. W.,
Effect characteristics of farmers on the level of technology adoption side-grafting in cocoa farming at Sigi Regency-Indonesia. Journal of Agricultural Science, 5(12), 72, 2013.
[13] Kachroo, J., Sharma, A., & Bhat, A., Study on Growth and Instability of Maize in Jammu and Kashmir. Economic Affairs, 58(1), 21-28, 2013. [14] Kolawole, O., & Ojo, S. O.,Economic Efficiency of
Small Scale Food Crop Productionin Nigeria: A Stochastic Frontier Approach.Journal of Social Sciences, 14(2),123–130, 2007.
[15] Krasachat, W., Cost efficiency in Thai agricultural production. Journal of Agricultural Economics, 20(2), 73-82, 2001.
[16] Malaysian Cocoa Board, Retrieved fromhttp://www.koko.gov.my/lkmbm/industry/stat istic/cocoacultivated.cfm, 2004
[17] Ogundari K, Aladejimokun OA, Resource-Use and Technical Efficiency of small-Holder Cocoa Farmers in Ondo State: A Stochastic Frontier Analysis. Journal of Applied Tropical Agriculture, 11(1), 26–31, 2006.
[18] Othman, N. B., Factors affecting cocoa productivity among the smallholders in West Malaysia. University of Stirling, 1990
[19] Richman, D., “What drives Efficiency on the Ghanaian Cocoa Farm?”. In CSAE Conference, January, 2010.
[20] Sharma K.R., Leung P. and Zalenski H.M. (1997): Productive Efficiency of the Swine Industry in Hawai: Stochastic Frontier vs. Data Envelopment Analysis, Journal of Productivity Analysis 8: 447-459.
[21] Simar L. and Wilson P. (2000a): A General Methodology for Bootstrapping in Nonparametric Frontier Models, Journal of Applied Statistics 27 (6): 779-802.
[22] Simar L. and Wilson P. (2000b): Statistical Inference in Nonparametric Frontier Models: The State of the Art, Journal of Productivity Analysis 13 (1): 49-78
[23] Taiwo, O., Ogunlade, M. O., Ayegboyin, K. O., Famaye, A. O., Adeniyi, D. O., Oyedokun, V. A., ... & Adejobi, K. B.,Factors affecting the practice of cocoa rehabilitation techniques in Nigeria: A case of South-west and South-south geoecological zone. International Journal of Advance Agricultural Research, Volt 3, 25-30, 2015 [24] Weersink A.; Turvey G.C. and Godah A. (1990):
Decomposition Measures of Technical Efficiency for Ontario Dairy Farms, Canadian Journal of Agricultural Economics 38: 439-456.