C
A
2
Creight
Annual
2012
‐
1
ton
Sc
l
Repo
13
chool
D
ort
ApprovedDivisio
dNovembeon
#11
er25,201311
Table of Contents
Letter of Transmittal . . . 1
Highlights/Accomplishments for 2012-13 . . . . 2
Introduction . . . . 3
School Division Profile . . . . 4
About Us . . . 4
Division Mission Statement . . . 4
Division Vision Statement . . . 4
Division Core Values and Beliefs . . . .. . . 4
Program Overview . . . 4
School Division Planning . . . 6
Strategic Plan . . . 6
Continuous Improvement and Accountability Framework . . . 6
The School Division in the Community . . . . 7
Community and Parent Involvement . . . 7
Community Partnerships . . . 7
Governance . . . . 7
The Board of Education . . . 7
School Community Councils . . . 8
Our Students and Staff . . . . 9
Students . . . 9
Staff Profile . . . 10
Higher Literacy and Achievement . . . 11
Grade 12 Graduation . . . 11
Average Final Marks . . . 13
Equitable Opportunities . . . 14
Strategies to Meet Needs of Diverse Students . . . 14
Smooth Transitions . . . . 14
Grade 7 to 10 Transitions . . . . 14
Credit Attainment . . . . 15
System Accountability and Governance . . . . 16
School Community Councils and Learning Improvement Plans . . . . 16
Facilities and Transportation . . . 17
Facilities . . . . 17
Student Transportation . . . . 17
Financial Overview . . . . 18
Appendix A: Management Report and Audited Financial Statements . . . . 20
Appendix B: Organization Chart . . . . 21
Appendix C: School List . . . . 22
Appendix D: Payee List – 2012-13 . . . . 23
Board of Education Remuneration . . . . 23
Personal Services . . . . 23
Supplier Payments . . . . 24
Appendix E: Infrastructure Projects – 2012-13 . . . . 24
List of Figures
Figure 1: Location of Creighton School Division . . . 4Figure 2: Enrolment by Grade – September 30 . . . 9
Figure 3: School Division Staff – 2012-13 . . . 10
Figure 4: Grade 12 Graduation – Students Completing Grade 12 in Three Years . . . 11
Figure 5: Grade 12 Graduation – Students Completing Grade 12 in Five Years . . . 12
Figure 6: Average Final Marks in Selected Secondary Level Courses . . . 13
Figure 7: Student Transitions Between Grades 7 and 10 . . . 14
Figure 8: Average Credits Earned per Post-Secondary Student . . . 15
Figure 9: Student Transportation 2012-13 . . . 16
Figure 10: Summary of Revenue and Expenses 2012-13 . . . 18
Creighton School Division #111
Box 158, Creighton, SK S0B 0A0 Phone: (306) 688-5825
Fax: (306) 688-3131
Website: www.creightonschooldivision.com E-mail: [email protected]
Letter of Transmittal
Honourable Dan Morgan Minister of Education Dear Minister Morgan,
The Board of Education of Creighton School Division #111 is pleased to provide you and the residents of the School Division with the 2012-13 annual report. This report outlines activities and accomplishments of the School Division and provides audited financial statements for the fiscal year September 1, 2012 to August 31, 2013.
Respectfully submitted
Janet Clark Chairperson
Highlights/Accomplishments for 2012-13
The following are significant division accomplishments for the 2012/2013 school:
1. Data Driven Decision Making
The processes of collecting assessment data on student achievement, and using that data to make instructional decisions has become embedded in the practices of the teachers in the division. Examples of that process this year include the data for the Canadian Achievement Test, and the data from the Tell Them From Me Survey. 2. First Nations Metis Education Achievement Plan
A three-year First Nations Metis Education Achievement plan (FNMEA) has been developed and submitted to the Ministry of Education. With the submission of this plan the Division will receive approximately $23,000.00 in funding to increase achievement of our FNM students. The goals identified in this plan include increased student engagement for our FNM students as identified by the Tell Them From Me Survey, and increased literacy levels of our FNM students so that they are achieving at grade level expectations.
3. Individual Achievement Account – Transition to Work
Creighton School Division has applied for and received funding to implement a
“Transition to Work Program” for our at risk students. The Division has received a total of $102,000.00 during the last two years to fund this program. The overall goal of this program is to assist vulnerable youth to stay in school, and to contribute to their local community by increasing their ability to manage their financial affairs, to gain
employment skills, and to assist with their post-secondary plans or the transition to work.
4. Tell Them From Me Survey
During this past year our Grade 4-12 students have participated in a perceptual survey that measures a variety of student achievement outcomes. This survey tool is an opportunity for students to have their voice heard, and the results of the survey are a strong indicator of student engagement in schooling. Highlights of the survey data this year indicated that students at Creighton Community School have a very high sense of belonging to their school, they value school outcomes, and they are intellectually engaged and find learning interesting. All of these scores for Creighton Community School were well-above Canadian norms.
5. Board Governance Policy Handbook
During the 2012/2013 school year, the Board of Creighton School Division #111 reviewed/revised all of their governance polices. A new school governance policy
Introduction
This annual report presents an overview of Creighton School Division’s activities and results for the fiscal year September 1, 2012 to August 31, 2013.
This annual report provides a snapshot of Creighton School Division, its governance structures, students, staff, programs and facilities. It also offers information regarding the Continuous Improvement & Accountability Framework priorities: higher literacy and achievement, equitable opportunities, smooth transitions, and system accountability and governance.
In addition to detailing the School Division’s activities and performance in implementing the CIAF, this report outlines the financial overview of the Division, its audited financial statements, and includes appendices such as an organizational chart and payee list.
Financial statements included in this report have been audited by an independent auditor following the Canadian Generally Accepted Auditing Standards.
School Division Profile
About Us
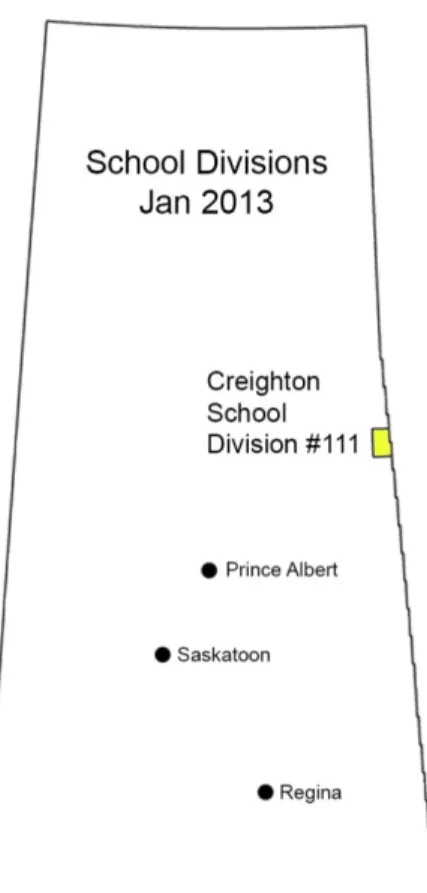
Creighton School Division #111 is a rural one-school division located in northeast Saskatchewan that
encompasses the communities of Creighton and Denare Beach. Included in the Denare Beach community is a small reserve that includes members of the Peter Ballantyne Cree Nation (PBCN). The map on the right shows the geographic location of Creighton School Division.
Division Mission Statement
Our mission is to work together to create a student centered environment that fosters healthy living, lifelong learning and responsible citizenship.
Division Vision Statement
Our Vision is that each student who enters our doors shall leave with abundant respect for self and others and the capability to meet the challenges of tomorrow.
Division Core Values and Beliefs
Every organization’s actions and decisions are guided by those things that its members value and believe. The Board of Education of the Creighton School Division #111 believes that:
• Each individual is unique and has significant intrinsic value and has significant value for our community and society.
• It is vital that society provides education that addresses the personal, physical, spiritual, emotional and intellectual needs of each person.
• Students’ current and future needs must be foremost in all decisions.
• Creative, proactive, visionary and accountable leadership provides the foundation for success.
• Collaboration and teamwork are effective, productive and desirable.
Positive relationships that empower students, parents, staff, administration, community members, partner organizations and other stakeholders are essential to meaningful education.
Program Overview
The students in Creighton School Division are diverse. They vary in age, personal circumstances, learning styles, interests, and individual strengths and needs. In order to provide the best education possible for all our students, Creighton School Division offers a wide range of programs in Creighton Community School.
Figure 1: Location of Creighton School Division
In addition, Creighton Community School offers specialized programming that responds to the needs of its students. The following list identifies programs in operation at the school:
• Alternative programming for vulnerable students
• Community School programming
• Core French instruction
• Music/band programming
• Practical Arts Programming
• Technology-enhanced learning
Given the size of the Division a limited number of specialized services and supports are offered to students and teachers:
• Learning Coach (.5)
• Educational Psychologist (one of the learning support teachers is the educational psychologist)
• Contracted Occupational Therapist (20 days)
• Contracted Speech& Language Pathologist (50 days)
• Student Counsellors (2.0 FTE)
First Nations and Métis Education – The Ministry of Education requires that each school division create a First Nations and Métis Education Plan that aligns with the Continuous Improvement and Accountability Framework. The highlights of Creighton School Division’s First Nations and Métis Education Plan appear below. The full plan is available at
http://creightonschooldivision.com/docs/FNMEA.pdf .
The full plan provides detailed information about performance measures, target outcomes, and instructional strategies.
Goal #1 – Equitable Outcomes
• By June 2016 our FNM students in Grades 4-12 will demonstrate student engagement levels similar to all students in our school.
• By June 2016 the literacy levels of our FNM students in Grades 1-3 will be at or above grade level. Goal #2 – Knowledge of First Nations and Métis Contributions
• By June 2016 Creighton School Division students will score at or above the provincial mean on the TULA Survey.
Goal #3 – Data Collection and Reporting
• By June 2016, the attendance of FNM students in Creighton School Division will at the 88% level in K-6, and at the 75% level in 7-12, as reported to Saskatchewan Education on the student data system.
• By June 2016 65% of all FNM students will complete high school within three years of starting Grade 10.
• By June 2016 the average number of credits earned per grade level for FNM students will be at the same level as our non-FNM students.
Goal #4 – Shared Management
School Division Planning
Creighton School Division #111 has a well-coordinated planning process which enables the alignment of School Division priorities with the Continuous Improvement and Accountability Framework (CIAF) priorities and alignment of all School Division planning activities. Since there is only one school in the division, Creighton Community School, it has been decided that the division CIAF will also serve as the Learning Improvement Plan for Creighton Community School.
Strategic Plan
Creighton School Division has never engaged in the development of a Strategic Plan. With only having one school in the division, the strategies outlined in the Continuous Improvement and Accountability Framework serves as the strategic plan for the division.
A copy of the 2012-2015 CIAF is available at http://creightonschooldivision.com/docs/cif-2012.pdf.
Continuous Improvement and Accountability Framework
The Continuous Improvement and Accountability Framework (CIAF) aligns School Division and CIAF priorities. The priority areas of the CIAF are:
1. Improve literacy and numeracy achievement for all students so that students in Creighton Community School achieve at provincial and national norms.
2. Enhance character education programming to improve students’ self-worth, citizenship skills and social development.
3. Establish structures and processes that foster meaningful, active and effective relationships with First Nations and Métis organizations and that promote positive First Nations relationships among
students, staff and parents.
4. Encourage parent/guardian involvement in the school system through engaging and encouraging the School Community Council.
The School Division in the Community
Creighton School Division is an integral part of community life in north east Saskatchewan.
Creighton Community School is linked to the broader community in a multitude of ways. The Board of Education places strong emphasis on community and parent involvement, and on community partnerships.
Community and Parent Involvement
Research has shown that students achieve at higher levels in school when their parents/guardians and other community members are involved in education. Creighton Community School has programs and initiatives to encourage community and parent involvement. For example, Creighton Community School is establishing a parents’ room where the coffee is always on and families are always welcome.
Creighton School Division believes in the importance of School Community Councils (SCCs) as a mechanism for connecting community and school. SCCs play a role in governance (described more fully in the next section) and most have established formal processes to foster community and parent involvement.
Community Partnerships
Interagency Meetings
Creighton School Division has a number of informal partnerships with community agencies that provide support and resources for programs at Creighton Community School. The school division coordinates a bi-monthly interagency meeting that includes representation from Kids First North, Flin Flon Friendship Center, Peter Ballantyne Cree Nation, Northern Sport
Recreation and Culture, Royal Canadian Mounted Police, Village of Denare Beach, Town of Creighton, Indian Child and Family Services, Child and Family Services, Mamawetan Churchill River Health Region, Ministry of Justice, and Creighton Alcohol and Drug Abuse Center. To facilitate the provision of wrap-around services by these multiple agencies, an interagency coordinator has been hired for the 2013/2014 school year. The funding for this position was obtained through the Community Initiatives Fund, but long term funding for the program will eventually need to be absorbed as a partnership between all the agencies. A review of the effectiveness of this position will be undertaken towards the end of the 2014/2014 school year. One of the goals for the school division is strengthen some of the informal partnerships by engaging in discussions with a number of community agencies that will lead to formal written partnership agreements.
Governance
The Board of Education provides governance for Creighton School Division as a whole and the School Community Council provides advice to Creighton Community School.
The Board of Education
Creighton School Division is governed by a six person elected Board of Education. The Education
Act, 1995 gives the Board of Education the authority to “administer and manage the educational affairs of the school division” and to “exercise general supervision and control over the schools in
Trustees are elected at large throughout the boundaries of the division except for the Denare Beach reserve. Once elected, the members of the Board of Education represent all students in the Division and are committed to providing the very best education possible for each and every student. The current Board of Education was elected on October 24, 2012 and will serve a four-year term. The Board of Education members are:
Board Chair Janet Clark
Board Vice-chair Ray Biberdorf PBCN Hermeline Fagnan Trustee Tracy Andrusiak Trustee Rhonda Werbicki
Trustee Heather Jacobsen (resigned from the Board on March 21, 2013)
When Heather Jacobsen resigned from the Board on March 21, 2013, a decision was made by the Board to reduce the number of trustees from six to five members.
A list of the remuneration paid to board members is provided in Appendix D.
Left to Right: Tracy Andrusiak, Janet Clark, Hermalene Fagnan, Rhonda Werbicki, Ray Biberdorf
School Community Councils
The Creighton School Community School is active in organizing a variety of activities for the school. The School Community Council includes representation from both parents and employees in the school. While there is a designated Peter Ballantyne Cree Nation representative on the Board, the School Community Council has not been successful in securing PBCN representation on the School Community Council. This past year the Creighton Community School has provided classroom space to the School Community Council to create a family room that will allow a variety of family
Our Students and Staff
The section that follows provides information about the Creighton School Division’s students and staff.
Students
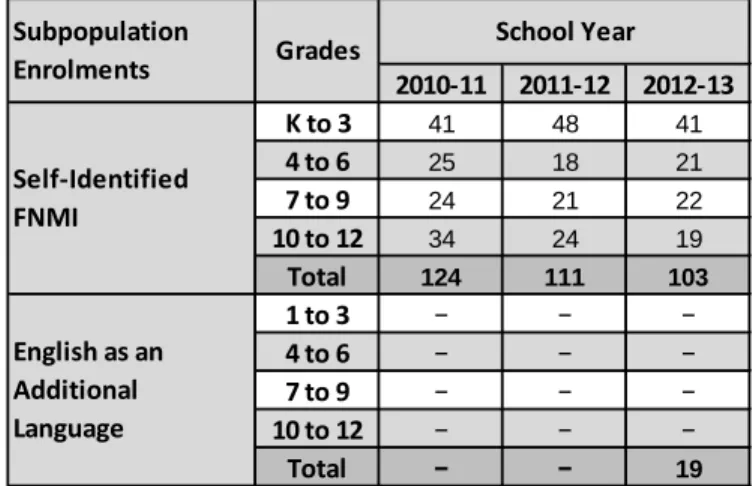
Figure 2: Enrolment by Grade – September 30
Note: The table above identifies the actual number of students enrolled in each grade as of September 30 of each year.
Note: The table above identifies the actual number of students enrolled in grade-level groupings as of September 30 of each year. Source: Ministry of Education, 2013 2010-11 2011-12 2012-13 Kindergarten 40 34 42 1 34 45 31 2 39 34 43 3 30 36 37 4 35 27 35 5 37 32 28 6 33 35 32 7 38 33 35 8 37 34 35 9 29 31 36 10 38 29 28 11 42 35 27 12 48 54 39 Total 480 459 448 PreK 32 37 32
Grade School Year 2010-11 2011-12 2012-13
K to 3 41 48 41 4 to 6 25 18 21 7 to 9 24 21 22 10 to 12 34 24 19 Total 124 111 103 1 to 3 − − − 4 to 6 − − − 7 to 9 − − − 10 to 12 − − − Total − − 19 Subpopulation Enrolments Grades School Year Self-Identified FNMI English as an Additional Language
Staff
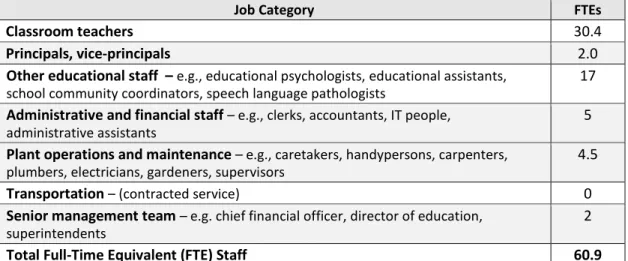
Figure 3 below provides an overview of all Division staff. An organizational chart showing the reporting structure is provided in Appendix B.
Figure 3: School Division Staff – 2012-13
Job Category FTEs
Classroom teachers 30.4
Principals, vice-principals 2.0
Other educational staff –e.g., educational psychologists, educational assistants,
school community coordinators, speech language pathologists 17
Administrative and financial staff– e.g., clerks, accountants, IT people,
administrative assistants 5
Plant operations and maintenance– e.g., caretakers, handypersons, carpenters,
plumbers, electricians, gardeners, supervisors 4.5
Transportation– (contracted service) 0
Senior management team – e.g. chief financial officer, director of education,
superintendents 2
Total Full-Time Equivalent (FTE) Staff 60.9
Notes: •The number of employees listed above represents full-time equivalents (FTEs). The actual number of employees is greater because some people work part-time or seasonally.
•Some individuals are counted in more than one category. For example, a teaching principal might be counted 0.4 as a classroom teacher and 0.6 as a principal.
•Information for all staff is at September 1, 2013.
Staff Profile – Creighton School Division is the fifth largest employer in the Creighton/Flin
Flon/Denare Beach area and makes a significant contribution to the regional economy. The Division employs the full-time equivalent of 61.0 people. About 53% of these employees are teachers, the other 47% represent a wide range of occupations. The School Division needs educational assistants, clerical staff, information technology (IT) people, caretakers, bus drivers, accountants and other staff in order to provide a quality education for students of the Division.
Senior Management Team – The Director of Education, Bob Smith, and the Secretary-Treasurer, Sheola Jansen report directly to the Board of Education.
Higher Literacy and Achievement
Increased student literacy and achievement is a priority for Creighton School Division. The indicators below illustrate student performance as informed by Division and provincial data.
Grade 12 Graduation
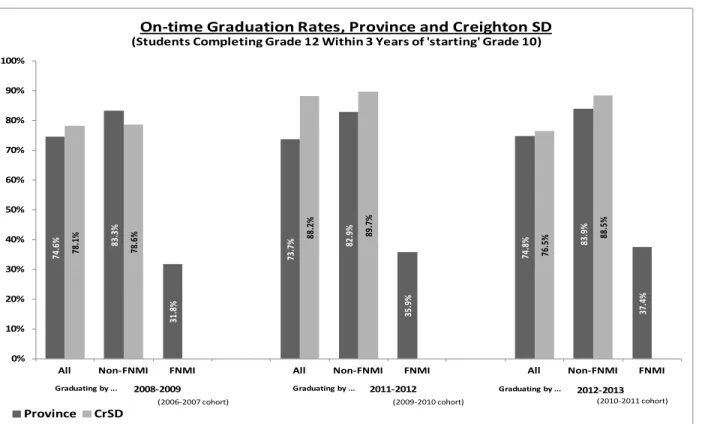
Three-Year Graduation Rates – In June 2012, 88% of all Creighton School Division students graduated within three years of entering Grade 10. A comparison with the June 2009 year shows that Creighton’s overall graduation rate has been increasing during that time. However, in June 2013 the percentage of students graduating within three years has dropped to 77%. However, there is a significant difference between the graduation rate for FNM students and non-FNM students. Reducing this difference is one of the Division’s most important goals. See Figure 4.
Figure 4: Grade 12 Graduation – Students Completing Grade 12 Within Three Years: Baseline Year with Two Most Recent Years
Note:
On-time graduation rates are calculated as the percentage of students who complete Grade 12 within 3 years of ‘starting’ Grade 10. Results for populations of 10 or fewer have not been reported to avoid identifying individuals or very small groups of students. FNMI students are those who choose to self-identify as First Nations (Registered/Treaty/Status Indian, Non-Status Indian), Métis, or Inuit/Inuk. Non-FNMI students are those who do not identify themselves to be FNMI, and may include FNMI students who choose not to self-identify.
Source: Ministry of Education, 2013
Note: Significant fluctuations in data for Creighton School Division can occur when a single student does not graduate because of the small population size.
74 .6 % 83.3% 31 .8 % 73 .7 % 82.9 % 35 .9 % 74 .8 % 83.9 % 37 .4 % 78 .1 % 78 .6 % 88.2 % 89 .7 % 76 .5 % 88.5 % 0% 10% 20% 30% 40% 50% 60% 70% 80% 90% 100%
All Non-FNMI FNMI All Non-FNMI FNMI All Non-FNMI FNMI
Province CrSD
(Students Completing Grade 12 Within 3 Years of 'starting' Grade 10)On-time Graduation Rates, Province and Creighton SD
Graduating by ... Graduating by ... Graduating by ...
(2006-2007 cohort) (2009-2010 cohort) (2010-2011 cohort)
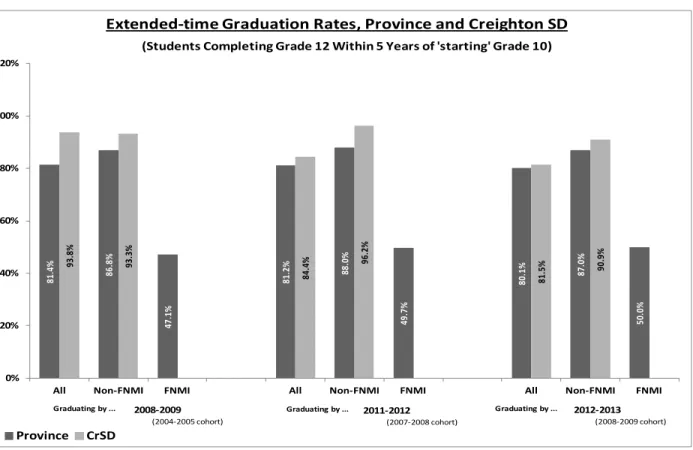
Five-Year Graduation Rates – Some students need more time to complete all the courses
necessary to graduate, and so they continue in school longer than three years after beginning Grade
10. The graduation rate increases when these extra years of schooling are considered. In June
2009, 94% of all Creighton School Division students who had entered Grade 10 five years previously had
graduated. While still above the provincial average, our five year graduation rate declines to 82% by
June 2013. Because our FNM population is low, the data for the FNM graduation rate is not reported.
Figure 5: Grade 12 Graduation – Students Completing Grade 12 Within Five Years: Baseline Year with Two Most Recent Years
Note:
Extended-time graduation rates are calculated as the percentage of students who complete Grade 12 within 5 years of ‘starting’ Grade 10 (and include those who graduate on-time).
Results for populations of 10 or fewer have not been reported to avoid identifying individuals or very small groups of students. FNMI students are those who choose to self-identify as First Nations
(Registered/Treaty/Status Indian, Non-Status Indian), Métis, or Inuit/Inuk. Non-FNMI students are those who do not identify themselves to be FNMI, and may include FNMI students who choose not to self-identify. Source: Ministry of Education, 2013
Note: Significant fluctuations in data for Creighton School Division can occur when a single student does not graduate because of the small population size.
81 .4 % 86 .8 % 47 .1 % 81 .2 % 88.0% 49 .7 % 80 .1 % 87.0% 50 .0 % 93 .8 % 93 .3 % 84 .4 % 96.2 % 81 .5 % 90.9% 0% 20% 40% 60% 80% 100% 120%
All Non-FNMI FNMI All Non-FNMI FNMI All Non-FNMI FNMI
Province CrSD
(Students Completing Grade 12 Within 5 Years of 'starting' Grade 10)
Extended-time Graduation Rates, Province and Creighton SD
Graduating by ...
(2004-2005 cohort)
Graduating by ... Graduating by ...
(2007-2008 cohort) (2008-2009 cohort)
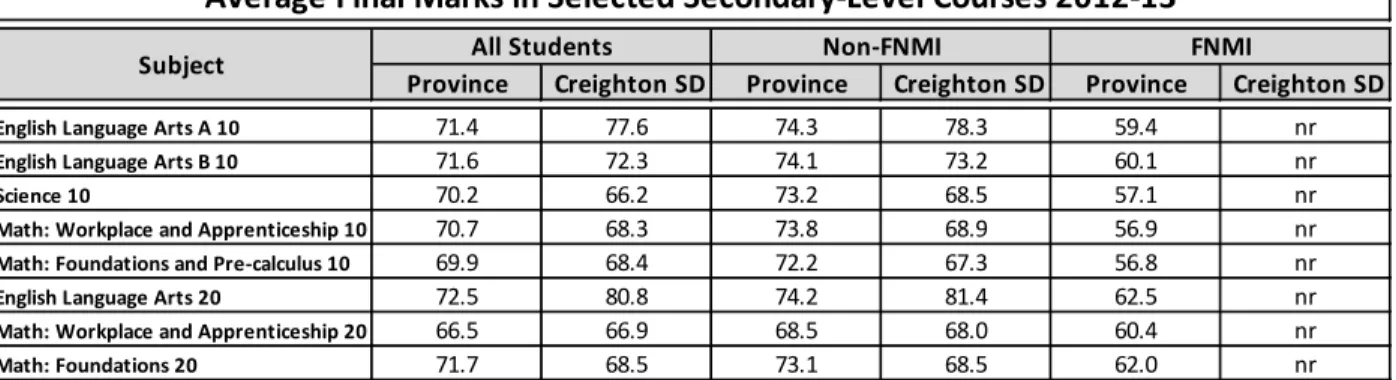
Average Final Marks
When registering for secondary level courses, students have many opportunities for choice. In 2012-13, the average final marks for all Creighton School Division students were equal to or exceeded the provincial results in English Language Arts 10, English Language Arts 20 and Math Workplace and Apprenticeship 20. The average final marks for Creighton School Division students were below the provincial results in Science 10, Math Workplace and Apprenticeship 10, Math Foundations and Pre-calculus 10 and Math Foundations 20.
The results for the FNMI students cannot be published because fewer than 10 students were in each of these classes.
See Figure 6.
Figure 6: Average Final Marks in Selected Secondary-Level Courses
Note:
Results for populations of 10 or fewer have not been reported to avoid identifying individuals or very small groups of students (nr). FNMI students are those who choose to self-identify as First Nations
(Registered/Treaty/Status Indian, Non-Status Indian), Métis, or Inuit/Inuk. Non-FNMI students are those who do not identify themselves to be FNMI, and may include FNMI students who choose not to self-identify. Source: Ministry of Education, 2013
Province Creighton SD Province Creighton SD Province Creighton SD
English Language Arts A 10 71.4 77.6 74.3 78.3 59.4 nr
English Language Arts B 10 71.6 72.3 74.1 73.2 60.1 nr
Science 10 70.2 66.2 73.2 68.5 57.1 nr
Math: Workplace and Apprenticeship 10 70.7 68.3 73.8 68.9 56.9 nr
Math: Foundations and Pre-calculus 10 69.9 68.4 72.2 67.3 56.8 nr
English Language Arts 20 72.5 80.8 74.2 81.4 62.5 nr
Math: Workplace and Apprenticeship 20 66.5 66.9 68.5 68.0 60.4 nr
Math: Foundations 20 71.7 68.5 73.1 68.5 62.0 nr
Average Final Marks in Selected Secondary-Level Courses 2012-13
Equitable Opportunities
Strategies to Meet the Needs of Diverse Students
Creighton School Division strives to provide the best education possible for all its students.
Creighton Community School offers programming that responds to the needs of its students such as: Prekindergarten and alternative programming for vulnerable students; distance education; services and supports of educational psychologists and speech and language pathologists. In addition Creighton School Division provides outreach programming for Peter Ballantyne Cree Nation students at the band office two nights a week. These programs and supports are intended to provide
equitable opportunities for equitable outcomes for all students.
Smooth Transitions
Grade 7 to 10 Transitions
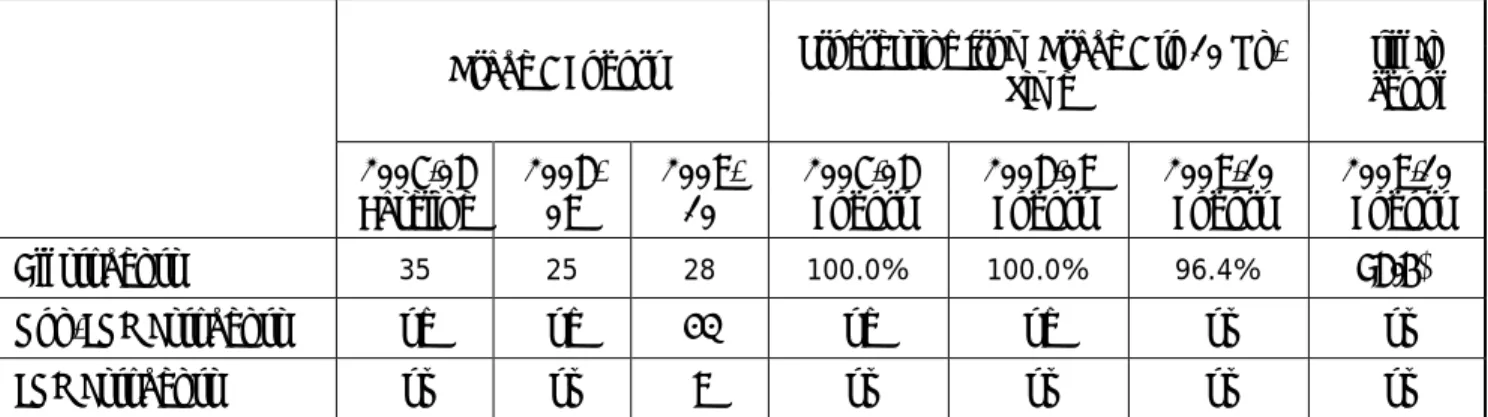
There are several critical transition points as students move through the Prekindergarten to Grade 12 education system. The transition from middle to secondary grades is particularly important. Figure 8 below shows that all of Creighton School Division students, including our FNM students, who began Grade 7 in 2008/2009 are still in school three years later. See Figure 7.
Figure 7: Student Transitions Between Grades 7 and 10, Creighton School Division
Grade 7 Cohort Progressing from Grade 7 to 10 On-Time School Still In 2007-08
Baseline 2008-09 2009-10 2007-08 Cohort 2008-09 Cohort 2009-10 Cohort 2009-10 Cohort
All students 35 25 28 100.0% 100.0% 96.4% 96.4%
Non-FNMI students na na 21 na na nr nr
FNMI students nr nr 7 nr nr nr nr
Note:
Students who have not progressed to Grade 10 “on-time” may have remained in a previous grade or were not re-enrolled in subsequent years. “Still in School” is the proportion of students either in Grade 10 or continuing a previous grade. Results for populations of 10 or fewer have not been reported to avoid identifying individuals or very small groups of students (nr). Categories where results are not available at this time are recorded as (na).
FNMI students are those who choose to self-identify as First Nations (Registered/Treaty/Status Indian, Non-Status Indian), Métis, or Inuit/Inuk. Non-FNMI students are those who do not identify themselves to be FNMI, and may include FNMI students who choose not to self-identify.
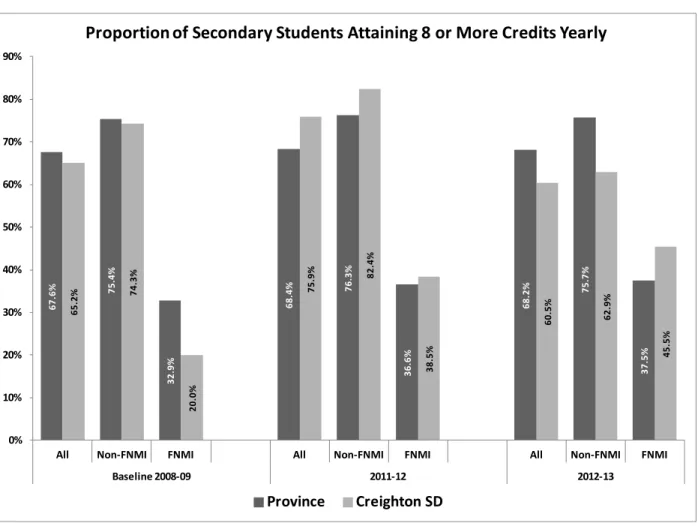
Credit Attainment
Saskatchewan secondary students must accumulate at least 24 secondary-level credits in order to graduate. This means that to graduate within a three-year period after beginning Grade 10,
students must accumulate at least eight credits per year. In recent years, the provincial results have been relatively stable at just under 68% of all students attaining 8 or more credits per year.
In 2011-12 a greater percent of Creighton students earned more than eight credits than the
provincial average. In 2012-13 the percentage of Creighton students earning more than eight credits was less than the provincial average. However, the percentage of FNMI students earning more than eight credits was slightly greater than the provincial average in both years. See Figure 8. The school division will be reviewing and monitoring its programming practices to ensure that all students are earning enough credits to graduate in a three year period.
Figure 8: Proportion of Secondary Students Attaining 8 or More Credits Yearly
Note:
Results for populations of 10 or fewer have not been reported to avoid identifying individuals or very small groups of students. FNMI students are those who choose to self-identify as First Nations
(Registered/Treaty/Status Indian, Non-Status Indian), Métis, or Inuit/Inuk. Non-FNMI students are those who do not identify themselves to be FNMI, and may include FNMI students who choose not to self-identify. Source: Ministry of Education, 2013
Note: Significant fluctuations in data for Creighton School Division can occur when a one or two students do not earn eight credits due to the small population size.
67 .6 % 75.4 % 32 .9 % 68 .4 % 76.3 % 36 .6 % 68 .2 % 75.7 % 37 .5 % 65 .2 % 74.3 % 20 .0 % 75 .9 % 82.4 % 38 .5 % 60 .5 % 62 .9 % 45 .5 % 0% 10% 20% 30% 40% 50% 60% 70% 80% 90%
All Non-FNMI FNMI All Non-FNMI FNMI All Non-FNMI FNMI
Baseline 2008-09 2011-12 2012-13
Proportion of Secondary Students Attaining 8 or More Credits Yearly
System Accountability and Governance
Creighton School Division is committed to operational effectiveness, transparency and fiscal responsibility and to the long-term stability of the education system in order to provide a high quality education for all students.
School Community Councils and Learning Improvement Plans
School Community Councils (SCCs) are required by legislation to cooperate with school staff to develop a school Learning Improvement Plan that is in accordance with the school division’s Continuous Improvement and Accountability Plan. However, since there is only one school in the division it was decided that the Division CIAF would be the School Learning Improvement Plan. The involvement of the School Community Council in the development of the Division Continuous Improvement and Accountability Framework has been relatively limited.
Facilities and Transportation
Facilities – Creighton Community School
Creighton School Division pays careful attention to the maintenance of Creighton Community School. The division only has one full time maintenance employee; however the day custodian assists with minor maintenance projects. Major repairs of any kind often require outside
contracted services. The school is cleaned every day and major cleaning such the waxing of floors, the washing of walls, and the cleaning of shelving takes place during the summer break. A four-year preventative maintenance and renewal plan has been developed and approved by the Board.
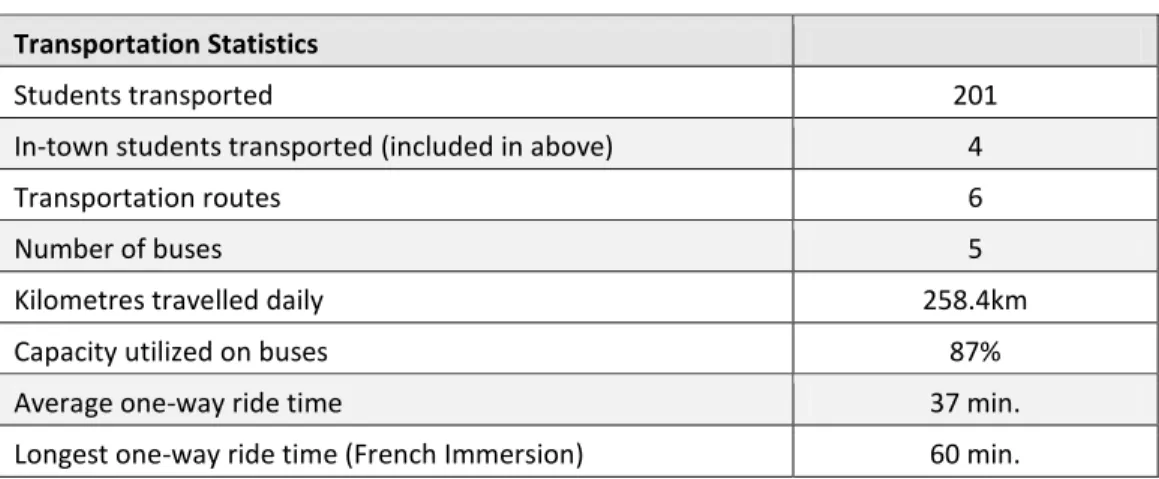
Student Transportation
Much of Creighton School Division is rural, so a significant number of students are transported to school from Denare Beach. A few Creighton town students are transported as well, when the distance between school and home is too great to walk.
The School Division has contracted with First Student Canada to provide transportation for students.
Figure 10: Student Transportation 2012-13 Transportation Statistics
Students transported 201
In-town students transported (included in above) 4
Transportation routes 6
Number of buses 5
Kilometres travelled daily 258.4km
Capacity utilized on buses 87%
Average one-way ride time 37 min.
Longest one-way ride time (French Immersion) 60 min.
Creighton School Division contracts out the daily transportation of students to school each day. Denare Beach is a nearby community that is 18 km from
Creighton and some division students attend French Immersion in nearby Flin Flon, Manitoba. Creighton owns a mini-bus and a van that in total travels about 45,000 km a year transporting students to a variety of sporting and school events. Special needs transportation is also a contracted service and some costs are shared with the Flin Flon School Division.
Revenue 2012 - 2013
Property Taxation Ministry Grants
Tuition and Related Fees School Generated Funds Other Revenue
Expenditures 2012 - 2013
Governance Administration Instruction Plant Operation & Maintenance Pupil Transportation School Generated Funds Payments to Other
Financial Overview
In 2012-13, as in previous years, Creighton School Division’s single largest expense was instruction. Instruction includes salaries and benefits for teachers and other staff who work with students, resource materials and classroom supplies. The second largest expense was Plant Operations and Maintenance
The largest single source of revenue was ministry grants, followed by property taxes.
Revenue and Expenses
Figure 10 below summarizes Creighton School Division’s main categories of revenues and expenditures in 2012-13.
Budget to Actual Expenditures
Budget to Budget to
2012 2013 2013 Actual Actual %
Actual Actual Budget Over / (Under) Variance Variance Note REVENUES
Property Taxation 1,022,264 993,134 1,035,698 (42,564) -4% Grants 4,939,338 4,909,047 4,685,346 223,701 5% Tuition and Related Fees 506,508 492,601 480,622 11,979 2% School Generated Funds 158,421 85,698 65,500 20,198 31% 1 Complementary Services* - 126,608 126,608 - - External Services** - - - - - Other 158,475 179,064 120,500 58,564 49% 2 Total Revenues 6,785,006 6,786,152 6,514,274 271,878 4% EXPENSES Governance 129,133 114,022 123,206 (9,184) -7% 3 Administration 191,744 212,597 248,904 (36,307) -15% 4 Instruction 4,583,254 4,457,469 4,581,079 (123,610) -3% Plant 710,010 762,746 723,174 39,572 5% Transportation 372,939 414,889 433,902 (19,013) -4% Tuition and Related Fees 169,085 163,367 153,238 10,129 7% 5 School Generated Funds 153,537 100,608 65,500 35,108 54% 6 Complementary Services* - 115,940 126,608 (10,668) -8% 7 External Services** - - - - - Other Expenses 8,044 26,049 58,663 (32,614) -55% 8
Total Expenses 6,317,746 6,367,687 6,514,274 (146,587) -2%
Surplus (Deficit) for the Year 467,260 418,465 - - -
* Complementary services are services and programs where the primary purpose is other than K-12 learning/learning support, but which have the specific objective of enhancing the School Division’s ability to successfully deliver its K-12 curriculum/learning programs. For example, Prekindergarten and nutrition programs.
** External services are services and programs that are outside of the School Division’s learning/learning support and complementary programs. These services have no direct link to the delivery of the School Division’s K-12 program nor do they directly enhance the School Division’s ability to deliver its K-12 programs. For example, fees paid to the School Division to or on behalf of its associate schools.
Explanation for Variances
1 More school generated funds were received than anticipated. The offset to this increase can be found in the School Generated Funds expense (Note 6). 2 More grant money was received than anticipated. The offset to this increase can be found in Other Expenses (Note 8).
3 One board member resigned and was not replaced. 4 Administration salaries were less than anticipated.
5 We had more students attend Flin Flon School Division for the French Immersion Program than anticipated. 6 See note 1.
7 Salaries were lower than anticipated. 8 See note 2
… page 2
2013 2013 2012
Budget Actual Actual
REVENUES (Note 14)
Property Taxation 1,035,698 993,134 1,022,264
Grants 4,685,346 4,909,047 4,939,338
Tuition and Related Fees 480,622 492,601 506,508
School Generated Funds 65,500 85,698 158,421
Complementary Services (Note 12) 126,608 126,608
-Other 120,500 179,064 158,475
Total Revenues (Schedule A) 6,514,274 6,786,152 6,785,006
EXPENSES Governance 123,206 114,022 129,133 Administration 248,904 212,597 191,744 Instruction 4,581,079 4,457,469 4,583,254 Plant 723,174 762,746 710,010 Transportation 433,902 414,889 372,939
Tuition and Related Fees 153,238 163,367 169,085
School Generated Funds 65,500 100,608 153,537
Complementary Services (Note 12) 126,608 115,940
-Other Expenses 58,663 26,049 8,044
Total Expenses (Schedule B) 6,514,274 6,367,687 6,317,746
Operating Surplus for the Year - 418,465 467,260
Accumulated Surplus from Operations, Beginning of Year 5,168,524 5,168,524 4,701,264 Accumulated Surplus from Operations, End of Year 5,168,524 5,586,989 5,168,524
The accompanying notes and schedules are an integral part of these statements
CREIGHTON SCHOOL DIVISION NO. 111
Statement of Operations and Accumulated Surplus from Operations for the year ended August 31, 2013
… page 3
2013 2013 2012
Budget Actual Actual
(Note 14)
Net Financial Assets, Beginning of Year 1,062,043 1,062,043 641,973
Changes During the Year:
Operating Surplus for the Year - 418,465 467,260
Acquisition of Tangible Capital Assets (Schedule C) (93,500) (276,871) (252,448) Amortization of Tangible Capital Assets (Schedule C) 195,902 214,902 205,972 Net Acquisition of Inventory of Supplies - 1,308 872 Net Change in Other Non-Financial Assets - (569) (1,587)
Change in Net Financial Assets 102,402 357,235 420,070
Net Financial Assets, End of Year 1,164,445 1,419,278 1,062,043
The accompanying notes and schedules are an integral part of these statements
CREIGHTON SCHOOL DIVISION NO. 111
Statement of Changes in Net Financial Assets for the year ended August 31, 2013
… page 4
2013 2012
OPERATING ACTIVITIES
Operating Surplus for the Year 418,465 467,260
Add Non-Cash Items Included in Surplus (Schedule D) 214,902 205,972
Net Change in Non-Cash Operating Activities (Schedule E) 200,254 (88,342)
Cash Provided by Operating Activities 833,621 584,890
CAPITAL ACTIVITIES
Cash Used to Acquire Tangible Capital Assets (276,871) (252,448)
Cash (Used) by Capital Activities (276,871) (252,448)
INVESTING ACTIVITIES
Cash Used to Acquire Portfolio Investments (578) (92,869)
Cash (Used) by Investing Activities (578) (92,869)
FINANCING ACTIVITIES
Proceeds from Issuance of Long Term Debt 578 88,869
Repayment of Long Term Debt (52,699) (50,685)
Cash Provided (Used) by Financing Activities (52,121) 38,184
INCREASE IN CASH AND CASH EQUIVALENTS 504,050 277,758
CASH AND CASH EQUIVALENTS, BEGINNING OF YEAR 1,322,634 1,044,876
CASH AND CASH EQUIVALENTS, END OF YEAR 1,826,684 1,322,634
REPRESENTED ON THE FINANCIAL STATEMENTS BY:
Cash and Cash Equivalents 1,826,684 1,322,634
CASH AND CASH EQUIVALENTS, END OF YEAR 1,826,684 1,322,634
The accompanying notes and schedules are an integral part of these statements
CREIGHTON SCHOOL DIVISION NO. 111 Statement of Cash Flows
A-1
2013 2013 2012
Budget Actual Actual
Property Taxation Revenue Tax Levy Revenue:
Property Tax Levy Revenue 1,035,698 963,378 1,064,322
Total Property Tax Revenue 1,035,698 963,378 1,064,322
Grants in Lieu of Taxes:
Federal Government - 7,077 8,503
Provincial Government - 13,535 8,248
Total Grants in Lieu of Taxes - 20,612 16,751
Other Tax Revenues:
House Trailer Fees - 6,899 8,239
Total Other Tax Revenues - 6,899 8,239
Additions to Levy:
Penalties - 18,126 21,525
Total Additions to Levy - 18,126 21,525
Deletions from Levy:
Discounts - (8,016) (54,221)
Cancellations - (7,865) (34,352)
Total Deletions from Levy - (15,881) (88,573)
Total Property Taxation Revenue 1,035,698 993,134 1,022,264
Grants:
Operating Grants
Ministry of Education Grants:
K-12 Operating Grant 4,685,346 4,725,282 4,672,976
Other Ministry Grants - 44,681 181,408
Total Ministry Grants 4,685,346 4,769,963 4,854,384
Other Provincial Grants - 25,145 23,501
Total Operating Grants 4,685,346 4,795,108 4,877,885
Capital Grants
Ministry of Education Capital Grants - 113,939 61,453
Total Capital Grants - 113,939 61,453
Total Grants 4,685,346 4,909,047 4,939,338
CREIGHTON SCHOOL DIVISION NO. 111
Schedule A: Supplementary Details of Revenue for the year ended August 31, 2013
A-2
2013 2013 2012
Budget Actual Actual
Tuition and Related Fees Revenue Operating Fees:
Tuition Fees:
Federal Government and First Nations 441,322 443,295 454,647
Total Tuition Fees 441,322 443,295 454,647
Transportation Fees 33,000 43,006 45,561
Other Related Fees 6,300 6,300 6,300
Total Operating Tuition and Related Fees 480,622 492,601 506,508
Total Tuition and Related Fees Revenue 480,622 492,601 506,508
School Generated Funds Revenue Curricular Fees:
Student Fees - 7,502 18,935
Total Curricular Fees - 7,502 18,935
Non-Curricular Fees:
Fundraising 65,500 78,196 139,486
Total Non-Curricular Fees 65,500 78,196 139,486
Total School Generated Funds Revenue 65,500 85,698 158,421
Complementary Services Operating Grants:
Ministry of Education Operating Grants:
Ministry of Education-Foundation Operating Grant 126,608 126,608
-Total Operating Grants 126,608 126,608
-Total Complementary Services Revenue 126,608 126,608
-Other Revenue
Miscellaneous Revenue 116,000 166,155 151,364
Sales & Rentals - - 50
Investments 4,500 12,909 7,061
Total Other Revenue 120,500 179,064 158,475
TOTAL REVENUE FOR THE YEAR 6,514,274 6,786,152 6,785,006
Schedule A: Supplementary Details of Revenue for the year ended August 31, 2013
B-1
2013 2013 2012
Budget Actual Actual
Governance Expense
Board Members Expense 60,980 54,693 63,111
Professional Development- Board Members 16,000 9,614 15,284
Advisory Committees 3,000 3,000 6,000
Elections 1,926 908
-Other Governance Expenses 41,300 45,807 44,738
Total Governance Expense 123,206 114,022 129,133
Administration Expense
Salaries 169,595 114,886 112,548
Benefits 44,394 50,221 39,378
Supplies & Services 16,300 28,223 20,719
Non-Capital Furniture & Equipment 1,500 1,473 291
Communications 7,600 7,731 8,123
Travel 8,315 8,585 8,832
Professional Development 1,200 400 775
Amortization of Tangible Capital Assets - 1,078 1,078
Total Administration Expense 248,904 212,597 191,744
Instruction Expense
Instructional (Teacher & LEADS Contract) Salaries 2,816,771 2,681,865 2,858,285 Instructional (Teacher & LEADS Contract) Benefits 131,687 136,286 141,689 Program Support (Non-Teacher Contract) Salaries 920,677 924,856 885,822 Program Support (Non-Teacher Contract) Benefits 201,412 211,314 188,876
Instructional Aids 160,700 169,234 170,413
Supplies & Services 72,582 94,353 104,441
Non-Capital Furniture & Equipment 56,553 31,663 35,299
Communications 14,600 14,630 15,699
Travel 22,730 4,355 4,355
Professional Development 51,500 50,182 41,791
Student Related Expense 67,100 69,797 71,251
Amortization of Tangible Capital Assets 64,767 68,934 65,333
Total Instruction Expense 4,581,079 4,457,469 4,583,254
CREIGHTON SCHOOL DIVISION NO. 111 Schedule B: Supplementary Details of Expenses
B-2
2013 2013 2012
Budget Actual Actual
Plant Operation & Maintenance Expense
Salaries 237,581 226,010 240,757
Benefits 53,745 51,684 50,548
Non-Capital Furniture & Equipment 2,500 1,147 1,838
Building Operating Expenses 302,633 344,355 282,559
Communications 1,400 483 567
Travel 815 813 815
Amortization of Tangible Capital Assets 124,500 138,254 132,926
Total Plant Operation & Maintenance Expense 723,174 762,746 710,010 Student Transportation Expense
Supplies & Services 64,417 73,010 74,004
Non-Capital Furniture & Equipment 4,500 6,374
-Travel 11,600 -
-Contracted Transportation 346,750 328,870 292,300
Amortization of Tangible Capital Assets 6,635 6,635 6,635
Total Student Transportation Expense 433,902 414,889 372,939
Tuition and Related Fees Expense
Tuition Fees 153,238 163,367 169,085
Total Tuition and Related Fees Expense 153,238 163,367 169,085
School Generated Funds Expense
Supplies & Services 14,000 10,090 17,589
Special Programs 51,500 90,518 135,948
Total School Generated Funds Expense 65,500 100,608 153,537
CREIGHTON SCHOOL DIVISION NO. 111 Schedule B: Supplementary Details of Expenses
B-3
2013 2013 2012
Budget Actual Actual
Complementary Services Expense
Instructional (Teacher & LEADS Contract) Salaries & Benefits 90,158 81,012 -Program Support (Non-Teacher Contract) Salaries & Benefits 30,500 28,978 -Plant Operation & Maintenance Salaries & Benefits 4,950 4,950
-Instructional Aids 1,000 1,000
-Total Complementary Services Expense 126,608 115,940
-Other Expense
Interest and Bank Charges:
Current Interest and Bank Charges 805 5,951 8,044
Interest on Other Capital Loans and Long Term Debt
School Facilities 52,663 -
-Other 5,195 -
-Total Interest and Bank Charges 58,663 5,951 8,044
Provision for Uncollectable Taxes - 20,098
-Total Other Expense 58,663 26,049 8,044
TOTAL EXPENSES FOR THE YEAR 6,514,274 6,367,687 6,317,746
for the year ended August 31, 2013 Schedule B: Supplementary Details of Expenses CREIGHTON SCHOOL DIVISION NO. 111
CREIGHTON SCHOOL DIVISION NO. 111
Schedule C - Supplementary Details of Tangible Capital Assets for the year ended August 31, 2013
Furniture Computer
Land Buildings School Other and Hardware and Computer
Land Improvements Buildings Short term Buses Vehicles Equipment Audio Equipment Software 2013 2012
Tangible Capital Assets - at Cost:
Opening Balance as of September 1 101,084 501,705 6,638,652 111,093 79,621 33,818 1,510,876 219,987 31,987 9,228,823 8,976,375 Additions/Purchases - - 163,874 - - - 59,957 53,040 - 276,871 252,448 Closing Balance as of August 31 101,084 501,705 6,802,526 111,093 79,621 33,818 1,570,833 273,027 31,987 9,505,694 9,228,823
Tangible Capital Assets - Amortization:
Opening Balance as of September 1 - 453,485 3,197,897 29,040 26,540 33,818 1,298,794 132,575 2,637 5,174,786 4,968,814 Amortization of the Period - 3,226 129,473 5,555 6,635 - 46,867 23,146 - 214,902 205,972 Closing Balance as of August 31 N/A 456,711 3,327,370 34,595 33,175 33,818 1,345,661 155,721 2,637 5,389,688 5,174,786 Net Book Value:
Opening Balance as of September 1 101,084 48,220 3,440,755 82,053 53,081 - 212,082 87,412 29,350 4,054,036 4,007,561 Closing Balance as of August 31 101,084 44,994 3,475,156 76,498 46,446 - 225,172 117,306 29,350 4,116,006 4,054,036 Change in Net Book Value - (3,226) 34,401 (5,555) (6,635) - 13,090 29,894 - 61,969 46,475
2013 2012 Non-Cash Items Included in Surplus:
Amortization of Tangible Capital Assets (Schedule C) 214,902 205,972
Total Non-Cash Items Included in Surplus 214,902 205,972
2013 2012
Net Change in Non-Cash Operating Activities:
Decrease in Accounts Receivable 135,860 138,127
Increase (Decrease) in Provincial Grant Overpayment (59,887) 59,887 Increase (Decrease) In Accounts Payable and Accrued Liabilities 99,074 (322,411) Increase (Decrease) in Liability for Employee Future Benefits (6,200) 16,200
Increase in Deferred Revenue 30,667 20,570
Decrease in Inventory of Supplies for Consumption 1,308 872
(Increase) in Prepaid Expenses (569) (1,587)
Total Net Change in Non-Cash Operating Activities 200,254 (88,342) Schedule E: Net Change in Non-Cash Operating Activities
for the year ended August 31, 2013 CREIGHTON SCHOOL DIVISION NO. 111 Schedule D: Non-Cash Items Included in Surplus
for the year ended August 31, 2013
CREIGHTON SCHOOL DIVISION NO. 111 NOTES TO THE FINANCIAL STATEMENTS
As at August 31, 2013
1. AUTHORITY AND PURPOSE
The school division operates under the authority of The Education Act, 1995 of Saskatchewan as a corporation under the name of “The Board of Education of the Creighton School Division No. 111” and operates as “the Creighton School Division No. 111”. The school division provides education services to residents within its geographic region and is governed by an elected board of trustees.
The school division is funded mainly by grants from the Government of Saskatchewan and a levy on the property assessment included in the school division’s boundaries at mill rates determined by the provincial government. The school division is exempt from income tax and is a registered charity under the
Income Tax Act.
2. SIGNIFICANT ACCOUNTING POLICIES
These financial statements have been prepared in accordance with Canadian public sector accounting standards for other government organizations as established by the Public Sector Accounting Board (PSAB) and as published by the Canadian Institute of Chartered Accountants (CICA).
Significant aspects of the accounting policies adopted by the school division are as follows:
a) Adoption of New Public Sector Accounting (PSA) Standards
In 2013, the school division adopted the new PSA standards PS1201 Financial Statement Presentation, PS2601 Foreign Currency Translation, PS3041 Portfolio Investments, PS3410 Government Transfers and PS3450 Financial Instruments.
Detailed information on the impact of the adoption of these new PSA standards is provided in Note 18 Accounting Changes.
b) Reporting Entity
The financial statements include all of the assets, liabilities, revenues and expenses of the school division reporting entity.
As trustee, the school division merely administers the terms and conditions embodied in the agreement and has no unilateral authority to change the conditions set out in the trust indenture.
Trust funds are not included in the financial statements as they are not controlled by the school division.
d) Basis of Accounting
The financial statements are prepared using the accrual basis of accounting. The accrual basis of accounting recognizes revenues as they are earned and measurable; expenses are recognized as they are incurred and measurable as a result of the receipt of goods or services and the creation of a legal obligation to pay. Expenses also include the amortization of tangible capital assets.
e) Measurement Uncertainty and the Use of Estimates
The preparation of financial statements in conformity with Canadian public sector accounting standards requires management to make estimates and assumptions that affect the reported amount of assets and liabilities and disclosure of contingent assets and liabilities at the date of the financial
statements, and the reported amounts of revenues and expenses during the year. Measurement uncertainty that may be material to these financial statements exists for:
• the liability for employee future benefits of $ 276,200 (2012 - $282,400 ) because actual experience may differ significantly from actuarial
estimations.
• property taxation revenue of $ 993,135 (2012 - $ 1,022,264) because final tax assessments may differ from initial estimates,
• uncollectible taxes of $ 109,236 (2012 - $89,138 ) because actual collectability may differ from initial estimates.
• useful lives of capital assets and related amortization for all assets (referred to in note 2h) are based on best estimates and are subject to measurement uncertainty.
• prior years tangible capital asset historical costs and related amortization for all assets (referred to in note 2h) are based on best estimates and are subject to measurement uncertainty.
These estimates and assumptions are reviewed periodically and, as adjustments become necessary, they are reported in earnings in the periods in which they become known.
While best estimates are used for reporting items subject to measurement uncertainty, it is reasonably possible that changes in future conditions,
f) Financial Instruments
Financial instruments are any contracts that give rise to financial assets of one entity and financial liabilities or equity instruments of another entity. A contract establishing a financial instrument creates, at its inception, rights and
obligations to receive or deliver economic benefits. The school division recognizes a financial instrument when it becomes a party to a financial
instrument. The financial assets and financial liabilities portray these rights and obligations in financial statements. Financial instruments of the school division include cash and cash equivalents, accounts receivable, portfolio investments, accrued salaries and benefits, accounts payable and accrued liabilities and long term debt.
Financial instruments are assigned to one of two measurement categories: fair value, or cost or amortized cost.
i) Fair Value
Fair value measurement applies to portfolio investments in equity
instruments that are quoted in an active market. Any associated transaction costs are expensed upon initial recognition. Unrealized changes in fair value are recognized in the statement of remeasurement gains and losses until they are realized, at which time they are transferred to the statement of operations.
Fair value is determined by:
Level 1 quoted prices (unadjusted) in active markets for identical assets or liabilities
When a decline in fair value is determined to be other than temporary, the amount of the loss is removed from any accumulated remeasurement gains and reported in the statement of operations.
ii) Cost or Amortized Cost
All other financial assets and financial liabilities are measured at cost or amortized cost. Transaction costs are a component of cost for financial instruments measured using cost or amortized cost. For financial instruments measured using amortized cost, the effective interest rate method is used to determine interest revenue or expense. Impairment losses such as write-downs or write-offs are reported in the statement of operations. Gains and losses on financial instruments measured at cost or amortized cost are recognized in the statement of operations in the period the gain or loss occurs.
operations. Valuation allowances are used where considered necessary to reduce the amounts reported for financial assets to their net realizable value. Cash and Cash Equivalents consist of cash, bank deposits and highly liquid investments with initial maturity terms of three months or less and held for the purpose of meeting short-term operating cash commitments rather than for investing purposes.
Accounts Receivable include taxes receivable, provincial grants receivable and other receivables. Taxes receivable represent education property taxes assessed or estimated owing to the end of the fiscal period but not yet received. The allowance for uncollected taxes is a valuation allowance used to reduce the amount reported for taxes receivable to the estimated net recoverable amount. The allowance represents management’s estimate of the amount of taxes that will not be collected taking into consideration prior years’ tax collections and information provided by municipalities regarding collectability of outstanding balances. Provincial grants receivablerepresent operating, capital and other grants earned but not received at the end of the fiscal year, provided reasonable estimates of the amounts can be made. Grants are earned when the events giving rise to the grant have occurred, the grant is authorized and any eligibility criteria have been met. Other receivables are recorded at cost less valuation allowances. These allowances are recorded where collectability is considered doubtful.
Portfolio Investments consist of mutual funds. The school division values its portfolio investments in accordance with its policy for financial instruments, as described in Note 2 (f).
h) Non-Financial Assets
Non-financial assets are assets held for consumption in the provision of services. These assets do not normally provide resources to discharge the liabilities of the school division unless they are sold.
Tangible Capital Assets have useful lives extending beyond the accounting period, are used by the school division to provide services to the public and are not intended for sale in the ordinary course of operations. Tangible capital assets include land, buildings, school buses, other vehicles, furniture and equipment, computer hardware and software, and audio visual equipment. Tangible capital assets are recorded at cost (or estimated cost when the actual cost is unknown) and include all costs directly attributable to the acquisition, design, construction, development, installation and betterment of the tangible capital asset. The school division does not capitalize interest incurred while a tangible capital asset is under construction.
The cost of depreciable tangible capital assets, net of any residual value, is amortized on a straight line basis over their estimated useful lives as follows:
Land improvements (pavement, fencing, lighting, etc.) 20 years
Buildings 50 years
Buildings – short-term (portables, storage sheds, outbuildings,
garages) 20 years
School buses 12 years
Other vehicles – passenger 5 years
Other vehicles – heavy (graders, 1 ton truck, etc.) 10 years
Furniture and equipment 10 years
Computer hardware and audio visual equipment 5 years
Computer software 5 years
Leased capital assets Lease term
Assets that have a historical or cultural significance, such as works of art, monuments and other cultural artifacts, are not recognized as tangible capital assets because a reasonable estimate of future benefits associated with these properties cannot be made.
Inventory of Supplies for Consumption consists of supplies held for
consumption by the school division in the course of normal operations and are recorded at the lower of cost and replacement cost.
Prepaid Expenses are prepaid amounts for goods or services (insurance and WCB fees) which will provide economic benefits in one or more future periods. i) Liabilities
Liabilities are present obligations arising from transactions and events occurring prior to year-end, which will be satisfied in the future through the use of assets or another form of economic settlement.
Provincial Grant Overpayment represents grants advanced to the school division in excess of the determined entitlement and which are repayable to the provincial government.
Accounts Payable and Accrued Liabilities include accounts payable and accrued liabilities owing to third parties and employees for work performed, goods supplied and services rendered, but not yet paid, at the end of the fiscal period. Amounts are payable within one year.
Long-Term Debt is comprised of capital loans and other long-term debt with initial maturities of more than one year and are incurred for the purpose of financing capital expenses in accordance with the provisions of The Education
Act, 1995.
The liability relating to these benefits is actuarially determined using the projected benefit method pro-rated on service and management’s best estimate of expected discount rate, inflation, salary escalation, termination and
retirement rates and mortality. Actuarial gains and losses are amortized on a straight line basis over the expected average remaining service life of the related employee groups. Actuarial valuations are performed periodically. An actuary extrapolates these valuations when a valuation is not done in the current fiscal year.
Recognition of employee future benefits obligations commenced on September 1, 2008. The school division recorded the full value of the obligation related to these benefits for employees' past service at this time.
Deferred revenue from non-government sources represents fees or payments for services received in advance of the fee being earned or the services being performed, and other contributions for which the contributor has placed
restrictions on the use of the resources. Revenue from tuition and related fees is recognized as the course is delivered, revenue from contractual services is recognized as the services are delivered, and revenue from other contributions is recognized in the fiscal year in which the resources are used for the purpose specified by the contributor.
j) Employee Pension Plans
Employees of the school division participate in the following pension plans: Multi-Employer Defined Benefit Plans
The school division’s employees participate in one of the following multi-employer defined benefit plans:
i) Teachers participate in the retirement plan of the Saskatchewan Teachers’ Retirement Plan (STRP) or Saskatchewan Teachers’ Superannuation Plan (STSP). The school division’s obligation for these plans is limited to
collecting and remitting contributions of the employees at rates determined by the plans.
ii) Other employees participate in the Municipal Employees’ Pension Plan (MEPP). In accordance with PSAB, the plan is accounted for as a defined contribution plan whereby the school division’s