Working Paper No. 2020-03
Competition in Higher Education
Michael Kaganovich
Indiana University
Sinan Sarpca
Koc University
Xuejuan Su
University of Alberta
April 2020
Copyright to papers in this working paper series rests with the authors and their assignees. Papers may be downloaded for personal use. Downloading of papers for any other activity may not be done without the written consent of the authors.
Short excerpts of these working papers may be quoted without explicit permission provided that full credit is given to the source.
Competition in Higher Education
Michael Kaganovich∗ Sinan Sarp¸ca† Xuejuan Su‡
April 2020
Abstract
The structure and functioning of the market of higher education in the United States possess distinctive if not puzzling features such as the wide spectrum of in-stitutional arrangements and sources of funding, stark segmentation in levels of selectivity and instructional resources, and high variance in tuition pricing across and within institutions, including price discrimination based on merit and ability to pay. At the same time, many fundamental questions, including what defines the quality of higher education and explains its (growing) cost continue to be debated. The Chapter surveys theoretical analyses addressing this range of issues.
JEL codes: I210, I220, I230, D400, J240.
∗
Michael Kaganovich, Department of Economics, Indiana University, Bloomington, IN 47405, USA. Email: [email protected].
†
Sinan Sarp¸ca, Department of Economics, Ko¸c University, Istanbul, Turkey. Email: ssarpca@ku. edu.tr.
‡
Xuejuan Su, Department of Economics, University of Alberta, Edmonton, AB, Canada. E-mail:
1
Introduction
Postsecondary education has seen dramatic expansion in the post-World War II era in the United States. According to the National Center for Education Statistics, the overall enrollment in the US degree-granting postsecondary institutions has increased between 1959-60 and 2016-17 academic years from 3.6 to 19.8 million or by 445% (see Table 303.10 in NCES 2020-009). We provide some detailed statistics of the facets of this expansion in Section 2 immediately below.
As documented by Goldin and Katz (1999), this expansion was a continuation of the trend that started half-a-century earlier, along with the development of institutional characteristics of the provision of higher education in the United States. Goldin and Katz (2008) and Acemoglu (1998, 2009) further demonstrate that the sustained expansion of college enrollment can be explained in the context of the intertwined dynamics of demand for and supply of skilled workforce recurrently fueled by and feeding into temporary relative compressions and increases of the skilled wage premium. In a Goldin and Katz expression, the changes in skill supply were the tail wagging the wage-premium dog. Some significant boosts to the expansion were intermittently driven by exogenous factors, including changes in immigration policy and other demographic and social developments and government policies, such as GI Bill of Rights and Vietnam War deferments, and the institutional ones, such as the expansion of public university system. An essential and growing part, especially since mid-XX century, of this story of spiraling growth of demand and supply of skill belongs, according to op cit. and extensive related literature, to the emergence of endogenous skill-biased technological change. According to this reasoning, expanding supply of skill and the resulting temporary reductions in its relative price fueled skill-complementing technological developments, which then propelled a wave of growth in skill premium and, in turn, stimulated the next wave of growth of its supply, and so forth.
Goldin and Katz (2008) volume devotes much attention to documenting and analyz-ing the evolution of the American system of higher education, which responded to the growing demand for skill and enabled the unprecedented expansion of college enrollment. They underscore its unique consumer orientation expressed, particularly, in the variety of institutions and their development into a competitive industry along with the rise, in the first third of the XX century, of the system of state supported public universities, which offered a dramatically more affordable access. This fact was in turn responsible for rapid expansion of public sector, reaching 70% of overall enrollments among 4-year institutions by 1970. They further document that although for the 1950-1980 period of rapid enrollment expansion, tuition growth at public universities was in line with the growth of median family income, the rise of the former decisively sped past the latter from that point on.1 The rapid rise of tuition and fees out of proportion to incomes
1A survey of some data we present in Section 2 helps relate this to the fact that state appropriations,
since 1980s is a striking and much debated phenomenon of American higher education. See, for instance, Ehrenberg (2000), who also analyzes the expanding mechanism of de-coupling of sticker-price tuition and the actual tuition charged to individual students in the form of financial aid, which effectively plays a role of price discrimination based on ability or willingness to pay.2
Given a well-developed historical outlook on the evolution of American market of higher education and the economic processes shaping it, this Chapter will focus on the economic theories, which analyze the structure and functioning of this market. This need is well justified by the unusual multitude of puzzles an economist is confronted with in attempting to understand the workings of this one of the largest of industries, whose economics Winston (1999) aptly labeled as “awkward”.3 One of the challenges continually debated in economic thought is defining the nature of the industrys product. As will be seen, the question of defining the value that a university adds to a consumer is of practical consequence for understanding the nature of competition and market structure in the higher education industry. We shall first examine alternative concepts of university value added in Section 3 and then, in subsequent sections, present the corresponding models of the higher education marketplace they give rise to.
One of the most influential such concepts, due to Spence (1973), is that of signaling value of college education under asymmetric information about student aptitudes. It suggests that college may not add intrinsic educational value, but rather play an in-termediary role in the job market by certifying the aptitudes of graduates to potential employers. Costrell (1994) and Betts (1998) advanced this idea to develop a theory of educational standards, which serve as sorting devices or pre-college preparation targets, which can incentivize students to study in order to gain admission but have no effect on the intrinsic gains to human capital while in college. The concept of the value of college education as a signal of quality also offered a powerful explanation to the depressing ef-fect of the higher educations expansion on the wages of workers without college degrees. Goldin and Katz (2008) among others underscored this phenomenon as a substantial factor contributing to the growth of college premium, hence creating positive feedback loop toward increased college enrollment.
The signaling paradigm proved further fruitful in a more recent literature to helping explain the differentiation of academic standards across universities and address the
shrinking share in public university budgets, which was being compensated by the growth of tuitions share.
2Fillmore (2019) specifically focuses on tuition price discrimination as a factor enhancing competition
in the higher education market. He assesses, in particular, that both are substantially amplified by colleges’ access to families’ reported ability-to-pay information – by means of the financial disclosure FAFSA form required of all applicants for college “financial aid” consideration, the key vehicle of the effective tuition price discrimination.
3
In this, he particularly referred to a growing predominance of tuition price discrimination in the form of financial aid based on a combination of merit and ability to pay, and observed that exceedingly rapid rise of sticker price tuition at private non-profit universities was a way to expand their ability to engage in price discrimination.
recently observed phenomenon of intensifying divergence of college selectivity in the U.S. (Hoxby, 2009). This implies that universities differentiate their products to serve different segments of student population. Most of this chapter indeed surveys alternative approaches to modeling quality of education and its differentiation across universities. Signaling tradition in particular emphasizes school reputation as the key characteristic of its quality. According to recent work, reputation is gained through ex post evidence, i.e., the signal, of the average quality of the university’s graduates, so the universities compete by means of admission standards. The resulting sorting of students across different colleges leads to signal differentiation according to endogenous creation of the respective student bodies, those more “reputable” and others less so.
An implication of the above signaling approach is that any student can benefit from being admitted to a university of higher quality. For instance, if a student of relatively low ability gains admission to selective school thanks to lucky draw at an admission test, he or she will benefit from the superior signal to the job market. Recent growing empirical literature (see, e.g., its comprehensive survey by Arcidiacono and Lovenheim, 2016) challenges this premise, particularly as applied to the evaluation of the outcomes of affirmative action programs. This evidence suggests that the educational benefit a student derives from attending a university depends on the quality of the match between the two. Attending selective university with high standards can be beneficial or detri-mental to a particular student depending on the fit between the student’s preparation and the “pitch” at which instruction is delivered at the college, such as the rigor of its curriculum. In short, this argument suggests that a university, which offers high quality to one set of students, is not the best choice for others. Specifically, for a given curricular standard, the returns to education would tend to be low for insufficiently prepared stu-dents as well as the “overqualified” ones, as opposed to stustu-dents whose aptitude is the right match for this curriculum. This approach thus focuses on defining product differen-tiation in higher education marketplace horizontally, as a menu of curricular standards, which cater to different segments of potential student population, so students can choose the best available match.
In Section 5, we review the recent work stemming from the two approaches outlined above to modeling university competition in terms of differential academic standards, both offering explanations for the evidence of increasing variation in the selectivity of institutions.
A distinct paradigm of the college value added that proved especially fruitful in terms of developing theories of higher education market structure belongs to Rothschild and White (1995). According to this idea, colleges do add human capital for their students; furthermore, cross-student spillover of knowledge is a central factor in this production, in addition to instructional and other inputs. Thus, the key conceptual innovation of Rothschild and White is that students can enter as inputs in education production, not just its output. This implies that the distribution of quality of its students (the “peer group”) is an essential measure of quality of an educational institution, and that therefore
some students can be more valuable to a university than others. Notably, this paradigm (uniquely among its competitors) offered a consistent theoretical foundation for modeling tuition pricing in higher education, with its pervasive phenomenon of price discrimination mentioned above. More broadly, the literature that emerged on this conceptual basis developed models of market segmentation of the higher education based on students’ intellectual ability (consistent with their roles as “inputs” in education production) as well as their ability to pay. Importantly, it was able to bring these models to data in a comprehensive fashion. We review the state of this literature in Section 4.
Recent advances in the economics of higher education go beyond the explorations of schooling attainment and college premium in general and draw attention to students’ choices of the fields of study. This is well motivated by the evidence that the choice of college major is becoming a dominant determinant of the variation in career earnings. In other words, the variation in college major premia is overtaking the average college premium (see James, 2012, Hershbein and Kearney, 2014). Furthermore, Altonji et al. (2015) and Kirkeboen et al. (2016) affirm the above even controlling for the quality of peers and the higher education institution overall, and find that the effect on earnings from attending a more selective institution is dominated by the payoffs to a field of study. Accordingly, the literature also provides strong evidence that students’ expectation of future earnings associated with college majors is a significant positive determinant of their decisions to choose among them: see Berger (1988), Montmarquette et al. (2002), and Arcidiacono (2004) among others. Student decision-making process about choosing a field of study is often characterized, in campus jargon, as that of “shopping” for majors and classes by students, at least implicitly acknowledging the elements of a marketplace in a campus operation. The flip side of this valid view is that major programs, the units of a university that offer classes, are active participants as “vendors” in this marketplace and often act as competitors for students.
Indeed, departments and their faculty are able to affect the selection of students into their programs by setting degree prerequisites and curricular requirements as well as the grading standards, given that the quantity and quality of students pursuing a major are consequential for its faculty, particularly in terms of the departments position in the intra-university allocation of resources. The latter fact is especially pronounced in universities, which adopted the Responsibility Center Management (RCM) system of budgeting (see Strauss and Curry, 2002). Based on the above argument, Achen and Courant (2009) conjecture that departments can and do use their grading policy as an instrument in the intra-university marketplace to manage their enrollments: to reduce congestion in classes offered by a department, or to counteract falling demand for it. In Section 6, we present a model of intra-university competition between major programs and analyze its implications for the trends in academic standards across disciplines. In concluding Section 7, we briefly survey the recent literature looking into potential disruption of the present competitive market model of U.S. higher education stemming from new technologies of online instruction.
2
Expansion of Post-Secondary Education since 1960s: Some
Facts and Figures
The following basic statistics focus on the changes in U.S. higher education over the last six decades. Unless otherwise specified, our data source is NCES (2020).4 Specifically, most of the figures reported below survey the changes that occurred over the period of 1959/602016/17.
2.1 Demand (student enrollment) side of the higher education market
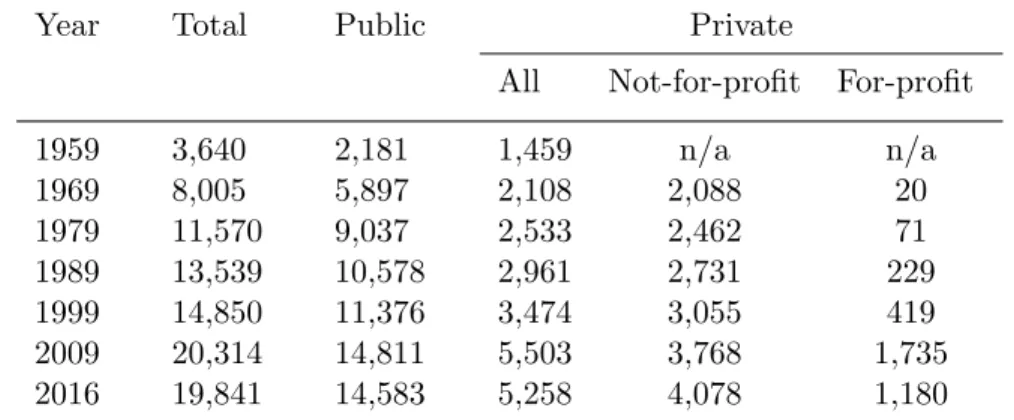
The number of students enrolled in degree-granting postsecondary institutions has in-creased from 3.6 to 19.8 million, or by 445% (see Table 303.10 in NCES, 2020). Of those, the enrollment growth in public institutions (by 569%) substantially exceeded that in private institutions (361%). Even accounting for population growth, postsecondary ag-gregate contemporaneous enrollments tripled over the period, increasing from 2% to 6% of the U.S. population. Starting in 1967, enrollment in private institutions was further broken down into private non-profit versus for-profit schools, acknowledging the emer-gence and growth of the latter sector. From 1967 to 2016, while the fall enrollments in all private institutions grew by 151%, in private non-profits they grew by 97%, while in private for-profits growth was 5,353%. This reflected a significant structural change: private for-profit enrollments accounted for merely 1.0% of all enrollments in private institutions in 1967, but reached 22.5% in 2016. The following Table 1 compiled from the aforementioned source details the evolution of these dynamics and shows, inter alia, that the expansion may be showing recent signs of stabilization.
Table 1: Enrollment in postsecondary degree-granting institutions (in thousands)
Year Total Public Private
All Not-for-profit For-profit
1959 3,640 2,181 1,459 n/a n/a 1969 8,005 5,897 2,108 2,088 20 1979 11,570 9,037 2,533 2,462 71 1989 13,539 10,578 2,961 2,731 229 1999 14,850 11,376 3,474 3,055 419 2009 20,314 14,811 5,503 3,768 1,735 2016 19,841 14,583 5,258 4,078 1,180
It is important to note that only a part of the demand growth was driven by young
4
Digest of Education Statistics 2018, National Center for Education Statistics (2019), NCES 2020-009,https://nces.ed.gov/programs/digest/d18/. Unless otherwise indicated, other references to data tables made in this Section likewise refer to this source.
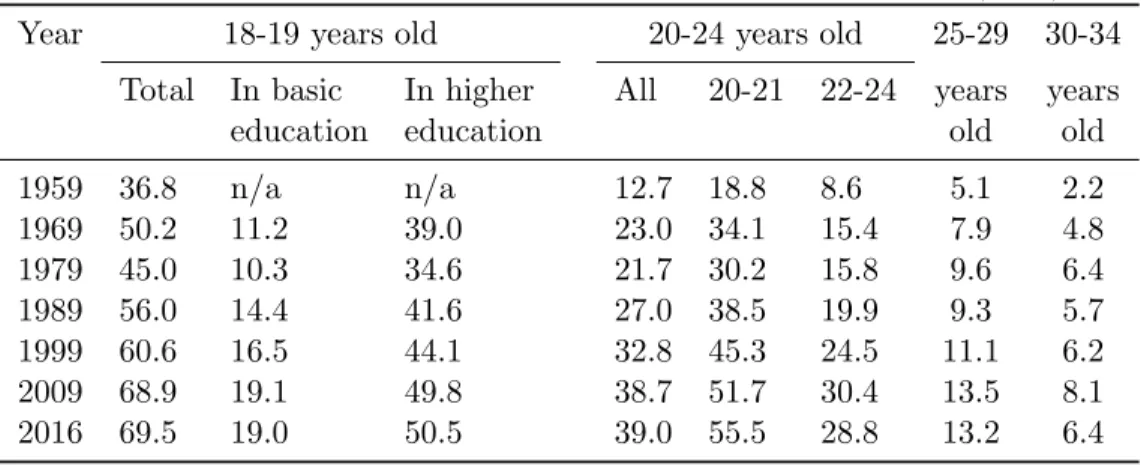
first-time students, i.e., predominantly recent highschool graduates. Among recent high school completers (ages 16 to 24), college enrollments increased from 0.8 million in 1960 (the earliest data available, representing 45.1% of the 1.7 million high school completers) to 2.2 million in 2016 (69.8% of 3.1 million high school completers), or by 189% (Table 302.10). At the same time, enrollments of first-time students increased from 0.9 million in 1960 to 2.9 million in 2016, or by 312%, which is also lower than the growth in all enrollments (Table 305.10). This suggests that a significant factor of the expanding enrollments, in addition to secular growth in the share of high-school graduates choosing to attend college, was also given by the expansion of less traditional cohorts of college attendees, such as: (a) older first-time students, outside the regular school age for higher education (over 24), (b) individuals pursuing multiple degrees, and (c) individuals making multiple attempts at higher education.
The following Table 2 (compiled from NCES, 2020, Table 103.20) offers a more de-tailed picture of this evolution.
Table 2: Enrollment in postsecondary education by age group (in %) Year 18-19 years old 20-24 years old 25-29 30-34
Total In basic In higher All 20-21 22-24 years years
education education old old
1959 36.8 n/a n/a 12.7 18.8 8.6 5.1 2.2 1969 50.2 11.2 39.0 23.0 34.1 15.4 7.9 4.8 1979 45.0 10.3 34.6 21.7 30.2 15.8 9.6 6.4 1989 56.0 14.4 41.6 27.0 38.5 19.9 9.3 5.7 1999 60.6 16.5 44.1 32.8 45.3 24.5 11.1 6.2 2009 68.9 19.1 49.8 38.7 51.7 30.4 13.5 8.1 2016 69.5 19.0 50.5 39.0 55.5 28.8 13.2 6.4
2.2 Supply (or “producer”) side of the higher education market
The post-World War II expansion characterized both the intensive (average size) and extensive (number of institutions) margins. It is important to note that according to Goldin and Katz (2008) the entry barriers for new universities rose at the turn of the XX century, as the cost structure increasingly favored larger institutions, implying that most of the expansion was bound to occur on the intensive margin. The second half of the century, however, did feature substantial net growth in the number of institutions. In the period between 1959/60 and 2016/17, the total number of degree-granting postsecondary institutions increased from 2,004 to 4,360, i.e., net growth by 116%.5 In particular, the
5
Note that the reported growth is net of exits from the industry. From 1969/70 (the earliest year of this data reported by NCES) through 2016/17, 922 postsecondary institutions have closed their doors.
rate of increase was larger for 2-year institutions (from 582 to 1,528, or 163%) than that for 4-year institutions (from 1,422 to 2,832, or 99%), suggesting that the extensive expansion was stronger in the lower segment of the market (Table 317.10).
The data differentiating private non-profit and private for-profit institutions became available starting in 1976/77. From that point through 2016/17, while the number of public institutions grew modestly from 1,455 to 1,623 and the number of private non-profit institutions grew from 1,536 to 1,682, the number of private for-non-profits jumped from 55 to 1,055 (Table 317.10). In other words, the for-profit sector featured most of the extensive growth, which was, by contrast, modest among non-profit universities and colleges, both public and private.
The estimated number of total faculty went from 380 to 1,546 thousand between 1959 and 2016, a 306% growth (Table 301.20). Although some of this growth included part-time faculty, the breakdown available starting in 1970 shows growth in full-time faculty by 121% (along with growth in the part-time faculty by 605%) between 1970 and 2016. Further, over this period, growth in the number of faculty is larger for 2-year institutions (by 280%) than that for 4-year institutions (by 214%) (Table 315.10).
In terms of degrees conferred, over the period from 1959/60 to 2016/17 the number of bachelors, masters, and doctoral degrees grew from 1,065 to 2,942 thousand, or by 176% (of those the graduate degrees grew by 261% and bachelors degrees by 147%), whereas the number of associates degrees conferred increased from 206 to 1,006 thousand, i.e., by 388% (Table 318.10). Notably, this dynamics exhibits a noteworthy U-shaped pattern, with lower and higher levels of attainment featured stronger growth than that in the middle (i.e., at the bachelor level).
2.3 Higher education finance
Measured in constant 2017-2018 dollars, total revenue in postsecondary education in-creased from 49 to 664 billion, or by 1,259% over the period from 1959/60 to 2016/17. Total expenditure grew from 47 to 597 billion, and the market value of endowment funds grew from 45 billion to 612 billion (Table 301.20). For comparison, real GDP (measured in chained 2012 dollars) increased over the same period from $3.3 trillion to $18.0 tril-lion, or by 453%. Thus, as a share of real GDP, the aggregate revenue of postsecondary education sector increased by 146%.
Note that total revenue includes funding from both public and private sources, the latter of course including tuition payments. Although systematic historical data on the dynamics of these components is scarce, the Digest of Education Statistics 2008 (NCES,
Remarkably, a large share of these exits occurred in most recent years: 112 in 2016/17, 66 in 2015/16, and 54 in 2014/15. (table 317.50) Furthermore, 2-year institutions saw more exits (520) than 4-year institutions (402), and private institutions saw far more exits (871) than public institutions (51). Starting in 1990, the data on private institutions was further broken down into private non-profits and for-profit institutions. From 1990/91 to 2016/17 of the 629 private institutions that exited, there were 444 private for-profits and 185 non-profits.
2009) indeed reported the following statistics over the period from 1980/81 to 2000/01, showing an overall decline in federal and state funding as a share of the current-fund revenue of public institutions (Table 349). Most notably, within the short two decades, share of funding from state governments dropped from 45.6% to 35.6%. The difference was made up, in part, by increased role of tuition and fees, whose share grew from 12.9% to 18.1% over this period (Table 333.10). Note that the increasing importance of tuition and fees in public institutions reflects not only the enrollment growth, as discussed before, but also sharp tuition increases. Measured in constant 2017/18 dollars, the average undergraduate tuition and fees for full-time students in public institutions doubled from $1,819 in 1980/81 to $3,631 in 2000/01, and over a longer time period, nearly quadrupled from $1,883 in 1963/64 (earliest data available) to $6,972 in 2016/17 (Table 330.10).
For private non-profits, the share of tuition and fees in total revenue increased from 24.6% in 1999/2000 to 39.5% in 2015/16; of those, the increase at 4-year schools was from 24.4% to 39.3%, whereas at 2-year institutions it went from 43.0% to 80.2%, i.e., to near-complete budgetary reliance on tuition and fees. A noteworthy distinction of private institutions is a substantial role of private gifts in their financial model, which averaged 13.4% over this period. Over the period 2007/08 2015/16, for which the data is available for both private and public institutions, their share averaged 14% of total revenue in all private institutions (Table 333.40) but less than 3% of total revenue in public institutions (Table 333.10).
2.4 Selectivity of Colleges
Hoxby (2009) measures college selectivity by the average standardized pre-college apti-tude test (SAT or ACT) score of their sapti-tudents, translated into current national per-centiles of entrance exam takers, which thus could be viewed as representing the absolute exam performance on a stable metric. Using data from various college guides from 1962 to 2007, she found that the top 10 percent of 4-year colleges in the U.S. had become sub-stantially more selective since 1962, while at least the bottom 50 percent of colleges have become substantially less selective. To reiterate, this phenomenon is defined, accord-ing to the methodology, by the divergaccord-ing dynamics of the average aptitude of students between more and less selective colleges. Hoxby (2009) attributes this increased strati-fication in student sorting across colleges to the greater nationalization of what used to be local markets for college education. At the same time, she found that the diverging selectivity across colleges was also accompanied by the growing inequality in educational resources provided at colleges, with students at more selective institutions enjoying dis-proportionate growth in quality of education, judging by this metric. More specifically, while “student-oriented resources” were similar at colleges in the data set regardless of selectivity levels in the 1960’s, their growth was strongly correlated with the level of selectivity: going from the average 7 percent annual growth rate of real resources per
student at the least selective colleges to 13 percent at the most selective ones, resulting in a notable right skewness in the distribution. Furthermore, real subsidies per student (i.e., the difference between the cost of resources and tuition charges) exhibit similar pattern with the average annual growth rate between 7 and 10 percent for groups of less selective colleges, and 25 percent for the most selective ones. This particular finding is consistent with the data on the changes in the composition of university funding we discussed above, whereby the share of tuition revenue shrinks in the operating budgets of selective private schools, while growing at public universities.6
Bound et al. (2009) who study a more recent time period from 1986/87 to 2003/04 affirm increasing segmentation of the market, with particularly strong rise in selectivity of the most selective universities. When it comes to the changes in the compositions of student body across the spectrum of 4-year colleges, they focus on the dynamics of aptitude test scores of students in college-specific 75th percentiles. They find that these characteristics of student body, while being markedly higher at more selective colleges, have exhibited growth in all categories of colleges (albeit still higher at the more selective end) over the period, suggesting a degree of selectivity growth even among the less selective universities. This finding is not in contradiction with Hoxby (2009), because of its focus on students at the higher end of aptitude, rather than on central tendency for a college. Furthermore, we find it to be important in potential relation to the recent evidence of the growing student sorting across fields within colleges, responding to the developing dominance of the field of study as a factor in returns to college (see Altonji et al., 2015, Kirkeboen et al., 2016, and our discussion in the previous section). Indeed, as pointed out by Arcidiacono et al. (2016), moderately able students improve their chances to graduate in a more lucrative major by trading down in the selectivity ranking of the university they attend.
An important question stemming from the evidence of growing selectivity, particu-larly at the high end of the distribution, of U.S. universities is its implication for the level of competition in the higher education market. It suggests a possibility that the overall growth of competition may co-exist with growth in market power of the more selective universities. This question and further evidence are discussed in detail in Section 4 of the Chapter.
6
The market structure of U.S. higher education, where public universities perform the role of en-suring greater access and affordability while the elite layer of the system with superior resources and best-prepared students is largely occupied by private institutions, is strikingly distinct from most other countries. Indeed, in internationally prevalent higher education systems, elite universities, superior in instructional resources and quality of students, are predominantly publicly funded while the private uni-versities tend to serve the less selective segment of the market. These features invite distinct lines of inquiry, such as into the regressivity in the distribution of public subsidy (see, e.g., Psacharopoulos, 1977) and its implications for access and selectivity (see Eckwert and Zilcha, 2020, and Del Rey and Estevan, 2020, for recent theoretical analyses).
3
What do Universities Produce and How Do They Do It
In this Section, we shall survey three main paradigms developed in the literature, which help analyze the nature and ingredients of the value added produced by universities (i.e., the “returns to college”) and explain the quality differentiation among them. We’ll use these introductions as jumping-off ground for discussing the corresponding alternative characterizations of higher education market in Sections 4 and 5.3.1 A signaling model of educational standard
The “signaling” paradigm originating from the seminal contribution by Spence (1973) explains the value of colleges as labor market intermediaries helping resolve informa-tional asymmetries between job applicants and employers. It posits that colleges can attract students without necessarily engaging in intrinsic creation of human capital. This paradigm led to the emergence of the concept of academic standard (Costrell, 1994, Betts, 1998). Their modeling approach, laid out in some more detail below, is motivated by the following assumptions:
– employers cannot distinguish well between the levels of productivity of individ-ual college graduates; similarly, they are unable to make such distinctions among prospective workers without college degree;
– they do have the information about the average (or an analogous aggregate charac-teristic of) productivity of college graduates as well as of the pool of those lacking college education;
– these aggregate productivity levels are determined by curricular standards ensured by the college(s) and the distribution of individual characteristics, such as abilities, of those with and without college degree;
– in this environment, since the fact of college graduation (or lack thereof) is all that an employer can tell about the student, students will decide to acquire higher education (or not) depending on those average returns and the individual cost of meeting the college academic standard.
Let student i’s human capital attainment be given by a function πi = h(1Li, ai),
concave and increasing in each of the arguments, namely, the student’s effort (time en-dowment less leisure L) and exogenous ability, which implies that more effort is required of student of lower ability to reach the same level of achievement. Ability is distributed with a given CDFF(a) on an interval [a, a]. Suppose the college sets a passing standard
πsrequired for graduation. Based on the above assumptions, the wage of those who end
and “unskilled” wage rates are given, respectively, by
ws=αE(πi|πi ≥πs), wu=αE(πi|πi< πs),
where α is an exogenous positive scale coefficient.
Students’ choices are determined by individual utility function U(Li, wi), increasing
and concave in both arguments. A student who is able and willing to pass the standard will have no incentives to exert efforts to achieve beyond it. However, students of high enough ability may exceed the standard effortlessly. This will be the case for those whose individual ability exceeds the level a∗∗ defined by the zero effort corner solution
πs=h(1, a∗∗). For the rest of the college attendees, the decision will be an interior (in
terms of effort) optimumπs=h(1−Li, ai). It can be shown that there is a cut-off ability
level a∗ such that students of ability at or above it will decide to attend college while those with ability below it will not, and hence apply zero effort.
What happens if colleges raise educational standard? Since dws
sπs|a>a∗ = α(F(a∗∗)−F(a∗)) 1−F(a∗) + ∂ws ∂a∗∂a ∗ ∂πs, it is obvious that ∂ws
∂a∗ >0 and it can also be shown that in any stable equilibrium
∂a∗
∂πs > 0. Thus, educational achievement will increase among college graduates, and so will their wage: dws
sπs|a>a∗ >0. The wage of unskilled workers will also rise. Indeed, since
∂a∗
∂πs >0, the average ability and hence the average effortless human capital attainment among the unskilled will rise due to the change in the group’s composition (as the abil-ity cutoff for going to college increases, fewer people will enroll). The only workers who will see their wage drop as a result of the change are those at the margin who would have otherwise chosen to attend college and now choose to no longer meet the degree standard.
So, how should the higher education standard be set? Costrell’s and Betts’ pa-pers analyze alternative approaches to setting the “optimal” standard, including those of (i) egalitarian social planner, who maximizes a concave aggregate (planner’s) utility over workers incomes and (ii) the planner concerned with the aggregate efficiency, hence maximizing the aggregate income. It can be shown that the comparison of preferred standards based on equity and efficiency may go either way. This is due to the fact of a group’s composition affects the group’s wages. This is indeed a substantive point: when college enrollment expands significantly, this may hurt wages of the unskilled substan-tially, because of the perceived lower average human capital level of this group. This depressing effect of expanding enrollments in higher education on the wages of workers without college degrees is well known. It is underscored by Goldin and Katz (2008), in particular, as a factor in the growth of college premium, hence creating positive feedback loop for increased college enrollment. The fact that this is also well understood can be credited to the signaling paradigm.
3.2 Standard differentiation across institutions and their diverging se-lectivity
The idea of academic standard can be taken further as an institution-specific character-istic, which can differ across universities. This point has received new attention in recent literature as a basis for characterizing the industrial organization of higher education through product differentiation to help explain the differences in the levels of selectivity of universities, which as we discussed above have exhibited continued divergence. Ac-cording to this characterization of the higher education market, universities compete by differentiating their standards to serve different segments of student population.7
A novel line of reasoning explaining the role and the workings of quality (hence ver-tical) differentiation in the signaling framework was recently advanced by MacLeod and Urquiola (2015) who emphasize school reputation as the key characteristic of its quality. Reputation is gained through ex post evidence, i.e., the signal of the average quality of the university’s graduates, which is in turn ascertained by means of admission standards. In their model, in the Spence-Costrell-Betts tradition, information about individual pro-ductivity is imperfect. As a result, employers must rely on the mean propro-ductivity of a pool of graduates as their shared characteristic. The focus now, however, is on sort-ing of students across different colleges, which leads to signal differentiation accordsort-ing to endogenous creation of the respective student bodies, more or less “reputable”. Ac-cordingly, this creates incentives for students to gain admission to the best university possible (i.e., with as able peers as possible, despite the absence of substantive learning spillovers from peers in the model), and for colleges to select students via admission standards accordingly. MacLeod and Urquiola term this mechanism of favorable selec-tion the “anti-lemons” principle since, unlike in the case of Akerlof’s (1970) “Lemons”, it features the exclusion of inferior participants. In their model, individual ability ai of
potential student iis not observed and can only be estimated through a noisy universal college admission test. Students are (or are not) admitted to a university based on ob-servable test outcomeτi =ai+ri+τi whereriis individual effort to prepare to the test,
which does not contribute to skill, andτi is the error term. If student igraduates from college s, she will possess skill levelθi =ai+ei+vs whereei is the individual effort in
college, which is productive and happens to be uniform in equilibrium for all attending college s, and vs is the colleges value added. As a result, individual’s post-graduation
wage is positively affected by the mean ability of her college peers (notably, without any direct knowledge spillovers from them). Therefore, all students in college s have an interest in higher minimum admission test score τs, assuming they get admitted.8
7
De Fraja and Iossa (2002) study intercollegiate duopoly competition in terms of quality as well as geographic proximity with school quality determined by its admission standard, whereas any admitted student benefits from a higher standard, as long as he meets it. Eisenkopf and Wohlschlegel (2012) also analyze a duopoly model where colleges offer distinct standards. Likewise in line with the signaling literatures approach, weaker students do prefer lower curricular standards, because the study cost of attaining high standards is excessively high for such students.
8
Hence the positive self-selection of peer groups into as selective a college as possible per the aforementioned anti-lemons principle. The reputation-building motive driving this mechanism results in stronger ability sorting of students across colleges and leads to over-investment of effort in unproductive admission test preparation while dulling incentives for productive learning while in college.
An alternative (to that of signaling) approach to explain the differentiation of aca-demic standards across higher education advanced in a recent literature focuses on the direct effect of curricular standards on human capital production function, as opposed to their mere sorting role in the context of asymmetric information. The framework discussed above features, due to the signaling mechanism at work, the “Groucho Marx” condition (as termed by MacLeod and Urquiola): a relatively weak student would ben-efit from attending a more selective institution, to which he would normally be denied admission unless getting in through a lucky draw. Such premise is challenged in recent empirical literature.9 In contrast, the curricular standards paradigm is motivated by potential failure of such assumption. For instance, Arcidiacono and Lovenheim (2016) distinguish between the “quality effect” of a more selective college (such as better in-structional resources), which can benefit any student, from the “match effect” benefiting only students whose adequate prior preparation makes the college a good “match” for them.
Kaganovich and Su (2019) explicitly incorporate the latter feature by defining the value added of a university as student-specific, dependent on the relationship between a students preparation and the level of the universitys curriculum. For a given such level, returns to education will be low for insufficiently prepared students as well as for the “overqualified” ones, as opposed to students whose aptitude is a “good match” for this curriculum. In their model, curricular standard is a discretionary characteristic of education technology, strategically chosen by and potentially differing across colleges, thus determining their levels of selectivity. Specifically, they define human capital value added function for a student of aptitude (prior preparation) aas
hs(a) =
(
Bs(a−cs) if a > cs,
0 if a≤cs,
(1)
wherecsis the curricular threshold chosen by collegesandBsis the learning progress rate
corresponding to and increasing in the chosen curriculumcs. This implies that students
with aptitude below cs will derive no benefit from college swhile those whose aptitude
framework, since higher standards confer benefits without extra costs. If, however, higher selectivity of a college translates into greater curricular challenge, an overly optimistic test outcome may compel the student to make ex post adjustments. Manskis (1989) analysis of the widespread college dropout phenomenon was influential for the expanding empirical literature on student responses to performance in college, which is outside the scope of this review.
9See, for instance, Light and Strayer (2000), Arcidiacono et al. (2016), and a comprehensive survey
by Arcidiacono and Lovenheim (2016), particularly as applied to the evaluation of the outcomes of affirmative action programs.
ais insignificantly abovecswill benefit very little. Thus, a student’s human capital gain
at a college depends on the relationship between his aptitude and the college’s curricular standard, such that cross-college comparison of quality is student-specific. For a given level of student aptitude, there is an individual-specific “Goldilocks” optimal curricular standard for this student’s instruction, hence the “match effect”. Each student chooses his best match among available colleges according to the curricula they offer. The tradeoff a student of given preparation faces when choosing between two colleges offering different curricular standards can be illustrated by the following Figure 1.
Figure 1: Student trade-off in choosing between two academic curricula
slope: B2 c2 c 1 Human capital (h) slope: B1 A more challenging curriculum (B1 , c1) A less challenging curriculum (B2 , c2) Student aptitude (a)
The trade-off depicted in the figure implies that there is a threshold separating the students preferring more selective college 1 from those who are better off attending college 2 (it is obviously determined by the point of intersection between the two lines in the figure). As a result, the colleges are able to compete for students by choosing locations in the space of curricula, i.e., they differentiate their products horizontally. As will be detailed in Section 5, the model conjectures a natural ranking of selectivity among the universities determined by the weights they place on the quantity of students they enroll, besides the quality of students. Their preferences for quantity are in turn derived from the budgeting environments of the universities: the stronger dependence on tuition revenue in the operating budget, the more weight a university will place on the size of enrollments.
3.3 Students as inputs: peer-group effects in college human capital production function
Finally, we lay out the paradigm originating with Rothschild and White (1995), which proved to be one of the most influential for the literature under our review in its ability to reproduce the structure and characteristics of the U.S. higher education market, both qualitatively and quantitatively. According to this theory, which unlike the signaling paradigm, emphasizes the intrinsic value added of college education, the magnitude of value added depends, in addition to the quality of instructional inputs, also on the average quality of students through direct learning spillovers, i.e., the peer group effects in education. This motivated the key innovation of Rothschild and White that students can enter as inputs in education production, not just its output. As a result, some students can be more valuable to a university than others, particularly by enhancing the educational experience for their classmates. This then implies that tuition price discrimination is in order: efficient tuition should deduct the marginal contribution of a student to the university’s total human capital production from the marginal cost of the output the student receives, and thus may vary among students in the same classroom. In the Rothschild and White (1995) model, universities’j= 1, ..., J production tech-nologies are given by distinct production functionsFj(·), whereby the differences can be
attributed to variation in their exogenously given fixed inputs. The key variable input is a university’s student body composed of different student types (nj1, nj2, ..., njT) where
njt is the number of type t students attending university j. Output vector is given by jointly produced aggregate amounts of human capital of each type (H1j, H2j, ..., HTj) with each type t graduate receivingHtj/njt units of the corresponding type of human capital (whereas, notably, students of each type may affect the production of human capital of other types). Universities choose type-specific tuition levels to maximize their profits in a competitive market. Under standard assumptions, optimal tuition universityjcharges a type t student is derived as pjt =Htj/njt−wˆt, where ˆwt is the value of type t student
to a university as an input, which happens to be equal across universities in equilibrium. Thus tuition is differentiated by student type, according to their input value, but also across universities, according to their productivity in a given human capital category. This framework thus played a seminal role in modeling tuition price discrimination, which as noted above, is an essential distinct characteristic of competition in the U.S. higher education market.
In a series of papers Epple, Romano, and Sieg (henceforth, ERS) (2002, 2003, 2006, 2008) build on the Rothschild and White (1995) framework to develop a comprehensive model of the market for higher education and use it for the theoretical and empirical analyses of the markets features. In ERS model, quality-maximizing universities compete for students who are heterogenous in ability, household income, and other characteristics. The quality of education at a university is determined, in line with Rothschild and White, by its students characteristics (e.g., peer quality deriving from student abilities) as well
as choices of other inputs such as per-student instructional expenditures. Equilibrium in the higher education market features endogenous product (i.e., quality) differentiation, co-determined by: (i) the optimal admission, pricing, and non-student input decisions by competing schools, (ii) sorting of students (both as consumers and inputs) across universities, where universities optimal (type-specific) prices internalize peer externalities as in Rothschild and White (1995).10
ERS modeling paradigm entails two dimensions of tuition price discrimination among students. The first, derived from internalizing the peer-effect externalities in the spirit of Rothschild and White (1995), reflects the common practice of merit-based financial aid in U.S. higher education. This approach can also capture tuition discounts to un-derrepresented minorities, provided that universities value diversity in the student body (ERS, 2003, 2008). The second channel is tuition differentiation based on family income, hence ability to pay, and corresponds to the universal practice of need-based financial aid and is strongly evidenced in the data sources (see, for instance, ERS, 2003; McPherson and Shapiro, 2006). ERS models are able to capture this income-based price discrim-ination feature of the market by using pricing above marginal cost, but its magnitude is limited in the presence of close competitors. Indeed, the ability to price discriminate based on income requires that universities possess market power, which may in principle run counter to the evidence of the increased overall levels of competition.11 Epple, Ro-mano, Sieg, and Sarp¸ca (henceforth ERSS) (2017) develop a novel model of the market for higher education, which incorporates the exercise of market power in the framework of monopolistic competition. As a result, along with the peer-group externalities, the model is able to successfully combine the two aforementioned channels of tuition price discrimination. This theoretical model was given support by the empirical analysis by Epple, Romano, Sieg, Sarp¸ca, and Zaber (ERSSZ, 2019) providing evidence of significant market power, particularly at selective universities, which do in fact feature most stark levels of tuition price discrimination.
Overall, this branch of literature was able to offer a distinct characterization of quality differentiation across universities according to the combination of students academic abilities and their ability to pay, tuition differentiation within and across universities, and in response to changes in public funding policies, as reviewed in more detail in the next section.
10Building on ERS (2006), Sarp¸ca (2010) introduces an additional layer of product differentiation:
specialization among colleges in types of disciplines. Multi-dimensionality of student abilities and hence of their effects on peers is an essential premise of the model with implications for optimal pricing and allocation of students across colleges.
11
Hoxby (1997) presents evidence of increased overall competition in the U.S. higher education in the second half of the XX century. However, she argues that this was accompanied by increased vertical product differentiation in terms of quality of education between the universities.
4
Peer Group Effect-Based Models: Market Structure,
Com-petition, and Pricing in Higher Education
In this Section, we first review a basic version of the Epple-Romano-Sieg (ERS) model, introducing the common components of their four referenced papers and their selected findings, extensions and implications. We then discuss innovations introduced in the Epple-Romano-Sarpa-Sieg (ERSS) model to incorporate market power of selective insti-tutions and review the findings of ERSS (2017) and ERSSZ (2019).
4.1 ERS model
There is a continuum of potential students who differ with respect to their household income y and their ability b with joint marginal distribution f(b, y). The utility func-tion of a student U(·) is increasing in its two components: numeraire consumption and educational achievement. Consumption is income net of university tuition p, if one is attended. Educational achievement h(·), is increasing in the quality q of the university attended and the student’s ability. A type (b, y) student’s utility from attending univer-sity j is thus U(y−pj, h(qj, b)). Ordinary demand for university quality is increasing in
income and non-decreasing in ability. Individuals are free to not attend a university, in which case they pay no tuition (p0 = 0) and experience a quality q0 (same as for those
not admitted by any university).
There are J universities competing for students. Universities differ ex-ante in their non-tuition revenues E1 < E2 < ... < EJ (such as endowment income, state subsidies,
etc.). All universities have the same cost function C(kj, Ij) = F +V(kj) +kjIj with
V0, V00 >0 where kj is the number of students admitted to universityj and Ij stands
for educational expenditures per student there. Quality of education qj at universityj
is determined by the average ability of its students θj and educational expenditures per
student, such that qj =q(θj, Ij).
A university chooses tuition and admission policy and the levels of expenditure on educational inputs to maximize its quality, subject to a budget constraint, while taking as given the alternative choices available to students in equilibrium. Let αj(b, y) ∈
[0,1] denote the proportion of students with characteristics (b, y) that universityj finds optimal to admit. It is optimal for university j to charge a student his/her reservation priceprj(b, y) at which the student reaches the level of utility of his/her best alternative, which is given by
U(y−pRj(b, y), a(qj, b)) = max
i∈{0,1,2,...,J}, i6=j, αi>0 is optimal
where university j’s optimal admission policyαj is derived as αj(b, y) = 1 ∈[0,1] = 0 if p R j(b, y) > = < V 0(k j) +Ij+ ∂q/∂θ ∂q/∂I(θj−b) | {z } EM Cj(b) . (2)
Thus university j admits all (no) students of type (b, y) if that types reservation price for attending universityj exceeds (is below) the types effective marginal cost EM Cj(b).
If the two are equal, the university is indifferent what share of the type is admitted. The effective marginal cost is the sum of the cost of admitting any student V +I and the cost of neutralizing the particular students ability externality (the change in the magnitude of peer effect from admitting abilitybstudent multiplied by the resource cost of maintaining the university quality). Note that EM C varies across students within university j only with students ability, and the peer cost enters as a negative term if a students ability is above university mean. Note that if other student characteristics whose averages affect school quality, e.g., racial or income diversity, are incorporated in the model, then corresponding additional terms will appear in theEM C function.
Caps on tuition prices are an essential and realistic attribute of the market pricing featured in ERS model. If a university posts maximum tuition pj so that pj(b, y) =
max{pRj (b, y), pj}, the differencepj−pj(b, y) between the posted tuition and that charged
to a student can be naturally interpreted as the institutional financial aid to a student of the type in question.12 Similar to (2), the equation between the effective tuition price paid and the effective marginal cost of admitting the student determines student ability threshold for admission to university j, as described in more detail below.
ERS derive the properties of the respective models regarding school characteristics, pricing and admission functions, and the resulting allocation of students across univer-sities. The common properties for the class of models are as follows. Schools vary by quality endogenously in equilibrium such that qi < q2 < ... < qJ with quality hierarchy
following the endowment ranking. Students are stratified along the income and ability dimensions such that the admission regions of different universities are separated by downward sloping boundary loci in the (b, y) space. Along the boundary loci, tuition charge equals EM C and thus can be expressed as a function of ability only. In the interior of the admission regions, tuition at the attended school exceeds EM C and de-pends partly on a student’s income. Still, the allocation of students across schools is the same that would obtain if they were charged p =EM C at every school. The extent of pricing by income is restricted by competition: tuition charge pj cannot deviate much
from EM Cj in the presence of close substitutes for j. This also implies that the top
quality school will have more room for pricing by income than the other schools, as it
12
The model also allows for the provision non-institutional financial aid, e.g., provided by government based on student characteristics, which can be then incorporated directly into student utility function. Let such aid received by a student be given byA(·), then utility expression becomesU(yp+A(·), h(·)).
does not have competition from above.
ERS (2002) and ERS (2008) consider a model, in which students are additionally characterized by race (white or nonwhite). The first of these papers studies alternative specifications of students’ and universities’ preferences regarding diversity. They then analyze their implications for the distribution of white and nonwhite students within and across universities in equilibrium. ERS (2008) build on this menu of models to character-ize optimal university policies for admission and tuition pricing under affirmative action. Affirmative action results in minority students paying lower tuitions and attending higher quality schools compared to non-minority students with similar income and ability. A ban on affirmative action is studied as a policy option and found to have substantial impact on admission of minorities. When the ban runs counter to universities preference for diversity, the universities are able to partly circumvent the ban by exploiting the information on how ability and income are related to race in their admission and pricing so as to achieve desired diversity. This comes at a cost of extending admission, in lieu of some minority students, to previously ineligible categories of non-minority students who fit the statistical profile of the ability-income relationship. Specifically, this group includes some non-minority students with high to moderately high income but relatively low SAT scores. Welfare analysis with a computational counterpart of the model sug-gests that the loss to minorities resulting from a ban on affirmative action substantially outweighs the gain to non-minorities.
ERS (2003) incorporate non-institutional aid into the model, such as based on poli-cies of and funded by the federal government along with preferences for diversity with multiple dimensions, and go on to investigate whether the model’s various predictions are broadly supported by the data. The analysis combines student-level data (including in-come, ability as measured by standardized test scores, institutional and non-institutional aid) from the National Postsecondary Student Aid Study (NPSAS), and detailed school level data from Peterson’s and NSF WebCASPAR.13 The paper documents correlation of average SAT scores, expenditures per student, endowment per student, and average tuition, along the school quality hierarchy and shows that they are in line with the model’s predictions. A series of reduced form regressions also provide some support for stratification of universities by income and ability produced by the model. The empirical analysis in the paper provides evidence of tuition price discrimination by student ability, consistent with schools’ preference for peer quality. ERS (2006) advance the empirical analysis by developing a framework to estimate the model, using mostly the data refer-enced above. An empirical regularity that comes up in many data sources is the presence of price discrimination based on student family income, framed as institutional financial
13
NPSAS: National Postsecondary Student Aid Study, National Center for Education Statistics, NCES Handbook of Survey Methods, https://nces.ed.gov/statprog/handbook/npsas.asp; Peterson’s: Pe-tersons CollegeData,www.petersonsdata.com; WebCASPAR: National Science Foundation database for Science and Engineering and other fields at U.S. academic instituitions, https://catalog.data.gov/ dataset/webcaspar.
aid, stronger than predicted by ERS (2003). To capture this empirical phenomenon, ERS (2006) generalize the model to include preferences for income diversity in the student body and, using estimated parameters, study the effects on sorting of students across schools based on counterfactual analyses: (i) a ban on price discrimination by income; (ii) a change in the federal financial aid formula. A more substantial leap in capturing the tuition pricing by income was achieved, however, by introducing significant modeling innovations discussed below.
4.2 ERSS model
ERSS (2017) aims to capture a broad array of qualitative and quantitative characteristics of the U.S. market for higher education, including the institutional differences between universities reflected in their objective functions, funding sources and pricing policies, such as the differences between private and public universities along with the regional variation of pricing in public universities for in-state and out-of-state students. To this end, they develop a model, which is adequately rich in institutional details to produce the requisite variety of outcomes in terms of admission and pricing policies and the allocation of students across universities in equilibrium. Here, we briefly review the main distinctions of this model compared to the baseline models discussed above. The key features of the model include the competition between state and private colleges, which differ in their objectives, and incorporation of federal aid policies reflecting their real world characteristics.
In addition to abilityband incomey, students differ also in state/region of residence
s ∈ S and unobserved idiosyncratic preferences over universities. Utility of student of type (s, b, y) from attending university j is given by
U(y−psj(b, y), h(qj, b)) +j,
wherejdenotes an idiosyncratic preference shock for schooljknown only to the student.
Students choose among their college options to maximize utility, given the prices and qualities P(s, b, y) ={psj(b, y)}Ji=0 and Q={qi}Ji=0 of allJ universities, public and
pri-vate, as well as the outside option. Conditional choice probabilities rsj(b, y, P(s, b, y), Q)
are obtained by integrating out the idiosyncratic the taste components for each type. A private university’s problem can be formulated in a similar fashion to that in ERS by re-placing the admission functionαj(b, y) with the conditional demandrsj(b, y, P(s, b, y), Q)
aggregated over all states s∈S. For student of type (s, b, y) with ysj >0, the optimal
tuition at university j satisfies
psj(b, y) + rsj(b, y;·) ∂rsj(b, y;·)/∂psj(b, y) =V0(kj) + Ij + qθ qI (θj−b) | {z } EM Cj(b) .
The left hand side of this equation is marginal revenue from admitting student of type (s, b, y), withrsj(b, y,·) representing the type’s demand for universityj. The right-hand
side is the effective marginal cost as discussed in the ERS model, see expression (2). The following three functional and parametric specifications of the model, which are used in the computational application in ERSS (2017) and estimation purposes in ERSSZ (2019), provide further insight into the workings of the model:
(i) The university quality function is given by forqj =θjγIjωΓκj forγ, ω, κ >0.
(ii) The utility of a student from attending universityj is given by function Uj(y−
psj, a(qj, b)) = αln[(y−psj)qjbβ] +j where β, α > 0 with α representing the weight
student places on the systematic component of utility.
(iii) The idiosyncratic disturbances j are independent and identically distributed
with Type I Extreme Value Distribution.
Let Ja(s, b) denote the choice set of students of abilityb in region s, i.e., the set of
schools, which will find it optimal to admit the type in equilibrium. The conditional choice probability for type (s, b, y) student for universityj∈Ja(s, b) is then given by
rsj(b, y) =
[(y−psj(b, y))qj]α
P
k∈Ja(s,b)[(y−psk(b, y))qk]
α. (3)
With a continuum of students of each type, these expressions represent conditional mar-ket shares. This illustrates a major distinction compared to a baseline ERS model: Ad-mission spaces overlap, such that students of the same type appear in different schools, though in different proportions. Furthermore, the optimal tuition price is now obtained as a weighted average of the effective marginal cost of admitting the student and student’s income: psj(b, y) = (1−rsj)α 1 + (1−rsj)α EM Cj(b) + 1 1 + (1−rsj)α y (4)
With the incorporation of idiosyncratic preferences, pricing by income arises naturally as an equilibrium outcome within a framework of monopolistic competition. The first term captures merit (i.e., ability) based financial aid, or that based on any other student characteristic whose average directly contributes to the school quality. The second term reflects the exercise of market power. The markup is monotonically increasing in students family income. The weight on income increases with (type-specific) demandrsj(b, y) and
decreases with α. The university captures more revenue from higher income students with stronger demand. Note that pricing by income persists even if individual colleges have negligible market shares, since the markup for a student depends not on the overall market share of the university, but on the market share conditional on observed student characteristics.
Another important feature of this model is the inclusion of the public sector in the competition. A theoretical challenge has been to capture the different objectives of private and public universities and the different constraints they face within a general
equilibrium model. Public universities face state mandates and incentives to provide affordable education to in-state students. In the model, tuition levels for in-state and out-of-state students are legislatively fixed. The public universities then choose ad-mission policies and expenditures to maximize aggregate achievement of their in-state students subject to the requirement that tuition revenues plus state subsidies cover costs. This objective results in setting a minimum ability threshold for in-state students, and (for realistic parameter values) a higher one for out-of-state students. It is optimal for state universities to admit out-of-state students for two reasons: (i) they pay higher tuition than in-state students, (ii) the higher ability threshold for out-of-state results in admission of out-of-state students who enhance the average peer quality.
ERSS (2017) then use a quantitative version of this model to examine the effects of changes in public funding policies on university enrollment. It is often conjectured that increased demand caused by increases in federal financial aid may induce universities to increase their tuitions, i.e., is only partly passed on to students in terms of reducing their financial need. Adopting a realistic approximation of the provision of federal financial aid in the U.S., the papers analysis suggests that a 25% increase in maximum federal aid increases total enrollment in universities by 6%, mostly among relatively poor students and mainly at public universities. Private universities indeed reduce their institutional aid, increase expenditure on educational inputs, and substitute some high-ability but lower-income students for some higher-income but somewhat less-able students. The policy change leads average private university student tuition costs to rise, but the effects are uneven across student types, and poorer students in fact experience a cost saving. Although the average student costs among all public students fall by a modest amount, the effects also vary by student characteristics.
ERSSZ (2019) use data from the NPSAS to estimate the market equilibrium for the model developed in ERSS (2017). The estimated model includes minority status as a student characteristic, which affects quality of education as a positive externality (e.g., by better preparing all students for a diverse workplace), and studies the implications for tuition pricing. The estimation strategy does not require solving for the equilibrium, and involves the estimation of conditional market shares given in (3), then using them in the estimation of the pricing equation (4). When estimating conditional market shares, the analysis takes into account the fact that a student will be admitted to a subset of universities in equilibrium and predicts the set of alternatives a student is choosing from. The key results of this analysis suggest that pricing by income is prevalent among private universities in the U.S. Specifically, the paper estimates that $10,000 increase in family income increases tuition by $210 to $510 on average. Average university markups, computed as the difference between price and effective marginal cost, range between $750 and $13,200, with higher levels and greater variation in markups characterizing a subset of colleges, particularly the highly selective ones.
5
Product Differentiation in Higher Education Market via
Academic Standards
A distinguishing characteristic of the class of models discussed in the previous section is that education technology does not vary across universities. Differential quality of outcomes obtains because the qualities of inputs, teaching resources and average student ability, do vary. As we could see, these models turn out effective in replicating many stylized features of the US higher education market. In particular, they are able to produce segmentation of the market where universities are ranked by their quality and students are sorted into them according to the academic ability and ability or willingness to pay. The key mechanism, as highlighted by Rothschild and White (1995), is that of tuition price discrimination. If there are no caps on tuition, then this mechanism is in fact sufficient for excluding academically undesirable students out. However, mediocre students with high ability to pay are still eligible and desirable for admission at an elite university thanks to their financial contribution to enhancing teaching resources. Reciprocally, such mediocre students, in this modeling framework, clearly do gain in human capital accumulation from studying at an elite university thanks to the spillovers they would enjoy from superior ability peers.
In contrast, two modeling approaches discussed in this section feature academic mech-anisms where excluding students falling below a colleges set standards plays a key role in determining the quality of the product students receive there. These approaches, employing their respective paradigms of academic standards, offer alternative theories of market segmentation in higher education. Although these recent contributions have not been developed to the point of explicitly incorporating tuition policies and other resource related characteristics of university operation and competition, they do offer a proof of concept, particularly in demonstrating the emergence of school reputation and curricular standards as sorting mechanisms resulting in segmentation along the selectiv-ity axis. They also help gain insights into the observed trends of diverging selectivselectiv-ity of colleges in the U.S.
MacLeod and Urquiola (2015) develop a signaling model based on reputations of individual colleges as indicators of quality. This means that a graduates job market valuation is determined by the perceived quality of the college she attended. College reputation is in turn based on the average quality (“skills”) of its graduates, which it manages by means of admission standards. The average skill level of a specific colleges graduates is also the main basis for wage determination by employers, as they lack information about individual skill levels. This implies the following incentive structure: any student wishes to gain admission to as selective a school as possible, whereas each school, defined by its pool of admitted students, has anex post interest in more stringent admission standards to raise the pool’s average quality.
In the model, where all variables are presented in log terms, true individual ability of potential student i, which remains unobserved, follows ai N(, σ2). Potential students