Research Paper
Design Fatigue Lives of Polypropylene Fibre Reinforced Polymer
Concrete Composites
Raman Bedi
a,*, S P Singh
b, Rakesh Chandra
aa Department of Mechanical Engineering, Dr B R Ambedkar National Institute of Technology, Jalandhar, INDIA b
Department of Civil Engineering, Dr B R Ambedkar National Institute of Technology, Jalandhar, INDIA
A R T I C L E I N F O Article history: Received : 21 April 2014 Revised : 19 July 2014 Accepted : 23 July 2014 Keywords: Fatigue
Polymer Concrete Composites Weibull Distribution Design Fatigue Life
A B S T R A C T
Flexural fatigue behavior of Poly-propylene fibre reinforced polymer concrete composites (PFRPCC) has been investigated at various stress levels and the statistical analysis of the data thus obtained has been carried out. Polymer Concrete Composite (PCC) samples without addition of any type of fibres were also tested for flexural fatigue. Forty specimens of PCC and One hundred and Forty One specimens of PFRPCC containing 0.5%, 1.0% and 2.0% polypropylene fibres were tested in fatigue using a MTS servo controlled test system. Fatigue life distributions of PCC as well as PFRPCC are observed to approximately follow a two parameter Weibull distribution with correlation coefficient exceeding 0.9. The parameters of the Weibull distribution have been obtained by various methods. Failure probability, which is an important parameter in the fatigue design of materials, has been used to obtain the design fatigue lives for the material. Comparison of design fatigue life of PCC and PFRPCC has been carried out and it is observed that addition of fibres enhances the design fatigue life of PCC.
1
Introduction
Polymer concrete composites (PCC) had been developed as alternative materials for construction industry in early 1960’s wherein its early usage has been reported for building cladding etc. Later on because of rapid curing, excellent bond to cement concrete and steel reinforcement, high strength and durability, these were extensively used as repair material. Further, Precast Polymer concrete has been used to produce a variety of products like acid tanks, manholes, drains, highway median barriers etc[1].Use of PCC in machine tool applications has been reported since late 70’s wherein these have been used to replace materials including metals like cast iron for machine tool bases[2–5]. Lot of research has been
* Corresponding author. Tel.: +91 9815981054.
E-mail address: bedir@nitj.ac.in
reported on the mechanical properties of polymer concrete composite in the last few decades. Properties like compressive strength, flexural strength, split tensile strength, damping have been evaluated to a great extent for these materials [6–10].
Addition of glass fibres, steel fibres, carbon fibres etc. is reported to enhance the mechanical properties of polymer concrete composites and the resulting material is known as fibre reinforced polymer concrete composite (FRPCC) [11–13]. The use of PCC in machine construction calls for evaluation of the fatigue performance of the material, which till date has been studied to a very limited extent [14–16]. Large variability usually exists in the fatigue strength/life results obtained through experimental investigations at a given stress level, even under carefully controlled test procedures. The same was taken care of by providing higher safety factors earlier. However, optimum design these days requires accurate characterization of this variability for the materials. The dispersion of fatigue life has, therefore, been a subject of statistical analysis by various researchers[17–20].As per the knowledge of the authors, no study has been reported on the fatigue behavior of FRPCC. The present investigation was therefore planned to evaluate the fatigue behavior of fibre reinforced polymer concrete composites, FRPCC. The results reported in this paper are a part of a comprehensive investigation underway at the author’s institute to study the effect of fibre addition in PCC on their fatigue performance.
2
Experimental Procedure
Epoxy resin, LAPOX- B47 along with hardener LAPOX- K46 supplied by M/s Atul Ltd., Mumbai has been used in this investigation. The hardener and resin have been mixed in the ratio of 1:2 by weight. Resin dosage of 10-14% by weight of PCC has been reported in literature when using coarse aggregates [21,22] whereas higher resin dosages up to 20% have reported when using only sand as aggregate material[8]. Resin dosage of 12% by weight of PCC has been used in this investigation. Aggregate grading plays an important role in the final properties of PCC and therefore an optimized aggregate mix suggested in literature has been used in this study[23]. Locally available crushed gravel has been used as aggregate in PCC. The aggregate mix had been optimized based upon the least void content criteria. A micro filler is also often added to PCC mix to reduce the void content in aggregate mixture and thereby increase the strength of PCC. Fly ash is a byproduct of the coal burning in power plants and is used as a filler because of its easy availability and because its usage in PCC is reported to yield better mechanical properties as well as reduced water absorption[24]. Addition of fly ash also improves the workability of fresh PCC mix resulting in products with excellent surface finish[25]. F-type fly ash has been used in the ratio of 10% by total weight of PCC in this study.
Macro-Monofilament type synthetic poly-propylene fibres of average length 12 mm were added into PCC. The fibre dosage was kept at 0.5%, 1.0% and 2.0% by weight of PCC. The workability of the PCC and PFRPCC mix is an important parameter, as a good workability will ensure proper filling of the molds and will also result in less internal voids in the material. Increasing the amount of resin used in manufacture of PCC/PFRPCC improves the workability and its flow. The polymer binder, however, is the most expensive constituent and hence increasing its proportion makes PCC/PFRPCC more expensive. Generally, it is recommended to use enough resin, to produce the minimum degree of workability which is
acceptable. There are no specified workability tests for PCC and PFRPCC mixes. Vee-Bee consistometer test as per
IS-1199:1959, which determines the time required for transforming by vibration fresh concrete in the shape of a conical frustum into a cylinder, was used to evaluate the consistency and workability of PCC and PFRPCC mixes. It is observed that the time taken by the mix to fully settle down increases with increase in the fibre content in the mix. Although, no guidelines for Vee-Bee Time test for PCC/PFRPCC are available in literature, sufficient workability was observed for all the mixes evaluated in this investigation for the aggregate mix, resin content, fly ash content and fibre contents stated in Table-1.
Details of the materials used in this study are provided in Table-1.The specimens of 40x40x160 mm size were cast on a vibratory table using the materials listed above. The specimen size has been chosen as per RILEM PC-2 –TC113 and has been used by a number of researchers in their work on polymer concrete[8,9]. Aggregate material and fly ash was dried before preparation of samples to reduce moisture content below 0.5 % as it has been reported that moisture content of aggregates has a deleterious effect on the properties of polymer concrete[26]. The specimens were cured at room temperature for 7 days before conducting the fatigue tests as per method adopted by a number of other researchers[27–29].
Table 1- Materials used for PCC and PFRPCC Aggregate ( Crushed Gravel )
Particle Size (mm) Quantity ( % of total aggregate weight)
4.76- 9.52 39.6%
2.38-4.36 33.5%
0.15- 0.3 26.9%
Resin & Hardener system
Description Quantity (% of total weight of PCC)
(LAPOX- B47 & K-46) 12 %
Micro filler
Description Quantity (% of total weight of PCC)
F –Type Fly Ash 10%
Fibre Reinforcement
Description Quantity (% of total weight of PCC)
Macro Monofilament poly-propylene fibres 0.5%, 1.0%, 2.0%
The estimation of static flexural strength (fr) of the test material is a pre-requisite for the selection of maximum and
minimum loads to be applied in particular fatigue test. The static flexural strength of the PFRPCC specimens was, therefore, evaluated prior to fatigue testing using MTS servo controlled test system at a loading rate of 0.5 mm/min, which is used by some of the previous investigators [18-19]. Generally, 4-5 specimens from a particular batch were randomly selected and tested to determine their static flexural strength. An average static flexural strength of 27 MPa was obtained for PFRPCC containing 0.5% fibres. It is observed that the addition of poly-propylene fibres enhances the static flexural strength of PCC to a limited extent. An increase of 9% in static flexural strength is observed by addition of 0.5% fibres by weight when compared to PCC. Further addition of fibres up to 1.0% does not enhance the static flexural strength significantly and an average static flexural strength of 27.5 MPa was achieved for PFRPCC containing 1.0% fibres. The static flexural strength of PFRPCC containing 2.0% fibres is reduced to 24.7 MPa.
Fig. 1 (a) Macro Monofilament Poly-propylene fibres (b) Loading arrangement
All the fatigue tests were carried out on a 100 kN MTS- Cyclic load testing facility in three point bending mode. The loading span was taken as 100 mm. The ratio of minimum fatigue stress to maximum fatigue stress in one cycle of loading in a fatigue test is defined as the stress ratio Rand was maintained at 0.1 in all the fatigue tests. The fatigue tests were carried out at a frequency of 10 Hz and constant amplitude, sinusoidal, non-reversed loads were applied. The minimum
fatigue stress (fmin) and maximum fatigue stress (fmax) to be applied on test specimen was selected from fr and a particular
stress level ‘S’ (fmax/fr). For each mix, the first test was conducted at the highest possible stress level and the number of
cycles to failure was noted as fatigue life ‘N’. Subsequent tests were conducted by lowering the stress levels in a systematic manner. Since fatigue testing is a time consuming and expensive process and a large number of specimens were proposed
to be tested, an upper limit of number of cycles to be applied was fixed depending upon the availability of testing equipment and time constraints. A particular test was terminated as and when the failure of the specimen occurred or the upper limit was reached, which ever was earlier. Fig. 1 presents the details of the loading arrangement and a view of the macro polypropylene fibres used in this investigation.
3
Analysis of Fatigue Life Data
The complete fatigue life data obtained at various stress levels for PCC is provided elsewhere by the authors [30] and for PFRPCC having 0.5%, 1.0% and 2.0% weight fraction of fibres is listed in ascending order in Table 2, 3 and 4 respectively. Some data points in fatigue life data deserve consideration for rejection as outliers. Chauvenet’s criterion [31]was applied to the data points at all the stress levels tested in this investigation, and data points meeting this criterion for rejection were identified and excluded from further analysis.
Table 2- Fatigue life data for PFRPCC-0.5% Table 3 - Fatigue life data for PFRPCC-1.0%
S= 0.85 S= 0.8 S= 0.75 S= 0.7 S= 0.85 S= 0.8 S= 0.75 S= 0.7 5088 1806* 60023 153452 7789 95* 123565 201326 7021 17612 87903 182345 7852 35382 149862 295623 9954 20438 136458 245784 8526 45325 154781 345625 11931 39974 165874 392145 9347 55367 200356 402351 12351 40124 170267 524876 12451 55559 207461 463589 13214 46299 172367 752318 14633 67096 260177 736324 16134 47129 196325 812019 16836 73529 367834 869247 19232 55101 237737 862546 17905 77851 498657 1133565 19703 65235 325445 985357 21199 118677 656834 1326546 19841 70124 434540 1102489 28193 158954 698652 1632581 -- 80163 -- 2000000** -- 175301 -- 2000000**
* Rejected as Outlier by Chauvenet’s criteria, not included in analysis * Rejected as Outlier by Chauvenet’s criteria, not included in analysis ** Run out, not considered in analysis ** Run out, not considered in analysis
Table 4 – Fatigue life data for PFRPCC- 2.0% S= 0.85 S= 0.8 S= 0.75 S= 0.7 7033 35628 95258 142038 8547 47723 120325 175623 9865 57072 145265 250382 9956 78658 200382 421539 11617 84807 240526 520152 13237 85629 326080 628405 14252 126562 338038 756214 23220 175684 649115 956203 25624 185647 785624 1425870 27987 232437 800265 1754735 -- 80163 -- 2000000**
* Rejected as Outlier by Chauvenet’s criteria, not included in analysis
The probabilistic analysis of fatigue life data was carried out using a two-parameter Weibull distribution function
which is characterized by a cumulative distribution function (CDF), F (n) as follows:
− − − − = α s o s o f n u n n n P , , exp 1 ) ( (1)
where n = specific value of the random variable N; u = scale parameter or characteristic life at stress level S; α = shape
parameter or Weibull slope at stress level S and no,s= location parameter or minimum life at stress level S.
In fatigue applications, the minimum life no,s can reasonably be assumed equal to zero. Equation (1) thus reduces to the
following form: − − = α u n n F( ) 1 exp (2)
3.1 Analysis of fatigue life data by graphical method
The probability of survival or survivorship function or reliability function, LR(n), may be defined as LR(n) = 1 - F(n),
and substituting this value of F(n) in equation (2) and further taking logarithms, it is modified to:
) ln( ) ln( 1 ln ln n u LR =
α
−α
(3)Equation (3) represents a linear relationship between ln[ln(1/LR)] and ln(n). In order to obtain a graph from (3), the
fatigue-life data corresponding to a particular stress level are first arranged in ascending order of cycles to failure and the
empirical survivorship function LR for each fatigue-life data at a given stress level is obtained from the following
relation[31]: 1 1 + − = k i LR (4)
where i denotes the failure order number and k represents the number of data points in a data sample under
consideration at a particular stress level S.
Fig. 2 Graphical analysis of fatigue life data for PFRPCC-0.5%
-3,0 -2,0 -1,0 0,0 1,0 9,5 10,5 11,5 12,5 13,5 ln [ln (1 /L R )] ln(N) S= 0.8 S= 0.75
The empirical survivorship function in the form of ln [ln(1/LR )] for each fatigue-life data is then plotted on a graph with the corresponding fatigue lives ln(N). If a linear trend is established for the data points, the best fit line is drawn using method of least squares. It can then be assumed that fatigue-life data for that particular stress level follows the two-parameter Weibull distribution. Fig. 2 presents the fatigue life data for few selected stress levels plotted as described above
for PFRPCC-0.5%. The approximate straight line plots in this figure with statistical correlation coefficients “r” exceeding
0.9, indicate that the two-parameter Weibull distribution is a reasonable assumption for the statistical distribution of fatigue-life for PFRPCC-0.5%. Similar results have been obtained for PFRPCC-1.0% and PFRPCC-2.0%, at all the stress levels in this investigation. The estimated parameters thus obtained are listed in Table 5.
Table 5 - Parameters of Weibull distribution for PFRPCC PFRPCC-0.5%
Stress Level, S
Graphical Method Method of Moments Average Values
α u α u α u 0.85 2.152 15560 2.764 15108 2.458 15334 0.80 1.956 56315 2.554 54307 2.255 55311 0.75 1.698 230791 1.872 223880 1.785 227335 0.70 1.342 709720 1.808 676415 1.575 693067 PFRPCC-1.0% Stress Level, S
Graphical Method Method of Moments Average Values
α u α u α u 0.85 2.110 16685 2.294 16335 2.202 16510 0.80 1.808 99653 1.870 97233 1.839 98443 0.75 1.500 384798 1.599 370043 1.550 377421 0.70 1.396 855413 1.568 824716 1.482 840065 PFRPCC-2.0% Stress Level, S
Graphical Method Method of Moments Average Values
α u α u α u
0.85 1.966 17485 2.101 17087 2.033 17286
0.80 1.578 128478 1.740 124604 1.659 126541
0.75 1.254 424143 1.387 405576 1.320 414859
0.70 1.165 801989 1.333 766089 1.249 784039
3.2 Parameter estimation by method of moments
Estimating parameters by method of moments requires estimating the appropriate sample moments, such as sample
mean and sample variance. A simple expression for finding the value of shape parameter α is provided in literature as
follows[32]:
( )
−1.08 = CVα (5)
The characteristic life u can be estimated from (5) by substituting µ for E(n) as follows:
+ = 1 1
α
µ
T u (6)3.3 Estimation of design fatigue life
The fatigue life data obtained in this investigation for PFRPCC witness large scatter. This is usually expected in the fatigue life data even at a given stress level under carefully controlled test procedures. For PCC reinforced with fibres i.e. PFRPCC, this variability in the distribution of fatigue life substantially increases compared to that of plain PCC. The design
fatigue life ND, should be selected such that there is only a small probability that a fatigue failure will occur. Once the
distribution function is determined as above, the design fatigue life ND may be selected corresponding to an acceptable
probability of failure. The design reliability may be expressed as LN [N > ND] = 1 – Pf, in which Pf is the probability of
failure. Thus the design fatigue life ND corresponding to a permissible probability of failure Pf can be obtained from (3) as
follows [19]: α 1 1 1 ln − = f D P u N (7)
Using the average values of the Weibull parameters α and u corresponding to different stress levels for the fatigue life data of PFRPCC as in Table 5, Eq. (7) has been used to calculate the design fatigue lives corresponding to selected
acceptable probabilities of failure (Pf) i.e. 0.01, 0.05, 0.10, 0.15 and 0.25. The calculated design fatigue lives corresponding
to selected probabilities of failure are listed in Table 6. The ‘Design Fatigue Life Curves’ have been generated, using the design fatigue lives for PFRPCC listed in above table and are provided in Fig. 3, 4 and 5 for PFRPCC containing 0.5%, 1.0% and 2.0% fibres respectively.
Table 6 – Design fatigue lives for PCC and PFRPCC
PCC -Design Fatigue Lives ND
Stress Pf = 0.01 Pf = 0.05 Pf = 0.10 Pf = 0.15 Pf = 0.25
0.80 1416 2646 3487 4118 5126
0.75 16656 34494 47574 57734 74508
0.70 17143 45765 70609 91675 129317
0.65 21198 68078 113969 155426 233912
PFRPCC- 0.5% -Design Fatigue Lives ND
Stress Pf = 0.01 Pf = 0.05 Pf = 0.10 Pf = 0.15 Pf = 0.25
0.85 2354 4573 6131 7315 9231
0.80 7192 14818 20390 24711 31833
0.75 17275 43053 64439 82148 113119
0.7 37352 105139 166055 218656 314216
PFRPCC- 1.0% -Design Fatigue Lives ND
Stress Pf = 0.01 Pf = 0.05 Pf = 0.10 Pf = 0.15 Pf = 0.25
0.85 2043 4284 5941 7234 9376
0.80 8069 19577 28956 36651 49998
0.75 19416 55560 88392 116904 168968
0.7 37692 113216 184014 246524 362415
PFRPCC- 2.0% -Design Fatigue Lives ND
Stress Pf = 0.01 Pf = 0.05 Pf = 0.10 Pf = 0.15 Pf = 0.25
0.85 1800 4013 5717 7075 9368
0.80 7920 21142 32619 42351 59741
0.75 12737 43764 75481 104802 161500
Fig. 3 Design fatigue life curves for PFRPCC-0.5%
Fig. 4 Design fatigue life curves for PFRPCC-1.0%
0,68 0,73 0,78 0,83 0,88 1000 10000 100000 S tr es s L ev el , S
Design fatigue Lives, ND
Pf= 0.01 Pf = 0.05 Pf = 0.1 Pf = 0.15 Pf = 0.25 0,68 0,73 0,78 0,83 0,88 1000 10000 100000 S tr es s L ev el , S
Design fatigue Lives, ND
Pf= 0.01 Pf = 0.05 Pf = 0.1 Pf = 0.15 Pf = 0.25
Fig. 5 Design fatigue life curves for PFRPCC-2.0%
Fig. 6 Comparison of design fatigue life for PCC and PFRPCC
The fatigue life curves can be of great use to design engineers while designing for fatigue. Fig. 6 presents the comparison of design fatigue life curves for PCC with PFRPCC containing different amount of fibres. It can be observed that addition of fibres enhances the design fatigue life of the resulting material. The enhancement in design fatigue life is more pronounced up to addition of 0.5% fibres and thereafter with more addition of fibres, the increase in fatigue life is insignificant. This may be attributed to insignificant increase in static flexural strength beyond 0.5% fibre content.
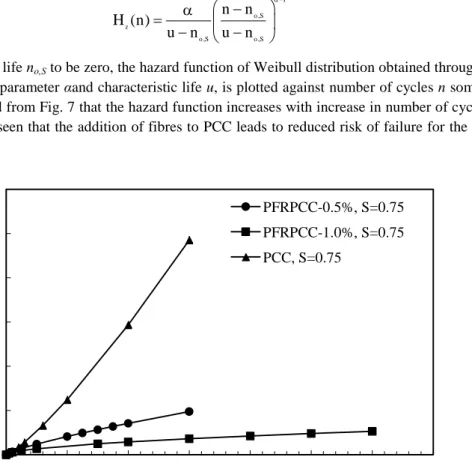
It has been pointed out that the hazard function or risk function of the lognormal distribution, which was extensively used earlier for the statistical description of fatigue data, decreases with increasing life (n) or time, which is in violation of the physical phenomenon of progressive deterioration of engineering materials resulting from fatigue process [33].Thus the physical assumption of hazard function that increases with time leads to the Weibull distribution. It was indicated that the
hazard function of the Weibull distribution increases with time or with an increase in the number of cycles for α>1.0 and
different shapes of the hazard function can be obtained for different values of the shape parameter α[31].
The hazard function of the Weibull distribution is given by the following equation: 0,68 0,73 0,78 0,83 0,88 1000 10000 100000 S tr es s L ev el , S
Design fatigue Lives, ND
Pf= 0.01 Pf = 0.05 0,6 0,65 0,7 0,75 0,8 0,85 0,9 1000 10000 100000 1000000 S tr es s L ev el , S
Design fatigue Lives, ND PCC
1 o ,S z o ,S o ,S n n H (n) u n u n α− − α = − − (8)
Assuming the minimum life no,S to be zero, the hazard function of Weibull distribution obtained through (8) employing
the average values of shape parameter αand characteristic life u, is plotted against number of cycles n some selected cases
in Fig. 7. It can be observed from Fig. 7 that the hazard function increases with increase in number of cycles to failure for all the cases. It can also be seen that the addition of fibres to PCC leads to reduced risk of failure for the same number of cycles as compared to PCC.
Fig. 7 Hazard function of Weibull distribution for selected cases
4
Conclusions
Fatigue life data for polymer concrete composites containing macro mono-filament type poly-propylene fibres has been analysed statistically. It has been observed that the fatigue life distributions at various stress levels for PFRPCC approximately follow a two parameter Weibull distribution. Values of Weibull parameters have been obtained by various methods. It is observed that addition of fibres into PCC enhances the static strength as well as fatigue lives of the resulting material, but this is at the cost of increased variability in fatigue lives. This conclusion is drawn as the values of weibull shape parameter for PFRPCC at various stress levels is lower than those obtained for PCC. Further, fatigue life data has been used for obtain the design fatigue lives for various probabilities of failure and design fatigue life curves have also been generated.
R
EFERENCES[1]- J.J. Fontana, Development and Applications of Various Polymer Concrete Engineering Materials, American
Concrete Institute, 2003.
[2]- M. Weck, R. Hartel, Design, manufacture and testing of precision machines with essential polymer concrete
components, Precis. Eng. 7(1985) 165–170.
[3]- I. Tanabe, K. Takada, A. Nakamura, Thermal and mechanical characteristics of epoxy resin concrete used in
machine tool structures, JSME Int. J. C-Dyn. Con. 56(1990) 1314–1321.
[4]- I. Tanabe, Development of ceramic resin concrete for precision machine tool structures, JSME Int. J. III-Vib. C.
36(1993) 494–498.
[5]- I. Tanabe, K. Takada, Thermal deformation of machine tool structures using resin concrete, JSME Int. J. C-Dyn.
Con. 37(1994) 384–389.
[6]- C. Vipulanandan, N. Dharmarajan, Flexural behavior of polyester polymer concrete, Cement Concrete Res.
0,000000 0,000010 0,000020 0,000030 0,000040 0,000050 0,000060 0 100000 200000 300000 400000 500000 600000 700000 H azar d f u n ct io n Number of Cycles (n) PFRPCC-0.5%, S=0.75 PFRPCC-1.0%, S=0.75 PCC, S=0.75
17(1987) 219–230.
[7]- C. Vipulanandan, N. Dharmarajan, Analysis of Fracture parameters of epoxy-polymer concrete, ACI Mater. J.
86(1989) 383–393.
[8]- A.J.M. Ferreira, C. Tavares, C. Ribeiro, Flexural Properties of Polyester Resin Concretes, J. Polym. Eng. 20(2000)
459–468.
[9]- M.C.S. Ribeiro, C.M.L. Tavares, M. Figueiredo, A.J.M. Ferreira, A.A. Fernandes, Bending characteristics of resin
concretes, Mater. Res. 6(2003) 247–254.
[10]- S. Orak, Investigation of vibration damping on polymer concrete with polyester resin, Cement Concrete Res. 30
(2000) 171–174.
[11]- C. Vipulanandan, S.K. Mantrala, Behavior of Fiber Reinforced Polymer Concrete, in: Proc. Mater. Eng. Conf.,
1996, pp. 1160–1169.
[12]- J.M.L. Reis, A.J.M Ferreira, Fracture behavior of glass fiber reinforced polymer concrete, Polym. Test. 22(2003)
149–153.
[13]- J.M.L. Reis, A.J.M Ferreira, Assessment of fracture properties of epoxy polymer concrete reinforced with short
carbon and glass fibers, Constr. Build. Mater. 18 (2004) 523–528.
[14]- C. Vipulanandan, S. Mebarkia, Fatigue crack growth in polyester polymer concrete, ACI (2001) 153–168 .
[15]- G. Woelfl, M. McNerney, C.J. Chang, Flexural Fatigue of Polymer Concrete, Cement Concrete Aggr. 3(1981)
84–88.
[16]- K. Kobayashi, Y. Ohama, T. Ito, Fatigue Properties of Resin concrete under repeated compression loads, Seisan
Kenkyu, 26 (1974) 116–118.
[17]- S.P. Singh, Y. Mohammadi, S.K. Madan, Flexural fatigue strength of steel fibrous concrete containing mixed steel
fibres, J. Zhejiang Univ. Sci. A. 7 (2006) 1329–1335.
[18]- S.P. Singh, S.K. Kaushik, Flexural Fatigue Analysis of Steel Fiber-Reinforced Concrete, ACI Mater. J. 98(2001)
306–312.
[19]- S.P. Singh, S.K. Kaushik, Flexural Fatigue Life Distributions and Failure Probability of Steel Fibrous Concrete,
ACI Mater. J., 97(2000) 658–667.
[20]- R. Bedi, R. Chandra, Fatigue-life distributions and failure probability for glass-fiber reinforced polymeric
composites, Compos. Sci. Technol. 69(2009) 1381–1387.
[21]- H. Abdel-Fattah, M.M. El-Hawary, Flexural behavior of polymer concrete, Constr. Build. Mater., 13(1999) 253–
262.
[22]- F. Cortés, G. Castillo, Comparison between the dynamical properties of polymer concrete and grey cast iron for
machine tool applications, Mater. Des. 28(2007) 1461–1466.
[23]- M. Muthukumar, D. Mohan, M. Rajendran, Optimization of mix proportions of mineral aggregates using Box
Behnken design of experiments, Cement Concrete Comp. 25(2003) 751–758.
[24]- K.T. Varughese, B.K. Chaturvedi, Fly ash as fine aggregate in polyester based polymer concrete, Cement
Concrete Comp. 18(1996) 105–108.
[25]- J.P. Gorninski, D.C. Dal Molin, C.S. Kazmierczak, Study of the modulus of elasticity of polymer concrete
compounds and comparative assessment of polymer concrete and portland cement concrete, Cement Concrete Res. 34(2004) 2091–2095.
[26]- Y. Ohama, Mix proportions and properties of Polyester Resin Concretes, ACI (1973) 283–294.
[27]- K.H. Rebeiz, Time-temperature properties of polymer concrete using recycled PET, Cement Concrete Comp.
17(1995) 119–124.
[28]- M.E. Tawfik, S.B. Eskander, Polymer Concrete from Marble Wastes and Recycled Poly(ethylene terephthalate), J.
Elastom. Plast. 38(2006) 65–79.
[29]- Y. Ohama, K. Demura, Relation between curing conditions and compressive strength of polyester resin concrete,
Int. J. Cement Compos. Light. Concr. 4(1982) 241–244.
[30]- R. Bedi, R. Chandra, S.P. Singh, Probabilistic Analysis of Fatigue Life of Polymer Concrete, J. Exp. Appl. Mech.
4(2013) 22–28.
[31]- J.B. Kennedy, A.M. Neville, Basic Statistical Methods for Engineers and Scientists, A Dun-Donnelley Publishers,
1986.
[32]- P.H. Wirsching, J.T.P. Yao, Statistical methods in structural fatigue, J. Struc. Div. ASCE 96(1970) 1201–1219.