Laboratory Project for a Software Quality Class
March 29, 2015
Abstract
This document reports the experience of a laboratory course on software quality and is written primarily for instructors as a reference for similar activities. The project aims to teach students the main problems of testing and analyzing software systems and some solutions and tools to cope with the problems.
Contents
1 Target software 3
2 Tools 4
3 Activities and results 6
3.1 Expert judgment . . . 6
3.2 Combinatorial Testing . . . 6
3.3 Random testing . . . 6
3.4 Structural coverage . . . 7
3.5 Failure and faults . . . 7
3.6 Refining the test suites . . . 7
3.7 Structural coverage of the new test suite . . . 7
3.8 Mutation score . . . 8
3.9 Identifying failure and faults . . . 8
Executive summary
This document reports the organisation and lessons learned of a laboratory project, and is written primarily for instructors as a reference experience for similar activities. The material and the results are available for inspection and use.
The laboratory project aims to teach students the main problems of testing and analyzing software systems and some solutions and tools to cope with the problems.
Here we report the work done in a laboratory course by 9 master students attending in parallel a course on software quality based on our book. The project was scheduled on 10 weeks with a two hours working time in class per week and 2-4 additional hours of off-line group work for a total of 50-55 hours of work.
The task was to experiment with different techniques to test a software system (graphstream) seeded with 8 realistic faults that we describe in details in Section 1.
The laboratory was organized as follows:
1. Students were asked to derive test cases based on expert judgement. We gave the stu-dents the documentation and asked them to derive a set of test cases. This serves as a baseline. Students can compare this first test suite with the ones generated with system-atic approaches to understand the differences between the techniques experienced in the laboratory.
2. Students were asked to derive test cases with a combinatorial approach (category parti-tion). This serves to start learning both the difficulty of using a combinatorial approach and the advantages with respect to an expert judgment approach [TOOL USED: GenPair, Feed4JUnint]
3. Students were asked to generate test suites randomly. The goal is to understand the effectiveness of random test case generators [TOOL USED: Randoop]
4. Students were asked to compute structural coverage for the different test suites. The goal is to understand the relation between functional and structural approaches and to evaluate the differences between different test suites from the coverage viewpoint [TOOL USED: EclEmma]
5. Students were asked to identify failures and faults. In this phase, students are asked to identify failures and locate faults using the test suites obtained in the different ways. The goal is to understand the effectiveness of the different approaches and build awareness of the oracle problem.
6. Students were asked to refine the test suites. In this phase, we divided the students in two groups and we asked a group to refine the expert judgment test suite and the other to refine the category partition suite. The test suites generated in the first iteration give the student the baseline to understand the difficulty of generating a good test suite and of applying a systematic approach, in our case category partition. [TOOL USED: GenPair, Feed4JUnint]
7. Students were asked to recompute structural coverage, and compare the results with the previous ones. The goal is to check the improvements that derive from the additional experience of the students with the test case generation techniques in terms of structural coverage [TOOL USED: EclEmma]
8. Students were asked to compute mutation score. The goal is to give students the op-portunity to learn difficulties and advantages of mutation analysis and compare mutation analysis with structural coverage [TOOL USED: Pitclipse]
9. Students were asked to identify failures and faults. The goal is to learn about the relation between mutation score, structural coverage and effectiveness of the test suites, and to compare the test suites according to their ability of revealing failures and providing support to locate faults.
The students were asked to document both the test cases and the test suites, following the standard proposed in the book. In the next section, we present the details of the work with references to the artifacts that include documentation of the test cases, original test cases in JUnit, and reports from the different tools about coverage, motivation score, etc.
In Section 4 we summarize the results of the work and provide some suggestions for the instructors.
1
Target software
For the project we choosed the GraphStream Java library (“core” package, release 1.2), an open source project that provides APIs to generate, modify and analyze graphs. For detailed informations about this software refer to its official website athttp://graphstream-project.org.
The original source code used in the project can be foundhere, and the library APIs docu-mentation can be foundhere.
During the project we focused on the following subset of the library:
• SingleGraph (org.graphstream.graph.implementations.SingleGraph)
• MultiGraph (org.graphstream.graph.implementations.MultiGraph)
• Path (org.graphstream.graph.Path)
In these classes we seeded 8 faults inspiring from real faults found in bug repositories. The source code of the faulty library can be found here. The following list enumerates the faults showing the class they belong to, the original version of the code (ORIG) and the faulty version (FAULT).
1. Path.java
ORIG
172 d += (Double) l.getAttribute(characteristic, Number.class);
FAULT
172 d = (Double) l.getAttribute(characteristic, Number.class);
2. AdjacencyListGraph.java
ORIG
115 if(initialNodeCapacity<DEFAULT NODE CAPACITY)
116 initialNodeCapacity = DEFAULT NODE CAPACITY;
117 if(initialEdgeCapacity<DEFAULT EDGE CAPACITY)
118 initialEdgeCapacity = DEFAULT EDGE CAPACITY;
FAULT These lines have been deleted. 3. AdjacencyListGraph.java
ORIG
181 if(initialNodeCapacity<DEFAULT NODE CAPACITY)
182 initialNodeCapacity = DEFAULT NODE CAPACITY;
183 if(initialEdgeCapacity<DEFAULT EDGE CAPACITY)
184 initialEdgeCapacity = DEFAULT EDGE CAPACITY;
FAULT These lines have been deleted. 4. AbstractGraph.java
370 if(fromNode ==null||toNode ==null) FAULT 370 if(fromNode ==null) 5. AbstractGraph.java ORIG 776 if(!edgeIt.hasNext()) 777 return;
FAULT these lines have been deleted. 6. OneAttributeElement.java ORIG 191 if(attributes.size()>= 1) FAULT 191 if(attributes.size()>= 0) 7. Multinode.java ORIG
71 && (type != O EDGE||etype != I EDGE))
FAULT
71 ||(type != O EDGE||etype != I EDGE))
8. GraphFactory.java ORIG 56 completeGraphClass = ‘‘org.graphstream.graph.implementations.’’ FAULT 56 completeGraphClass = ‘‘org.graphstream.graph.implementations’’
2
Tools
Understanding the importance of automation through the use of tools was one of the main goals of the project, During the laboratory classes the students have used several tools to support the various phases. The tools used in the project are:
Genpairs: to generate test case specifications using the category partition approach
Description Genpairs is a combinatorial test vector generator.
Input: A specification file in a format based loosely on category partition test specifica-tions as originally described by Ostrand and Balcer, and as presented in the book by Pezz`e & Young, chapter 11.
Output: Either a table or a CSV file containing the generated combinations.
Link: The tool, the input syntax, and the several possible options can be foundhere.
Comments: The students reported some inconsistent results in case of values with mul-tiple properties.
Alternative tools: A set of alternative tools, both commercial and free, can be found at: http://www.pairwise.org/tools.asp
Feed4JUnit: to execute parameterized unit test library
Description Feed4Junit executes parameterized unit tests automatically. This tool can be used to speed up the generation of test cases with similar structure but different inputs.
Input: Either a CSV or an Excel file that contains the parameter values, and a parame-terized JUnit test case.
Link: http://databene.org/feed4junit.html
Comments: The students reported several problems in the setup of the tool.
Alternative tools: https://code.google.com/p/junitparams/
Randoop: to generate test cases randomly
Description Randoop generates test input for Java randomly. The user can define a deadline to limit the amount of time the tool should run or the number of test cases it should create. It runs the test cases on all the classes.
Input: A class or a set of classes.
Output: A set of test cases.
Link: http://randoop.googlecode
Comments: The students reported random crashes in Eclipse when the tool was executed with a time limit greater than 60 seconds.
Alternative tools: EvoSuite
EclEmma: to measure structural coverage
Description EclEmma is an Eclipse plugin that computes structural coverage.
Input: A set of JUnit test cases.
Output: An HTML report with both statement and branch coverage.
Link: http://www.eclemma.org
Comments: No particular problem or limitation reported.
Alternative tools: http://ecobertura.johoop.de/,http://codecover.org/
Pitclipse: to perform mutation analysis
Description Pitclipse is an Eclipse plugin to perform mutation analysis.
Input: A set of test cases.
Output: An HTML report with per class mutation score.
Link: http://pitest.org
Comments: Pitclipse is not compatible with Feed4JUnit. Moreover, the tool has several major issues, such as lack of isolation among test case executions.
3
Activities and results
In the following we report the results of the activities performed in the project. The references point to the detailed results that are grouped in a directory doc for the documentation and a directory test for the test cases. The documentation is a set of html documents reporting the documentation of the test suite (TS) and of the single test case (TC) in the format suggested in the book. The test cases are Junit test cases.
3.1
Expert judgment
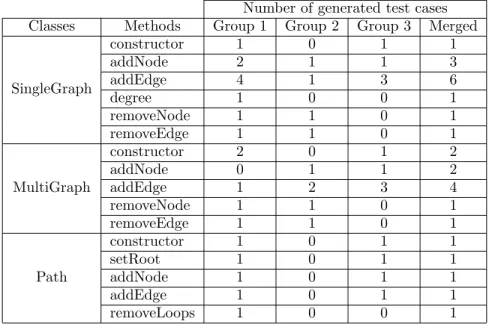
We divided the team in three groups,and we asked each group to derive test cases for the classes and methods under test. We merged the derived test cases in a single test suite (removing duplicated test cases). The final test suite includes 28 test cases (Table 1).
The results of this activity can be found here.
Number of generated test cases Classes Methods Group 1 Group 2 Group 3 Merged
SingleGraph constructor 1 0 1 1 addNode 2 1 1 3 addEdge 4 1 3 6 degree 1 0 0 1 removeNode 1 1 0 1 removeEdge 1 1 0 1 MultiGraph constructor 2 0 1 2 addNode 0 1 1 2 addEdge 1 2 3 4 removeNode 1 1 0 1 removeEdge 1 1 0 1 Path constructor 1 0 1 1 setRoot 1 0 1 1 addNode 1 0 1 1 addEdge 1 0 1 1 removeLoops 1 0 0 1
Table 1: Test cases generated with expert judgment.
3.2
Combinatorial Testing
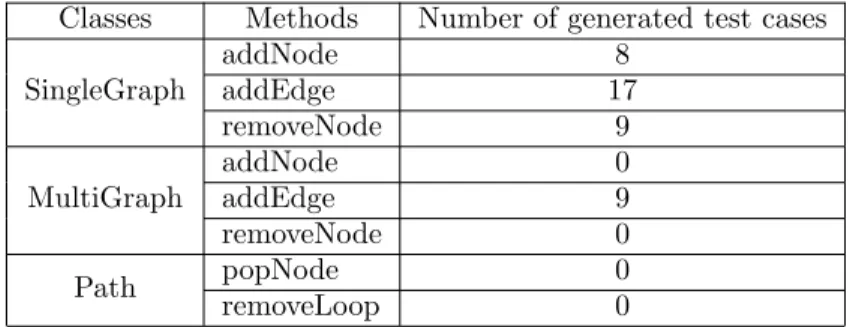
The students worked all together to identify categories, values and constraints according to the category partition approach. Students used Genpairs to automatically derive new test cases from the categories.
The students learned that Genpairs does not always handle the constraints in the proper way, thus, they manually removed the infeasible combinations. The students focused on the classes
SingleGraph andMultiGraph, ignoring the classPath (Table 2). The results of this activity can be foundhere.
3.3
Random testing
The students used Randoop to randomly generate test cases for the classes under test. They generated 4527 test cases. Most of the generated test cases were not runnable because of a bug in Randoop, but the remising were still too many to be inspected manually.
Classes Methods Number of generated test cases SingleGraph addNode 8 addEdge 17 removeNode 9 MultiGraph addNode 0 addEdge 9 removeNode 0 Path popNode 0 removeLoop 0
Table 2: Test cases generated with category partition.
3.4
Structural coverage
The students calculated statement and branch coverage of the generated test suites with EclEmma (Table 3). The results of this activity can be foundhere.
Coverage
Unit Expert Category Partition Random
Statement Branches Statement Branches Statement Branches
AbstractGraph 29 26 27 34 86 80 AbstractElement 4 1 5 3 75 70 AdjacencyListNode 38 29 16 10 74 60 AbstractNode 4 0 4 0 10 0 AdjacencyListGraph 65 25 35 17 100 100 MultiNode 51 17 30 11 61 22 AbstractEdge 42 31 38 44 45 44 SingleNode 87 59 45 23 94 86
MultiGraph 100 n.a. 79 n.a. 100 n.a.
SingleGraph 100 n.a. 100 n.a. 100 n.a.
AdjacencyListNode 0 0 0 0 89 79
SingleNodeTwoEdges 100 n.a. 100 n.a. 100 n.a.
Path 43 53 0 0 43 53
IdAlreadyUsedException 0 n.a. 71 n.a. 71 n.a.
Table 3: Structural coverage of the different test suites.
3.5
Failure and faults
The students were asked to execute the test suites ti identify failures and the corresponding faults. At this stage they did not identify any fault.
3.6
Refining the test suites
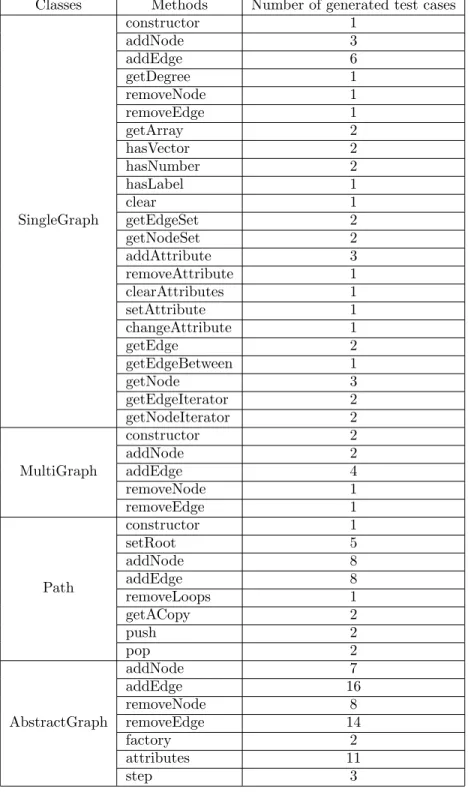
We divided the students in two groups, and we asked a group to refine the expert judgment test suite and the other to refine the category partition suite. This led to new test cases (Tables 4 and 5).
The results of this activity can be foundhere(combinatorial testing) andhere(expert judge-ment).
3.7
Structural coverage of the new test suite
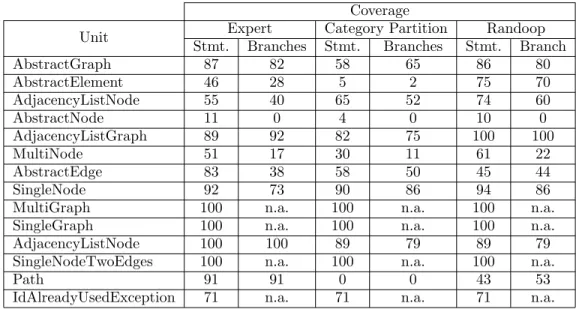
The students computed the structural coverage of the new test suites (Table 6). The results of this activity can be found here.
Classes Methods Number of generated test cases SingleGraph constructor 1 addNode 3 addEdge 6 getDegree 1 removeNode 1 removeEdge 1 getArray 2 hasVector 2 hasNumber 2 hasLabel 1 clear 1 getEdgeSet 2 getNodeSet 2 addAttribute 3 removeAttribute 1 clearAttributes 1 setAttribute 1 changeAttribute 1 getEdge 2 getEdgeBetween 1 getNode 3 getEdgeIterator 2 getNodeIterator 2 MultiGraph constructor 2 addNode 2 addEdge 4 removeNode 1 removeEdge 1 Path constructor 1 setRoot 5 addNode 8 addEdge 8 removeLoops 1 getACopy 2 push 2 pop 2 AbstractGraph addNode 7 addEdge 16 removeNode 8 removeEdge 14 factory 2 attributes 11 step 3
Table 4: New expert judgment test suite.
3.8
Mutation score
The students calculated the mutation score with Pitclipse. The results of this activity can be found here.
3.9
Identifying failure and faults
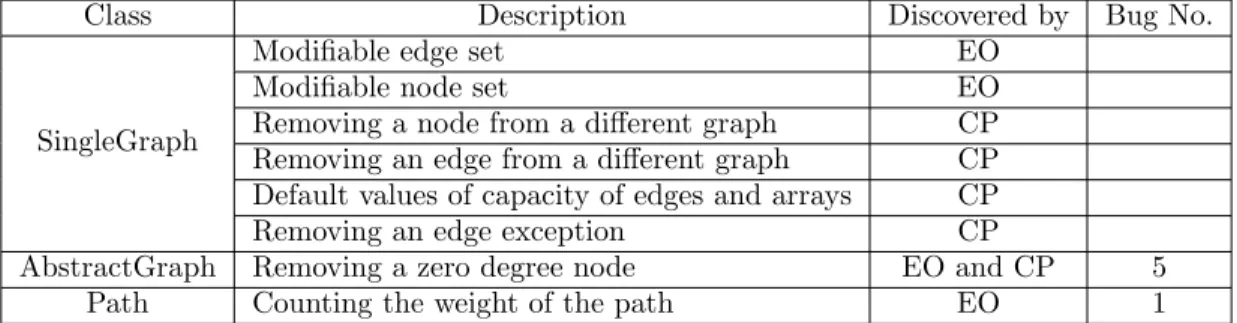
The students identified failures and faults in the code using their test suites. They identified two out of the eight seeded faults and 6 additional faults present in in the software.
Classes Methods Number of generated test cases SingleGraph addNode 7 addEdge 29 removeNode 5 removeEdge 36 constructor 17 MultiGraph addNode 0 addEdge 9 removeNode 9 Path popNode 0 removeLoop 0
Table 5: New category partition test suite. Coverage
Unit Expert Category Partition Randoop
Stmt. Branches Stmt. Branches Stmt. Branch
AbstractGraph 87 82 58 65 86 80 AbstractElement 46 28 5 2 75 70 AdjacencyListNode 55 40 65 52 74 60 AbstractNode 11 0 4 0 10 0 AdjacencyListGraph 89 92 82 75 100 100 MultiNode 51 17 30 11 61 22 AbstractEdge 83 38 58 50 45 44 SingleNode 92 73 90 86 94 86
MultiGraph 100 n.a. 100 n.a. 100 n.a.
SingleGraph 100 n.a. 100 n.a. 100 n.a.
AdjacencyListNode 100 100 89 79 89 79
SingleNodeTwoEdges 100 n.a. 100 n.a. 100 n.a.
Path 91 91 0 0 43 53
IdAlreadyUsedException 71 n.a. 71 n.a. 71 n.a.
Table 6: Structural coverage of the new category partition test suites.
Unit Mutation Score
AbstractGraph 53% AbstractElement 12% AdjacencyListNode 22% AbstractNode 2% AdjacencyListGraph 51% MultiNode 0% AbstractEdge 47% SingleNode 39% MultiGraph 0% SingleGraph 100% AdjacencyListNode 0% SingleNodeTwoEdges 0% Path 0% IdAlreadyUsedException 0% Table 7: Mutation score percentage by class.
The faults they identified and the methods they used to identify them (either Expert opinion (EO) or Category partition (CP)) are summarized in Table 8.
Class Description Discovered by Bug No.
SingleGraph
Modifiable edge set EO
Modifiable node set EO
Removing a node from a different graph CP Removing an edge from a different graph CP Default values of capacity of edges and arrays CP
Removing an edge exception CP
AbstractGraph Removing a zero degree node EO and CP 5
Path Counting the weight of the path EO 1
Table 8: Discovered faults.
4
Final considerations
The first activities (generating test cases according to expert judgment and using category partition) indicate that the students were not good testers and that using category partition is more difficult than expected. The test suites were quite small and the identified categories and values were not covering all cases. The limits of the generated test suites were confirmed in the third and fifth step, resulting in a suboptimal mutation score, but most important not able to reveal any of the seeded faults.
The experience with automatic random generation of test cases (activity 4) resulted in an enormous amount of test case unable to identify any of the seeded faults, with results difficult to analyze and the notification of a lot of uninteresting faults.
The experience with category partition increased the awareness of the requirements about generating test cases, and the second suite generated following expert judgment was much more thorough that the first one. Similarly, an open discussion on how to improve the use of category partition produced much better results, as indicated by the last three steps, coverage and mutation score increased, but more notably they were able to reveal some real failures with both expert and category test suites due both to the thoroughness of the test cases and the effectiveness of test oracles. In particular, the test suite generated using category partition was able to reveal most of the seeded faults, more than the test suite generated by experts and in both cases more than the test suite generated randomly.
During the project the students were able to understand the difficulty of test activities and the involved costs, were able to appreciate a systematic approach and the limits of random testing, and could see the oracle problem.
The use of tools has been important. Not all tools behaved as expected and some cre-ated small problems, nevertheless the students could clearly see that automation is absolutely important for a thorough testing.