Aim To determine the prognostic value of baseline red blood cell distribution width (RDW) in diffuse large B cell lymphoma (DLBCL) patients.
Methods Data from 81 DLBCL patients diagnosed from 2006 to 2013 at the University Hospital Center Osijek, Osijek, Croatia, were reviewed. We evaluated disease out-come, overall survival (OS) and event-free survival (EFS), and demographic, clinical and laboratory factors affecting outcome. Univariate analysis and Cox regression analysis were used.
Results Median age of patients was 64 years, 29 were men (35.8%). Higher RDW levels (%) were found in pa-tients with advanced Ann Arbor clinical stage (14.94 ± 1.82 vs 13.55 ± 1.54, P = 0.001) and in those with poor response to therapy (14.94 ± 1.82 vs 13.55 ± 1.54, P = 0.001). Patients with RDW>15% (cut-off was calculated by receiver oper-ating characteristics) had significantly worse OS (median [range], 33 months [20-46] vs 74 months [65-82], P < 0.001) and EFS (27 months [15-40] vs 68 months [59-77], P < 0.001). Cox regression analysis showed that RDW>15% was an independent prognostic factor for OS (HR 3.654, 95% CI 1.128-11.836) and EFS (HR 2.611, 95% CI 1.012-6-739). Conclusion High baseline RDW is an independent prog-nostic marker of poor outcome in patients with DLBCL. RDW could be an easily available and inexpensive marker
for the risk stratification in patients with DLBCL. Received: October 27, 2014
Accepted: July 20, 2015 Correspondence to: Vlatka Periša
Department of Hematology, Clinic of Internal Medicine
University Hospital Centre Osijek Huttlerova 4
31000 Osijek, Croatia [email protected]
Vlatka Periša
1,2, Lada
Zibar
2,3, Jasminka
Sinčić-Petričević
1, Ana Knezović
4,
Igor Periša
5, Jerko Barbić
2,31Department of Hematology, Clinic of Internal Medicine, University Hospital Centre Osijek, Osijek, Croatia
2University Josip Juraj Strossmayer in Osijek, School of Medicine, Osijek, Croatia
3Department of Dialysis, Clinic of Internal Medicine, University Hospital Centre Osijek, Osijek, Croatia
4Community Health Centre Đakovo, Đakovo, Croatia
5Community Health Centre Vinkovci, Vinkovci, Croatia
Red blood cell distribution
width as a simple negative
prognostic factor in patients
with diffuse large B-cell
lymphoma: a retrospective
study
Red cell distribution width (RDW) is analyzed routinely as part of the complete blood count (CBC). It is a measure of heterogeneity of the red blood cell (RBC) size and tradition-ally has played a role in the differential diagnosis of anemia (1). High RDW values are associated with increased mortal-ity in general population and in patients with cardiovas-cular disease, sepsis, acute kidney injury, chronic obstruc-tive pulmonary disease, hepatitis B, and those on chronic dialysis (2-9). There is also evidence of its prognostic val-ue in various malignancies (10-14). A recent study found a strong relation between high RDW and poor survival in patients with lung cancer (15). RDW was also found to be a significant predictor of poor prognosis in patients with malignant mesothelioma (16). In patients with symptom-atic multiple myeloma, elevated RDW values were associ-ated with a higher stage disease according to International Staging System and poor prognosis (17). The mechanism that could explain the relation between RDW and survival or disease activity is not clear, but it is considered that high RDW is caused by chronic inflammation, poor nutritional status, oxidative stress, and age-related diseases that lead to changes in erythropoiesis (2,18-20).
Diffuse large B-cell lymphoma (DLBCL) is the most com-mon group of lymphomas, amounting to 25% of all non-Hodgkin’s lymphomas (NHL) (21). It is a type of aggressive lymphoma that usually affects middle-aged and elderly patients. The distribution of NHL subtypes in Croatia corre-sponds to the European average (22). The most commonly used prognostic index in aggressive NHL is the internation-al prognostic index (IPI) and its variants used in elderly pa-tients (age-adjusted IPI) and in papa-tients treated with ritux-imab (R-IPI) (23,24).
So far, there have been no reports on the prognostic value of RDW in patients with DLBCL. The aim of our study was to determine whether RDW measured at diagnosis was an independent prognostic factor of disease outcome, overall survival (OS), and event-free survival (EFS) in patients with DLBCL.
MethodS
This retrospective study included registry data on 81 pa-tients with histologically verified nodal and extranodal DL-BCL, diagnosed between November 2006 and December 2013 at the tertiary care University Hospital Centre Osijek. The study included patients who were in clinical stage II-IV by Ann Arbor (AA) staging, or IE or I bulky shape, who were initially planned for at least 4 cycles of chemotherapy and
who had complete clinical data. Exclusion criteria includ-ed transforminclud-ed indolent lymphoma and primary DLBCL of the central nervous system (CNS).
The following Demographic characteristics, clinical fea-tures, and laboratory parameters were collected from medical records: AA stage, IPI, B symptoms, comorbidity, serum lactate dehydrogenase (LDH), serum C-reactive pro-tein (CRP), serum albumin, RBC, serum hemoglobin con-centration (Hgb), mean corpuscular volume (MCV), white blood cells count (WBC), platelet count, absolute lympho-cyte count (ALC), serum ferritin, RDW, Eastern Cooperative Oncology Group performance status (ECOG PS), and re-sponse to therapy.
Disease staging was done according to the AA classifica-tion. Performance status was quantified using ECOG. Most of the patients (90%) were treated with standard immuno-chemoterapy: rituximab, cyclophosphamide, doxorubicin, vincristine, and prednisone (R-CHOP) regimen, and others by R-CHOP and CHOP-like regimens.
The outcomes were response to treatment, EFS, and OS. In patients in whom treatment was initiated and completed, the response to the therapy was determined by the Inter-national Working Group response criteria (25). EFS started from the first day of diagnosis to one of the events: disease progression, initiation of another anti-lymphomas treat-ment, relapse, death due to any cause, or until the latest control. OS refereed to period from date of the diagnosis until the date of death due to any cause or to the date of the latest control.
Initial values of RDW and of other laboratory parameters were defined as values obtained within 2 weeks before a front line-treatment. CBC including RDW calculation was determined from whole blood with K2 EDTA or K3 EDTA as an anticoagulant on Adiva 2100 analyzer (Siemens Health-care Diagnostics, Tarrytown, NY, USA). RDW values were categorized based on the reference range in our laborato-ry, which is between 9%-15%, ie, the patients were divided in two groups using the cut-off value of 15%. The cut off value obtained by receiver operating characteristics (ROC) analysis was also 15%.
Statistical analysis
SPSS (version 15.0, SPSS Inc. Chicago, IL, USA) and Med-Calc Statistical Software, version 11.4.2.0 (Ostend, Bel-gium) were used. Variables were tested for
normal-ity using Kolmogorov-Smirnov test. Continuous variables with normal distribution were expressed as mean ± stan-dard deviation (SD) and those with not normal distribution as median and interquartile range (IQR). Categorical vari-ables were compared by χ2 test or Fisher exact test. Two continuous independent variables were analyzed by t test for normally distributed variables and by non-parametric Mann-Whitney U test for not normally distributed vari-ables. More than two independent samples were analyzed using one-way analysis of variance (ANOVA) or Kruskal-Wallis test. Correlation was assessed using Pearson or Spearman test, as appropriate. Survival was analyzed with Kaplan-Meier curves and survival variables were compared with log-rank test. To estimate the predictive value of RDW we used Cox regression univariate and multivariate
analy-sis. ROC analysis was used to determine the cut-off value of RDW for mortality. P value <0.05 was considered statisti-cally significant.
ReSuLtS
The total number of eligible patients with DLBCL was 87. Six patients were excluded (2 who were in AA stage I, 1 due to insufficient clinical data, 1 due to transformed indo-lent lymphoma, and 2 for primary CNS disease). Fifty two patients were women and median age of all patients was 64 years (IQR 52.5-72.5 years). Median RDW was 14.3% (IQR 13.25%-15.55%). There was a significant positive correla-tion between RDW and CRP, IPI, ECOG PS, and clinical stage (rS = 0.388, P < 0.001; rS = 0.551, P < 0.001; rS = 0.284, P = 0.01;
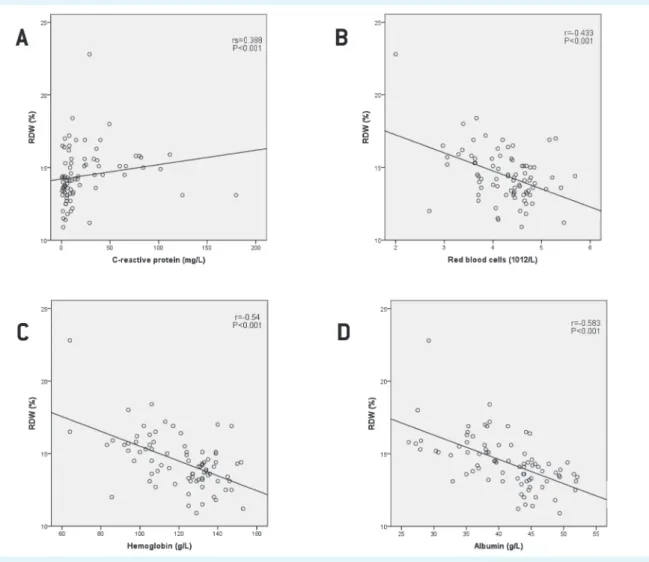
FIguRe 1. Correlation between red blood distribution width (RdW) and (A) C-reactive protein; (B) red blood cells count; (C) hemo-globin concentration; (D) albumin concentration in patients with diffuse large B-cell lymphoma.
rS = 0.384, P = 0.001, respectively) and negative significant correlation between RBC, Hgb, and serum albumin con-centration (r = -0.433, P < 0.001; r = -0.54, P < 0.001; r = -0.583, P < 0.001, respectively) (Figure 1). We found no correlation between RDW and WBC, ALC, platelet count, serum creati-nine, and serum ferritin concentrations. Patients with high-er AA stage (III and IV) had highhigh-er RDW values compared to patients with lower AA stages (stage I and II) (14.94 ± 1.82% vs 13.55 ± 1.54%, P = 0.001, t test, Figure 2).
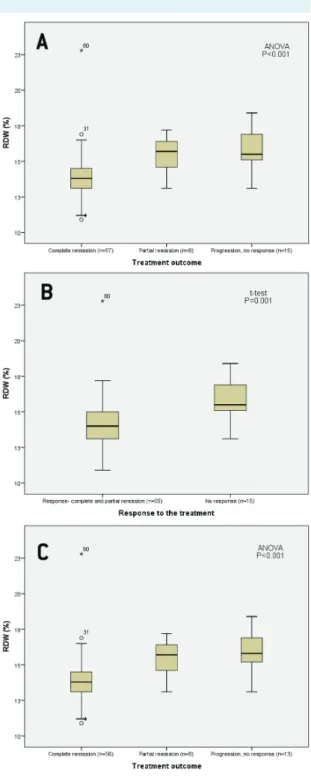
RDW values differed significantly between groups accord-ing to treatment outcome (complete remission vs par-tial remission vs no response-progression, 13.93 ± 1.78 vs 15.46 ± 1.34 vs 15.77 ± 1.47, P < 0.001, ANOVA, Figure 3A). In patients treated with immunochemotherapy (N = 77) RDW values also differed significantly between groups accord-ing to treatment outcome (13.95 ± 1.79 vs 15.46 ± 1.34 vs 15.98 ± 1.44, P < 0.001, ANOVA, Figure 3C). Patients who re-sponded to therapy had lower RDW values than those who did not respond to therapy (13.55 ± 1.54% vs 14.94 ± 1.82%, P = 0.001, t test, Figure 3B).
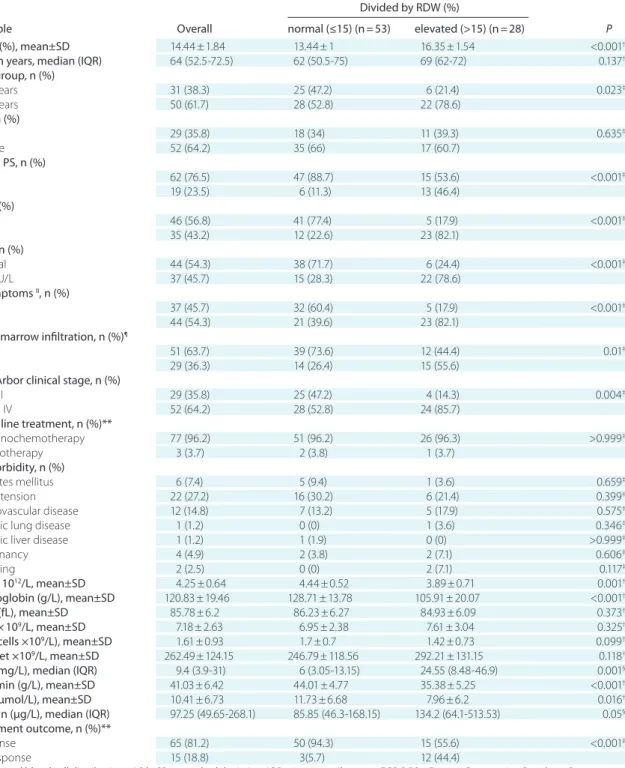
According to both ROC analysis and the reference range for RDW in our laboratory, the patients were divided into two groups. Area under the curve (AUC) for RDW was 0.768 (95% CI 0.661-0.855, Z = 4.724), optimal cut-off value was 15%, with 72.7% sensitivity and 79.7% specificity, P < 0.001 (Figure 4). 53 patients had normal RDW (≤15%) and 28 patients had elevated RDW (>15%). The patients with el-evated RDW had significantly lower ECOG PS (P < 0.001),
FIguRe 2. Baseline red blood cell distribution width (RdW). Pa-tients with diffuse large B-cell lymphoma (N = 81) were divided according to Ann Arbor clinical staging.
FIguRe 3. Baseline red blood cell distribution width (RdW) in patients with diffuse large B-cell lymphoma (dLBCL) (N = 80) (A) according to the treatment outcome and (B) according to response to the treatment; (C) in patients with dLBCL treated with immunochemotherapy according to the treatment outcome (N = 77).
tABLe 1. Patient baseline characteristics (overall and divided according to 15% RdW cutoff)* divided by RdW (%)
Variable overall normal (≤15) (n = 53) elevated (>15) (n = 28) P
RdW (%), mean±Sd 14.44 ± 1.84 13.44 ± 1 16.35 ± 1.54 <0.001†
Age in years, median (IQR) 64 (52.5-72.5) 62 (50.5-75) 69 (62-72) 0.137†
Age group, n (%) ≤60 years 31 (38.3) 25 (47.2) 6 (21.4) 0.023‡ >60 years 50 (61.7) 28 (52.8) 22 (78.6) Sex, n (%) male 29 (35.8) 18 (34) 11 (39.3) 0.635‡ female 52 (64.2) 35 (66) 17 (60.7) eCog PS, n (%) <2 62 (76.5) 47 (88.7) 15 (53.6) <0.001‡ ≥2 19 (23.5) 6 (11.3) 13 (46.4) IPI, n (%) ≤2 46 (56.8) 41 (77.4) 5 (17.9) <0.001‡ >2 35 (43.2) 12 (22.6) 23 (82.1) Ldh, n (%) normal 44 (54.3) 38 (71.7) 6 (24.4) <0.001‡ >241 U/L 37 (45.7) 15 (28.3) 22 (78.6) B symptoms II, n (%) no 37 (45.7) 32 (60.4) 5 (17.9) <0.001‡ yes 44 (54.3) 21 (39.6) 23 (82.1)
Bone marrow infiltration, n (%)¶
no 51 (63.7) 39 (73.6) 12 (44.4) 0.01‡
yes 29 (36.3) 14 (26.4) 15 (55.6)
Ann Arbor clinical stage, n (%)
I and II 29 (35.8) 25 (47.2) 4 (14.3) 0.004‡
III and IV 52 (64.2) 28 (52.8) 24 (85.7)
Front line treatment, n (%)**
immunochemotherapy 77 (96.2) 51 (96.2) 26 (96.3) >0.999‡ chemotherapy 3 (3.7) 2 (3.8) 1 (3.7) Comorbidity, n (%) diabetes mellitus 6 (7.4) 5 (9.4) 1 (3.6) 0.659‡ hypertension 22 (27.2) 16 (30.2) 6 (21.4) 0.399‡ cardiovascular disease 12 (14.8) 7 (13.2) 5 (17.9) 0.575‡
chronic lung disease 1 (1.2) 0 (0) 1 (3.6) 0.346‡
chronic liver disease 1 (1.2) 1 (1.9) 0 (0) >0.999‡
malignancy 4 (4.9) 2 (3.8) 2 (7.1) 0.606‡ bleeding 2 (2.5) 0 (0) 2 (7.1) 0.117‡ RBC × 1012/L, mean±Sd 4.25 ± 0.64 4.44 ± 0.52 3.89 ± 0.71 0.001† hemoglobin (g/L), mean±Sd 120.83 ± 19.46 128.71 ± 13.78 105.91 ± 20.07 <0.001† MCV (fL), mean±Sd 85.78 ± 6.2 86.23 ± 6.27 84.93 ± 6.09 0.373† WBC × 109/L, mean±Sd 7.18 ± 2.63 6.95 ± 2.38 7.61 ± 3.04 0.325†
ALC (cells ×109/L), mean±Sd 1.61 ± 0.93 1.7 ± 0.7 1.42 ± 0.73 0.099†
Platelet ×109/L, mean±Sd 262.49 ± 124.15 246.79 ± 118.56 292.21 ± 131.15 0.118†
CRP (mg/L), median (IQR) 9.4 (3.9-31) 6 (3.05-13.15) 24.55 (8.48-46.9) 0.001§
Albumin (g/L), mean±Sd 41.03 ± 6.42 44.01 ± 4.77 35.38 ± 5.25 <0.001†
Iron (µmol/L), mean±Sd 10.41 ± 6.73 11.73 ± 6.68 7.96 ± 6.2 0.016†
Ferritin (µg/L), median (IQR) 97.25 (49.65-268.1) 85.85 (46.3-168.15) 134.2 (64.1-513.53) 0.05§
treatment outcome, n (%)**
response 65 (81.2) 50 (94.3) 15 (55.6) <0.001‡
no response 15 (18.8) 3(5.7) 12 (44.4)
*RdW – red blood cell distribution width; Sd – standard deviation; IQR – interquartile range; eCog PS – eastern Cooperative oncology group performance status; IPI – International prognostic index; Ldh – lactate dehydrogenase; RBC – red blood cells; MCV – mean corpuscular volume; WBC – white blood cells; ALC – absolute lymphocyte count; CRP – C-reactive protein.
†t test. ‡χ2 test.
§Mann-Whitney u test. IIfever, night sweat, weight loss.
¶in one patient there was no information about bone marrow infiltration.
higher AA stage (P = 0.004), higher IPI (P < 0.001), higher CRP (P = 0.001), lower RBC (P = 0.001), lower serum Hgb (P < 0.001), lower albumin concentration (P < 0.001), poor-er response to treatment (P < 0.001), more frequent ex-pressed B symptoms (P < 0.001), and had infiltration of bone marrow (P = 0.01), and more often were older than 60 years (P = 0.023). Front line treatment, comorbidity, and serum ferritin concentrations did not differ significantly be-tween the groups (Table 1).
Survival and prognostic factors
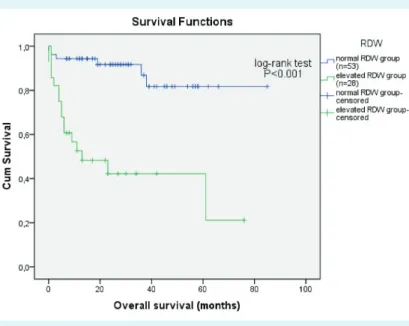
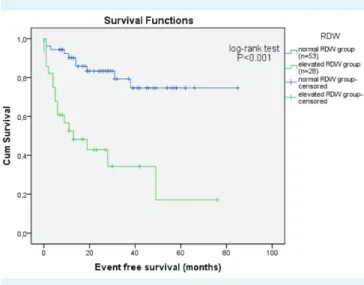
Median follow-up was 22 months (IQR 8.5-37.5 months), 22 (27.2%) patients died, and 27 (33.3%) experienced one of the events. 5-year OS was 67.9% for all patients, signifi-cantly lower in those with elevated RDW (36.6% vs 79.4%, P < 0.001, log-rank test) (Figure 5). Patients with elevated RDW had shorter expected OS than patients with normal RDW (33 months [20-46] vs 74 months [65-82], P < 0.001, log-rank test). 5-year EFS was 55.6% for all patients, signifi-cantly lower in those with elevated RDW (17.1% vs 74.7%, P < 0.001, log-rank test) (Figure 6). Patients with elevated RDW had shorter expected EFS than patients with normal RDW (27 months [15-40] vs 68 months [59-77], P < 0.001, log-rank test). Univariate Cox-regression analysis showed that prognostic factors for OS were elevated RDW level (P < 0.001), age (P = 0.019), sex (male, P = 0.038), high ECOG
PS (≥2, P < 0.001), high IPI (>2, P = 0.001), elevated LDH values (P = 0.002), and high clinical stage (stage III and IV, P = 0.011) (Table 2). Independent prognostic factors for EFS were elevated RDW level (P < 0.001), age (P = 0.006), high ECOG PS (≥2,P = 0.001), high IPI (>2, P < 0.001), elevated LDH values (P = 0.003), and high clinical stage (stage III and IV, P = 0.023) (Table 2). In the multivariate model RDW>15% was found to be an independent prognostic factor of OS (HR 3.654, 95% CI 1.128-11.386, P = 0.031) and EFS (HR 2.611, 95% CI 1.012-6.739) (Table 2). Lower ECOG PS was an independent prognostic factor for OS (HR 3.497, 95% CI 1.265-9.669, P = 0.016).
dISCuSSIoN
This study showed that increased RDW at diagnosis of DLB-CL was associated with poor prognosis. To our knowledge, this is the first report on the prognostic value of RDW in patients with DLBCL. We showed that RDW was an inde-pendent prognostic factor for OS and EFS.
Elevated RDW was associated with poor PS, advanced clinical stage by AA, higher CRP, and lower albumin. The results support the idea that high levels of RDW reflect chronic inflammation and poor nutritional status in pa-tients with DLBCL. Accordingly, there was a positive correlation between RDW and CRP and a negative FIguRe 4. Receiver operating characteristic curve (RoC) of red
cell distribution width (RdW) for differentiating overall survival in patients with diffuse large B-cell lymphoma (dLBCL) (N = 81).
FIguRe 5. Survival curve for overall survival according to baseline red cell distribu-tion width (RdW) (normal ≤15%, elevated >15%) in patients with diffuse large B-cell lymphoma (N = 81).
correlation between RDW and albumin. To our knowledge, no study has investigated the association between malnu-trition and RDW in patients with DLBCL. Therefore, the re-sults of the present study are important, indicating signifi-cant association not only between RDW and CRP but also between RDW and hypoalbuminemia, which is indicative of malnutrition and mortality. It might be that inflamma-tion and malnutriinflamma-tion impair erythropoiesis and thus con-tribute to the increase in RDW. Future studies are needed to elucidate if this, at least in part, explains the nature of the association between mortality and elevated RDW in patients with DLBCL. Earlier research found association be-tween RDW and a variety of inflammatory markers, such
as high sensitive CRP, erythrocyte sedimentation rate, IL-6, soluble transferrin receptor, soluble TNF receptor I, and soluble TNF receptor II (26). In our study, RDW value did not correlate with ferritin concentration. Patients with val-ues of RDW>15% did not have significantly higher value of ferritin. This is an unexpected finding, because ferritin is one of the parameters of inflammation. However, in some patients with impaired liver function ferritin may not be a positive marker of inflammation. Except for albumin serum concentration, we did not analyze liver function. Similarly, in chronic hemodialysis patients significant association of CRP and albumin was found with RDW, but also lacking in correlation between RDW and ferritin (27). We found a positive association between clinical stage according to AA and RDW. This result might also reflect an association between RDW and increased inflammation or malnutrition caused by cancer progression.
Malignant tumors lead to chronic inflammation and mal-nutrition (28). This systemic inflammatory response, which reflects both disease activity and the host’s innate re-sponse to tumor, may explain most symptoms and signs reported by cancer patients, including weight loss, an-orexia, fatigue, and cancer related anemia (29). In different solid tumors, as well as lymphomas, inflammatory markers, including leukocytes, neutrophils, lymphocytes, CRP, and neutrophil/lymphocyte ratio have been associated with higher mortality rates (30-37). The mechanism that could explain the associations of RDW with survival or disease activity has not been elucidated, but possible explanation is that high levels of RDW reflect an underlying inflamma-tory state that impairs erythrocyte maturation and leads to inadequate production of the hormone erythropoietin, FIguRe 6. Survival curve for event free survival according to baseline red
cell distribution width (RdW) (normal ≤15%, elevated >15%) in patients with diffuse large B-cell lymphoma (N = 81).
tABLe 2. univariate and multivariate analysis for overall survival (oS) and event free survival (eFS) in patients with diffuse large B-cell lymphoma (N = 81)* univariate Multivariate oS eFS oS eFS hazard ratio 95% confidence interval P hazard ratio 95% confidence interval P hazard ratio 95% confidence interval P hazard ratio 95% confidence interval P RDW (>15) 7.146 2.758-18.517 <0.001 5.026 2.273-11.113 <0.001 3.654 1.128-11.836 0.031 2.611 1.012-6.739 0.047 Age (year) 1.048 1.008-1.09 0.019 1.051 1.014-1.089 0.006 - - 0.761 - - 0.305 Sex (male) 2.737 1.051-5.652 0.038 - - 0.076 - - 0.14 - - -ECOG PS (≥2) 6.202 2.518-15.278 <0.001 4.195 1.868-9.421 0.001 3.497 1.265-9.669 0.016 - - 0.091 IPI (>2) 7.761 2.613-23.049 <0.001 5.387 2.261-12.835 <0.001 - - 0.374 - - 0.116 LDH (>241 U/L) 4.689 1.727-12.73 0.002 3.491 1.524-7.994 0.003 - - 0.556 - - 0.409 Clinical stage AA (III and IV)
6.623 1.546-28.378 0.011 3.097 1.170-8.203 0.023 - - 0.488 - - 0.974
*RdW – red blood cell distribution width; eCog PS – eastern Cooperative oncology group performance status; IPI – International prognostic index; Ldh – lactate dehydrogenase; AA – Ann Arbor.
undernutrition (ie, deficiencies of nutrients, such as iron, vitamin B12, and folate), or oxidative damage as well as age associated diseases via changes in erythropoiesis (38). Our results are in accordance with findings on important roles of inflammation and malnutrition in tumor progres-sion. Patients with elevated RDW had a poor response to treatment. Chronic inflammation is also reported to lead to an unfavorable response to chemotherapy (39,40). Poor survival in patients with elevated RDW might be due to chronic inflammation itself, or lack of response to chemo-therapy. More research is needed to explain the relation-ships of RDW with inflammation and response to cancer treatment.
Recently, a few studies investigated the prognostic val-ue of RDW in patients with malignant disease. RDW was significantly higher in patients with breast cancer than in patients with fibroadenomas (10). RDW was useful in the differentiation of benign and malignant causes of biliary obstruction when using an optimized cut-off value (11). RDW was a significant prognostic factor in patients with malignant mesothelioma, prostate, lung cancer, and mul-tiple myeloma (15-17,41). Our results are concordant with these findings. It is possible that RDW is a general prognos-tic factor, common in various diseases.
A limitation of the study is its retrospective design and the fact that it was conducted in a single center. The obtained cut-off value should be externally validated within independent cohorts of patients in a preferably prospective study. Our patients underwent heteroge-neous treatment regimens, but when we excluded the patients who were treated only by chemotherapy we confirmed that RDW had prognostic significance for treatment outcome in patients with DLBCL. Despite the limitations, this is the first study showing the prognostic value of RDW in patients with DLBCL with a long follow-up period. In conclusion, RDW could be a new, easily ac-cessible, and inexpensive biomarker for risk assessment in patients with DLBCL.
Acknowledgments The data used in this study were part of the doctoral thesis of the first author.
ethical approval was received from the ethics committees of the Univer-sity Hospital Centre Osijek and Josip Juraj Strossmayer UniverUniver-sity of Osijek, School of Medicine.
declaration of authorship VP designed the study, participated in research, and wrote the first draft of the manuscript. All authors participated in writ-ing of the final draft of the manuscript. LZ supervised the complete clinical research, gave substantial intellectual contribution, assisted with statistical analysis and approved the final version to be published. JSP preformed ex-amination of the patients and gave substantial intellectual contribution. AK
participated in the archive review. IP participated in the archive review. JB gave substantial intellectual contribution.
Competing interests All authors have completed the Unified Competing Interest form at www.icmje.org/coi_disclosure.pdf (available on request from the corresponding author) and declare: no support from any organi-zation for the submitted work except for those clearly stated previously; no financial relationships with any organizations that might have an interest in the submitted work in the previous 3 years; no other relationships or activi-ties that could appear to have influenced the submitted work.
References
1 Weiss g, goodnough Lt. Anemia of chronic disease. N engl J Med. 2005;352:1011-23. Medline:15758012doi:10.1056/NeJMra041809 2 Patel KV, Semba Rd, Ferrucci L, Newman AB, Fried LP, Wallace RB,
et al. Red cell distribution width and mortality in older adults: a meta-analysis. J gerontol A Biol Sci Med Sci. 2010;65:258-65.
Medline:19880817doi:10.1093/gerona/glp163
3 Forhecz Z, gombos t, Borgulya g, Pozsonyi Z, Prohaszka Z, Janoskuti L. Red cell distribution width in heart failure: prediction of clinical events and relationship with markers of ineffective erythropoiesis, inflammation, renal function, and nutritional state. Am heart J. 2009;158:659-66. Medline:19781428doi:10.1016/j. ahj.2009.07.024
4 Felker gM, Allen LA, Pocock SJ, Shaw LK, McMurray JJ, Pfeffer MA, et al. Red cell distribution width as a novel prognostic marker in heart failure: data from the ChARM Program and the duke databank. J Am Coll Cardiol. 2007;50:40-7. Medline:17601544 doi:10.1016/j.jacc.2007.02.067
5 Jo Yh, Kim K, Lee Jh, Kang C, Kim t, Park hM, et al. Red cell distribution width is a prognostic factor in severe sepsis and septic shock. Am J emerg Med. 2013;31:545-8. Medline:23380094 doi:10.1016/j.ajem.2012.10.017
6 oh hJ, Park Jt, Kim JK, Yoo de, Kim SJ, han Sh, et al. Red blood cell distribution width is an independent predictor of mortality in acute kidney injury patients treated with continuous renal replacement therapy. Nephrology, dialysis, transplantation. 2012;27:589-94. Medline:21712489doi:10.1093/ndt/gfr307 7 Seyhan eC, ozgul MA, tutar N, omur I, uysal A, Altin S. Red blood
cell distribution and survival in patients with chronic obstructive pulmonary disease. Journal of Chronic obstructive Pulmonary disease. 2013;10:416-24. Medline:23537076doi:10.3109/15412555 .2012.758697
8 Lou Y, Wang M, Mao W. Clinical usefulness of measuring red blood cell distribution width in patients with hepatitis B. PLoS oNe. 2012;7:e37644. Medline:22649548doi:10.1371/journal. pone.0037644
9 Sicaja M, Pehar M, derek L, Starcevic B, Vuletic V, Romic Z, et al. Red blood cell distribution width as a prognostic marker of mortality in patients on chronic dialysis: a single center, prospective longitudinal study. Croat Med J. 2013;54:25-32. Medline:23444243 doi:10.3325/cmj.2013.54.25
Is red cell distribution width a novel biomarker of breast cancer activity? data from a pilot study. Journal of Clinical Medicine Research. 2013;5:121-6. Medline:23518817
11 Beyazit Y, Kekilli M, Ibis M, Kurt M, Sayilir A, onal IK, et al. Can red cell distribution width help to discriminate benign from malignant biliary obstruction? A retrospective single center analysis. hepatogastroenterology. 2012;59:1469-73. Medline:22683963 12 Baicus C, Caraiola S, Rimbas M, Patrascu R, Baicus A. utility
of routine hematological and inflammation parameters for the diagnosis of cancer in involuntary weight loss. Journal of Investigative Medicine. 2011;59:951-5. Medline:21712730 13 ozkalemkas F, Ali R, ozkocaman V, ozcelik t, ozan u, ozturk h,
et al. the bone marrow aspirate and biopsy in the diagnosis of unsuspected nonhematologic malignancy: a clinical study of 19 cases. BMC Cancer. 2005;5:144. Medline:16262899 doi:10.1186/1471-2407-5-144
14 Spell dW, Jones dV Jr, harper WF, david Bessman J. the value of a complete blood count in predicting cancer of the colon. Cancer detect Prev. 2004;28:37-42. Medline:15041076doi:10.1016/j. cdp.2003.10.002
15 Koma Y, onishi A, Matsuoka h, oda N, Yokota N, Matsumoto Y, et al. Increased red blood cell distribution width associates with cancer stage and prognosis in patients with lung cancer. PLoS oNe. 2013;8:e80240. Medline:24244659doi:10.1371/journal. pone.0080240
16 Abakay o, tanrikulu AC, Palanci Y, Abakay A. the value of inflammatory parameters in the prognosis of malignant mesothelioma. J Int Med Res. 2014;42:554-65. Medline:24573972 doi:10.1177/0300060513504163
17 Lee h, Kong SY, Sohn JY, Shim h, Youn hS, Lee S, et al. elevated red blood cell distribution width as a simple prognostic factor in patients with symptomatic multiple myeloma. BioMed Research International. 2014;2014:145619. Medline:24963470 doi:10.1155/2014/145619
18 douglas SW, Adamson JW. the anemia of chronic disorders: studies of marrow regulation and iron metabolism. Blood. 1975;45:55-65. Medline:803111
19 Ferrucci L, guralnik JM, Woodman RC, Bandinelli S, Lauretani F, Corsi AM, et al. Proinflammatory state and circulating erythropoietin in persons with and without anemia. Am J Med. 2005;118:1288. Medline:16271918doi:10.1016/j. amjmed.2005.06.039
20 hunziker S, Celi LA, Lee J, howell Md. Red cell distribution width improves the simplified acute physiology score for risk prediction in unselected critically ill patients. Crit Care. 2012;16:R89. Medline:22607685
21 Swerdlow Sh, Campo e, harris NL, Jaffe eS, Pileri SA, Stein h, et al. Who classification of tumours of haematopoietic and lymphoid tissues. 4th edt. Lyon: IARC Press; 2008.
22 dominis M. Malignant lymphoma – epidemiological situation in
Croatia. [Cd-RoM] 4th Roche’s oncology weekend. Zagreb: Roche; 2007.
23 A predictive model for aggressive non-hodgkin’s lymphoma. the International Non-hodgkin’s Lymphoma Prognostic Factors Project. N engl J Med. 1993;329:987-94. Medline:8141877 doi:10.1056/NeJM199309303291402
24 Sehn Lh, Berry B, Chhanabhai M, Fitzgerald C, gill K, hoskins P, et al. the revised International Prognostic Index (R-IPI) is a better predictor of outcome than the standard IPI for patients with diffuse large B-cell lymphoma treated with R-ChoP. Blood.
2007;109:1857-61. Medline:17105812doi:10.1182/blood-2006-08-038257
25 Cheson B, Pfistner B, Juweid M, gascoyne R, Specht L, horning S, et al; International harmonization Project on Lymphoma. Revised response criteria for malignant lymphoma. J Clin oncol. 2007;25:579-86. Medline:17242396doi:10.1200/JCo.2006.09.2403 26 Lippi g, targher g, Montagnana M, Salvagno gL, Zoppini
g, guidi gC. Relation between red blood cell distribution width and inflammatory biomarkers in a large cohort of unselected outpatients. Arch Pathol Lab Med. 2009;133:628-32. Medline:19391664
27 tekce h, tekce B, Aktos g, tarisev M, Sit M. the evaluation of red cell distribution width in chronic hemodialysis patients. Int J Nephrol. 2014. Medline:24800077doi:10.1155/2014/754370 28 Mantovani A, Allavena P, Sica A, Balkwill F. Cancer-related
inflammation. Nature. 2008;454:436-44. Medline:18650914 doi:10.1038/nature07205
29 Moore MM, Chua W, Charles KA, Clarke SJ. Inflammation and cancer: causes and consequences. Clin Pharmacol ther. 2010;87:504-8. Medline:20147899doi:10.1038/clpt.2009.254 30 Cao Y, Shi YX, Chen Jo, tan Yt, Cai YC, Luo hY, et al. Serum
C-reactive protein as an important prognostic variable in patients with diffuse large B cell lymphoma. tumour Biol. 2012;33:1039-44.
Medline:22328138doi:10.1007/s13277-012-0337-z
31 Mohri Y, tanaka K, ohi M, Yokoe t, Miki C, Kusunoki M. Prognostic significance of host- and tumor-related factors in patients with gastric cancer. World J Surg. 2010;34:285-90. Medline:19997918 doi:10.1007/s00268-009-0302-1
32 Cox MC, Nofroni I, Laverde g, Ferrari A, Amodeo R, tatarelli C, et al. Absolute lymphocyte count is a prognostic factor in diffuse large B-cell lymphoma. Br J haematol. 2008;141:265-8.
Medline:18353165doi:10.1111/j.1365-2141.2008.07028.x
33 Cox MC, Nofroni I, Ruco L, Amodeo R, Ferrari A, La Verde g, et al. Low absolute lymphocyte count is a poor prognostic factor in diffuse-large-B-cell-lymphoma. Leuk Lymphoma. 2008;49:1745-51.
Medline:18798109doi:10.1080/10428190802226425
34 oki Y, Yamamoto K, Kato h, Kuwatsuka Y, taji h, Kagami Y, et al. Low absolute lymphocyte count is a poor prognostic marker in patients with diffuse large B-cell lymphoma and suggests patients’ survival benefit from rituximab. eur J haematol. 2008;81:448-53.
35 Kim dh, Baek Jh, Chae YS, Kim YK, Kim hJ, Park Yh, et al. Absolute lymphocyte counts predicts response to chemotherapy and survival in diffuse large B-cell lymphoma. Leukemia. 2007;21:2227-30. Medline:17554383doi:10.1038/sj.leu.2404780
36 Porrata LF, Ristow K, habermann tM, Witzig te, Inwards dJ, Markovic SN. Absolute lymphocyte count at the time of first relapse predicts survival in patients with diffuse large B-cell lymphoma. Am J hematol. 2009;84:93-7. Medline:19123458 doi:10.1002/ajh.21337
37 Porrata LF, Ristow K, habermann t, Inwards dJ, Micallef IN, Markovic SN. Predicting survival for diffuse large B-cell lymphoma patients using baseline neutrophil/lymphocyte ratio. Am J hematol. 2010;85:896-9. Medline:20842639doi:10.1002/ajh.21849 38 evans tC, Jehle d. the red blood cell distribution width. J emerg
Med. 1991;9 Suppl 1:71-4. Medline:1955687 doi:10.1016/0736-4679(91)90592-4
39 ho SY, guo hK, Chen hh, Peng CJ. Nutruitional predictors of survival in terminally ill cancer patients. J Formos Med Assoc. 2003;102:544-50. Medline:14569319
40 gibbs J, Cull W, henderson W, daley J, hur K, Khuri SF. Preoperative serum albumin as a predictor of operative mortality and morbidity: results from the National VA Surgical Risk Study. Arch Surg. 1999;134:36-42. Medline:9927128doi:10.1001/archsurg.134.1.36 41 Albayrak S, Zengin K, tanik S, Bakirtas h, Imamoglu A, gurdal
M. Red cell distribution width as a predictor of prostate cancer progression. Asian Pac J Cancer Prev. 2014;15:7781-4.