eScholarship@UMMS
eScholarship@UMMS
Open Access Articles
Open Access Publications by UMMS Authors
2018-05-14
The Role of Race and Economic Characteristics in the
The Role of Race and Economic Characteristics in the
Presentation and Survival of Patients With Surgically Resected
Presentation and Survival of Patients With Surgically Resected
Non-Small Cell Lung Cancer
Non-Small Cell Lung Cancer
John M. Varlotto
University of Massachusetts Medical School Et al.
Let us know how access to this document benefits you.
Follow this and additional works at: https://escholarship.umassmed.edu/oapubs
Part of the Clinical Epidemiology Commons, Epidemiology Commons, Medicine and Health Commons,
Neoplasms Commons, and the Oncology Commons
Repository Citation
Repository Citation
Varlotto JM, McKie K, Voland RP, Flickinger JC, DeCamp MM, Maddox D, Rava P, Fitzgerald TJ, Walsh W, Oliveira P, Rassaei N, Baima J, Uy K. (2018). The Role of Race and Economic Characteristics in the Presentation and Survival of Patients With Surgically Resected Non-Small Cell Lung Cancer. Open Access
Articles. https://doi.org/10.3389/fonc.2018.00146. Retrieved from https://escholarship.umassmed.edu/
oapubs/3481
Creative Commons License
This work is licensed under a Creative Commons Attribution 4.0 License.
This material is brought to you by eScholarship@UMMS. It has been accepted for inclusion in Open Access Articles by an authorized administrator of eScholarship@UMMS. For more information, please contact
Edited by:
Charles A. Kunos, National Cancer Institute (NIH), United States
Reviewed by:
Michael Chan, Wake Forest University, United States Sunyoung Jang, Princeton Radiation Oncology, United States
*Correspondence:
John M. Varlotto john.varlotto@umassmemorial.org
Specialty section:
This article was submitted to Radiation Oncology, a section of the journal Frontiers in Oncology
Received: 25 December 2017
Accepted: 20 April 2018
Published: 14 May 2018
Citation:
Varlotto JM, McKie K, Voland RP, Flickinger JC, DeCamp MM, Maddox D, Rava PS, Fitzgerald TJ, Walsh W, Oliveira P, Rassaei N, Baima J and Uy K (2018) The Role of Race and Economic Characteristics in the Presentation and Survival of Patients With Surgically Resected Non-Small Cell Lung Cancer. Front. Oncol. 8:146. doi: 10.3389/fonc.2018.00146
The role of race and economic
characteristics in the Presentation
and survival of Patients With
surgically resected non-small cell
lung cancer
John M. Varlotto1,2*, Kerri McKie2, Rickie P. Voland3, John C. Flickinger4,
Malcolm M. DeCamp5, Debra Maddox6, Paul Stephen Rava1,2, Thomas J. Fitzgerald1,2,
William Walsh2,6, Paulo Oliveira2,7, Negar Rassaei8, Jennifer Baima2,9 and Karl Uy2,10
1 Department of Radiation Oncology, University of Massachusetts Medical Center, Worcester, MA, United States, 2 University of Massachusetts Medical School, Worcester, MA, United States, 3 School of Nursing, University of Wisconsin, Madison, WI, United States, 4 Department of Radiation Oncology, University of Pittsburgh Medical Center, Pittsburgh, PA, United States, 5 Division of Thoracic Surgery, Northwestern Memorial Medical Center, Chicago, IL, United States, 6 Department of Medical Oncology, University of Massachusetts Medical Center, Worcester, MA, United States, 7 Division of Pulmonary, Allergy and Critical Care Medicine, Worcester, MA, United States, 8 Department of Pathology, Penn State Hershey Medical Center, Hershey, PA, United States, 9 Division of Physical Medicine and Rehabilitation, Worcester, MA, United States, 10 Division of Thoracic Surgery, University of Massachusetts Medical Center, Worcester, MA, United States
Background: Little is understood regarding the inter-relation between economic, marital, and racial/ethnic differences in presentation and survival of surgically resected lung cancer patients. Our investigation will assess these differences in addition to known therapeutic, patient, and histopathologic factors.
Methods: A retrospective review of the Surveillance Epidemiology and End Reporting database was conducted through the years 2007–2012. The population was split into nine different ethnic groups. Population differences were assessed via chi-square testing. Multivariable analysis (MVA) were used to detect overall survival (OS) differences in the total surgical population (TS, N = 35,689) in an ear (T1–T2 < 4 cm N0) surgical popu-lation [early-stage resectable (ESR), N = 17,931]. Lung cancer-specific survival (LCSS) was assessed in the ESR.
results: In the TS population, as compared to Whites, Blacks, and Hispanics pre-sented with younger age, more adenocarcinomas, lower rates of marriage, lower rates of insurance, less stage I tumors, and had less nodes examined, but their type of surgical procedures and OS/LCSS were the same. MVA demonstrated that lower OS and LCSS were associated with males, single/divorced/widowed partnership, lower income (TS only), and Medicaid insurance. MVA also found that Blacks and Hispanics had a similar OS/LCSS to Whites and that all ethnic groups were associated with a similar or better outcomes. The 90-day mortality and positive nodes were correlated with not having insurance and not being married, but they were not associated with ethnicity.
conclusion: In TS and ESR groups, OS was not different in the two largest ethnic groups (Black and Hispanic) as compared to Whites, but was related to single/widowed/ divorced status, Medicaid insurance, and income (TS group only). Nodal positivity was associated with patients who did not have a married partner or insurance suggesting that these factors may impact disease biology. Economic and psychosocial variables may play a role in survival of ear lung cancer in addition to standard histopathologic and treatment variables.
Keywords: lung cancer, surgical resection, socioeconomic status, marital status, racial differences
inTrODUcTiOn
Surgery is the standard treatment option for patients with early-stage, medically operable patients because of its known long-term efficacy (1).
The relationship between patients chosen for surgical therapy and their outcome in relation to economic, insurance, partnership, and racial issues has been infrequently studied. A recent retrospective study using the VA Central Cancer Registry in stage I/II non-small cell lung cancer (NSCLC) from 2001 to 2010 demonstrated that the disparity between Blacks and Whites receiving an operation decreased to similar rates during this time period. Furthermore, there was no survival difference between Black and Whites undergoing an opera-tion, and no lung cancer-specific survival (LCSS) differences between races (2). Using data compiled from 38 state and the District of Columbia population-based cancer registries com-piled by the North American Association of Central Cancer Registries, Sineshaw et al. demonstrated that the receipt of curative-intent surgery varied by state and was lower in blacks than whites in every state (statistically significant in Texas and Florida) (3). Similarly, using the Surveillance Epidemiology and End Reporting (SEER) database from 2007 to 2012, Taioli and Flores noted that even after adjusting by age and insurance status, blacks were less likely to receive surgery, but more likely to receive radiation than white patients (4). However, none of these studies evaluate race in relation to economic, marital, and insurance variables. Nor have these reports analyzed differences in outcome in the many different ethnic groups who are found in the United States.
Because lung cancer screening was shown to be of benefit in 2011 (5) and was approved by CMS in 2015, early-stage resect-able (ESR) NSCLC is expected to increase and result in more lung cancer survivors (6). Therefore, assessing the presentation and outcomes of patients undergoing surgery for NSCLC and inter-relationship of ethnicity in regards to marital, economic, histologic, treatment, and insurance variables will be increasingly important.
The purpose of our study is to investigate the presenting char-acteristics of patients undergoing a definitive surgical procedure in nine different ethnic groups [White non-Hispanic (White), Black, White Hispanic (Hispanic), American Indian/Alaskan native (AI/AN), Chinese, Japanese, Other Asian, South Asian, and Other Race] and to assess prognosis and 90-day mortality for all surgical patients and for those presenting with early-stage,
resectable tumors (ESR, <4 cm without involved nodes). The prognostic importance of race will be determined in a multivariate model that adjusts for known histopathologic and patient-related factors as well as income, marital status, and insurance.
MaTerials anD MeThODs
Data source
Data for this study were taken from the SEER program of the National Cancer Institute, which started to collect and publish cancer incidence and survival data from population-based cancer registries in 1973. The “SEER-18” database used in this study includes registries in Atlanta, Connecticut, Detroit, Hawaii, Iowa, New Mexico, San Francisco-Oakland, Seattle-Puget Sound, Utah, Los Angeles, San Jose-Monterey, Rural Georgia, Greater California, Kentucky, Louisiana, New Jersey, Greater Georgia, and the Alaska Native Tumor Registry (7). Data are available from all cases diagnosed from 2000 and later for these registries. The SEER 18 sites cover approximately 28% of the American population (7).
cohort selection
We included adults, ages who were at least 18 years old and who were diagnosed with histologically proven NSCLC in the SEER-18 database during 2007–2012.
Outcome and presenting characteristics were examined for all surgical patients (TS) (N = 35,689) and patients with presenting with ESR disease (N = 17,931) for whom sufficient information was collected to assess the outcome of treatment in relation to patient, economic, histopathologic, and insurance variables. Patients included in this investigation had NSCLC as their first primary cancer. Only microscopically confirmed tumors using NSCLC codes (8012-8014,8022,8031-8033,8046,8052,8070-8073, 8 0 8 2 , 8 0 8 4 , 8 1 2 3 , 8 1 4 0 , 8 2 0 0 , 8 2 3 0 , 8 2 5 0 - 8 2 5 5 , 8 2 6 0 , 8310,8333,8430,8470,8480-8481,8490,8550,8560,8972,8980) were included in this study.
Only patients undergoing a definitive surgical procedure without pre-operative radiation were included in this analysis. The surgical procedures defined as definitive were as follows: sublobar resection (sublobar resection; segmental resection, including lingulectomy; or wedge resection); and lobectomy or greater (lobectomy or bi-lobectomy, with or without extension to include the chest wall; lobectomy with mediastinal node dissection; extended lobectomy or bi-lobectomy, not otherwise
TaBle 1 | Demographic characteristics of both the TS and early-stage resectable patients. all surgical (N = 35,689) Favorable (N = 17,931) age—years Median 68.0 68.0 sex—no. (%) Female (50.4%) 17,989 (55.1%) 9,882 Male (49.6%) 17,700 (44.9%) 8,693 race—no. (%) White Hispanic (4.98%) 1,779 (4.60%) 823 White non-Hispanic (78.60%) 28,052 (79.60%) 14,273 Black (9.18%) 3,276 (8.42%) 1,509 Chinese (1.59%) 568 (1.61%) 288 Japanese (0.85%) 302 (0.78%) 139 South Asian (0.31%) 112 (0.31%) 56 Other Asian (2.83%) 1,011 (2.96%) 531 Other Race (1.28%) 457 (1.41%) 252 American Indian/Alaskan Native (0.37%) 132 (0.33%) 60
surveillance epidemiology and end reporting registry—no. (%)
Alaska Natives (0.10%) 35 (0.07%) 13
Atlanta (3.05%) 1,090 (2.79%) 501
California excl SF/SJM/LA (19.24%) 6,865 (19.63%) 3,521 Connecticut (5.99%) 2,138 (6.44%) 1,155 Detroit (6.23%) 2,223 (6.40%) 1,148 Greater Georgia (9.45%) 3,374 (9.46%) 1,696 Hawaii (1.54%) 549 (1.56%) 279 Iowa (4.32%) 1,544 (4.10%) 736 Kentucky (9.90%) 3,534 (9.56%) 1,715 Los Angeles (7.64%) 2,728 (7.38%) 1,324 Louisiana (5.54%) 1,977 (5.15%) 924 New Jersey (13.34%) 4,760 (13.92%) 2,496 New Mexico (1.41%) 503 (1.42%) 254 Rural Georgia (0.23%) 83 (0.23%) 42 San Francisco-Oakland (4.47%) 1,594 (4.51%) 809 San Jose-Monterey (2.14%) 762 (1.94%) 347 Seattle (4.08%) 1,457 (4.34%) 779 Utah (1.33%) 473 (1.07%) 192 income—no. (%) <50k (29.84%) 10,649 (28.67%) 5,140 50k–74k (52.88%) 18,871 (53.40%) 9,575 ≥75k (17.29%) 6,169 (17.94%) 3,216 Marital status—no. (%) Divorced (12.13%) 4,330 (12.06%) 2,162 Married (57.33%) 20,460 (56.19%) 10,076 Separated (0.98%) 350 (0.91%) 163 Single (11.23%) 4,009 (10.75%) 1,927 Unknown (3.52%) 1,258 (3.89%) 698 Domestic partner (0.09%) 33 (0.06%) 11 Widowed (14.71%) 5,249 (16.14%) 2,894 aJcc T 6th edition—no. (%) T0 (0.03%) 9 0 T1 (41.75%) 14,900 (69.25%) 12,417 T2 (42.36%) 15,119 (30.75%) 5,514
specified; pneumonectomy with mediastinal node dissection; or pneumonectomy, not otherwise specified).
Outcome Variables and Other covariates
The outcome variables were overall survival (OS) and LCSS. Deaths from other causes were treated as censoring events. The main purpose of our investigation was to examine whether there are differences in presenting characteristics and outcomes in nine different ethnic groups by examining marital status, household income (<$50,000; $50–$74,999; >$75,000), type of insurance (insured, Medicaid, uninsured, unknown) in addition to estab-lished histopathologic and patient factors. Household income was listed in the SEER registry by median household income per county. The population was split into nine different ethnic groups as follows: White non-Hispanic (White), Black, White Hispanic (Hispanic), AI/AN, Chinese, Japanese, South Asian (Asian Indian and Pakistani), Other Asian (Filipino, Thai, Vietnamese, Korean, Kampuchean, Laotian, and Hmong), and Other Race (OR, Chamorran, Fiji Islander, Guamanian, Hawaiian, Melanesian, Micronesian, New Guinean, Pacific Islander, Polynesian, Samoan, Tahitian, Tongan, unknown, and other) in both the entire lung cancer surgical population as well as those presenting with ESR disease. We originally wanted to include black Hispanic patients as a separate patient category in this manuscript and its companion study assessing ethnic differences in all lung cancer patients and those with Stage IV disease, but since we wanted similar populations in both studies and because the number of Black Hispanic patients was scant in both the TS population and the ESR groups, we decided to include Black Hispanic patients in the Black category, similar to a past study (8). Black Hispanic patients represented approximately 0.6% of patient group under-going surgical resection (19/3,276). Throughout this manuscript, the term population(s) will refer to total population of surgical patients (TS) and those with ESR disease, while group(s) will refer to the nine different ethnicities.
Variables examined for their potential effect on outcome were gender; age; year of diagnosis; marital status; race; ethnicity; tumor stage; t-stage, n-stage; nodes examined; nodes positive; node density (number of nodes positive/number of nodes examined); tumor size; histology; grade; SEER registry location; median family income; resection type; post-operative radiation; and tumor location. Median follow-up time was calculated by the methods of Schemper and Smith in which death becomes a censored follow-up time and was noted to be 36 and 35 months in the TS and ESR groups, respectively (9).
statistical analysis
Chi-square and t-test were used to compare difference between the ethnic groups with respect to treatment, patient characteris-tics, and tumor characteristics. Cox proportional hazards models estimates (10) were used to calculate adjusted hazard ratios with their 95% confidence intervals, and to show how treatment and other covariates were related to OS and LCSS. Medicare eligibility was controlled through use of two strata for age at diagnosis (≥65 vs <65 years old) because individual cases will change when they enroll in Medicare. The cox proportional hazards assumption was
checked by visual examination of survival plots. (Continued)
resUlTs
Presenting characteristics
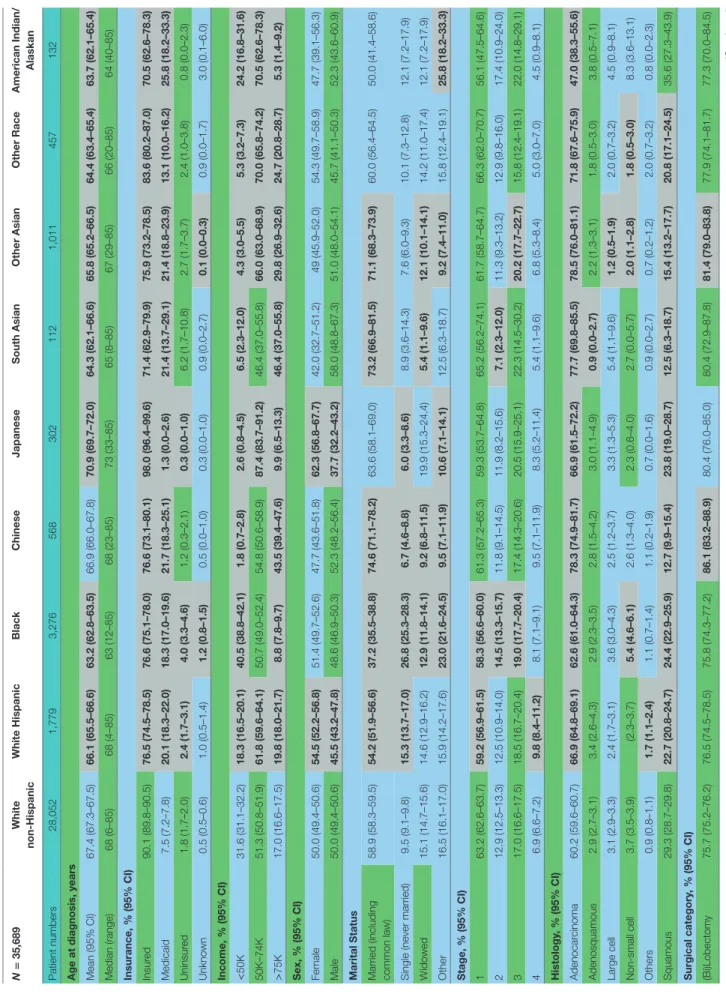
Complete demographic and histologic details of the TS and ESR patients can be seen in Table 1. Median age of the patients in the TS and ESR populations were both 68.0 years. There was a female
all surgical (N = 35,689) Favorable (N = 17,931) T3 (5.63%) 2,010 0 T4 (9.91%) 3,537 0 TX (0.32%) 114 0 insurance—no. (%) Insured (87.45%) 31,210 (88.26%) 15,826 Medicaid (9.85%) 3,516 (9.48%) 1,700 Uninsured (2.07%) 740 (1.63%) 292 Unknown (0.62%) 223 (0.63%) 113 lateral location—no. (%) Bronchus, left (0.38%) 136 (0.09%) 16 Bronchus, right (0.32%) 116 (0.06%) 11 Bronchus, unknown (0.03%) 9 (0.02%) 3 Left lower (13.95%) 4,980 (13.76%) 2,467 Left upper (26.30%) 9,388 (26.14%) 4,687 Left NOS (0.69%) 248 (0.31%) 56 Left overlapping (0.36%) 127 (0.12%) 22 Lung, NOS (0.22%) 80 0 Right lower (17.45%) 6,228 (17.30%) 3,102 Right middle (5.00%) 1,786 (5.50%) 986 Right upper (32.99%) 11,774 (35.71%) 6,404 Right NOS (1.14%) 407 (0.45%) 81 Right overlapping (1.15%) 410 (0.54%) 96 histology—no. (%) Adenocarcinoma (61.74%) 22,037 (67.12%) 12,036 Adenosquamous (2.86%) 1,021 (2.44%) 438 Large cell (3.01%) 1,075 (2.53%) 454 Non-small cell (3.72%) 1,327 (2.76%) 495 Other (0.99%) 355 (0.73%) 131 Squamous (27.67%) 9,874 (24.41%) 4,377 grade—no. (%) Moderately, II (41.20%) 14,703 (45.29%) 8,121 Poorly, III (36.31%) 12,960 (28.56%) 5,121 Undifferentiated, IV (1.96%) 701 (1.39%) 250 Unknown (6.94%) 2,476 (5.64%) 1,012 Well, I (13.59%) 4,849 (19.11%) 3,427 surgical Procedure—no. (%) (Bi)Lobectomy (76.16%) 27,182 (76.79%) 13,769 Penumonectomy (5.52%) 1,971 (0.94%) 169 Segmentectomy (3.04%) 1,084 (4.06%) 728 Sub-lobar resection, NOS (0.62%) 222 (0.41%) 74 Wedge (14.65%) 5,230 (17.80%) 3,191 radiation—no. (%) No (85.23%) 30,419 (96.77%) 17,352 Yes (14.77%) 5,270 (3.23%) 579 Year of diagnosis—no. (%) 2007 (17.03%) 6,077 (16.81%) 3,015 2008 (17.10%) 6,103 (16.90%) 3,030 2009 (16.99%) 6,062 (17.22%) 3,087 2010 (16.67%) 5,949 (16.83%) 3,018 2011 (16.44%) 5,868 (16.63%) 2,982 2012 (15.78%) 5,630 (15.61%) 2,799
predominance to both populations (50.4%—TS and 55.1%— ESR). The three largest ethnic groups in the TS were White, Black, and Hispanic, and they represented 78.6, 9.2, and 5.0% of the population, respectively. Likewise, the ESR population’s three largest ethnic groups were White (79.6%), Black (8.4%), and Hispanic (4.6%). A similar proportion of patients presented with a low median family income (<$50,000) and was noted to
be 29.8 and 28.7% in the TS and ESR populations, respectively. The majority of patients were married, 57.3% (TS) and 56.2% (ESR). 87.4% (TS) and 88.3% (ESR) patients were insured. Adenocarcinoma was the predominant histology (61.7%—TS and 67.1%—ESR).
Univariate analysis of all Patients
Undergoing surgical resection
of lung cancer
Table 2 contains the demographic, histologic, and treatment
details for the TS population for the nine different ethnic groups and used the White population as the reference group. Blacks presented with a younger age, less stage I tumors, less grade I tumors, lower income, higher percentage of adeno-carcinomas, less nodes examined, and were less likely to be insured, but their number of nodes positive, nodal density, OS, and LCSS was the same. Their 30 and 90-day mortality did not differ as compared to Whites. Hispanic patients pre-sented with younger age, higher median household income, lower rates of insurance, higher percentage of females, lower percentage of Stage I, more grade 1 tumors, higher percentage of adenocarcinomas, and had less nodes examined, but they had a similar number of nodes positive, nodal density, OS and LCSS. Hispanics had a similar 90-day mortality, but their 30-day mortality was higher than Whites (mean 1.8 vs 1.1%). Of all the ethnic groups, the Japanese presented with a highest mean age (70.9), the highest female predominance (62.3%), and the highest rates of insurance (98.0%), but there was a similar OS and LCSS to Whites. Blacks (58.3%) and Hispanics (59.2%) presented with a lower proportion of patients with Stage I NSCLC as compared to Whites (63.2%), but similar rates were noted in all other ethnic groups. The Other Asian group presented with the highest percentage of adenocarci-nomas (78.5%), while American/Alaskan Natives presented with the highest percentage of squamous cell carcinomas (35.6%). The Chinese had the highest proportion of patients receiving a (bi)lobectomy at 86.1%, but the least receiving a pneumonectomy (2.5%) as well as a wedge resection (8.8%). Likewise, the Chinese were least likely to undergo a sub-lobar resection for tumors greater than 2 cm with only 5.0% receiv-ing such treatment. Blacks (8.2), Hispanics (8.5), and Other Asians (8.3) were found to have less mean nodes examined than Whites (9.0), and a higher proportion of patients with positive nodes was noted in the Other Asian group (26 vs 21.8%), but none of the other ethnic groups differed from Whites in terms of the median number of nodes explored or number of nodes positive. The only ethnic group that differed from Whites in regards to nodal density was the Other Asian group, 0.10-Other Asians vs 0.07-Whites. The 30-day mortality was higher in the Hispanic patients, but lower in the Other Race and Japanese ethnic groups. The 90-day survival was significantly higher in the Other Race and Other Asian groups. As compared to Whites, OS and LCSS was significantly greater in the Chinese, South Asian, Other Asian, and the Other Race groups. Unadjusted OS by ethnic group can be found in the Kaplan–Meier survival in Figure 1A.
Ta
B
le 2
| Demographic, histologic, and tr
eatment details in the TS population for the nine dif
fer ent ethnic gr oups. N = 35,689 White non-h ispanic White h ispanic Black c hinese Japanese s outh a sian Other a sian Other r ace a merican indian/ a laskan Patient numbers 28,052 1,779 3,276 568 302 112 1,011 457 132 a
ge at diagnosis, years Mean (95% CI)
67.4 (67.3–67.5) 66.1 (65.5–66.6) 63.2 (62.8–63.5) 66.9 (66.0–67.8) 70.9 (69.7–72.0) 64.3 (62.1–66.6) 65.8 (65.2–66.5) 64.4 (63.4–65.4) 63.7 (62.1–65.4) Median (range) 68 (6–85) 68 (4–85) 63 (12–85) 68 (23–85) 73 (33–85) 65 (8–85) 67 (29–85) 66 (20–85) 64 (40–85) insurance, % (95% ci ) Insur ed 90.1 (89.8–90.5) 76.5 (74.5–78.5) 76.6 (75.1–78.0) 76.6 (73.1–80.1) 98.0 (96.4–99.6) 71.4 (62.9–79.9) 75.9 (73.2–78.5) 83.6 (80.2–87.0) 70.5 (62.6–78.3) Medicaid 7.5 (7.2–7.8) 20.1 (18.3–22.0) 18.3 (17.0–19.6) 21.7 (18.3–25.1) 1.3 (0.0–2.6) 21.4 (13.7–29.1) 21.4 (18.8–23.9) 13.1 (10.0–16.2) 25.8 (18.2–33.3) Uninsur ed 1.8 (1.7–2.0) 2.4 (1.7–3.1) 4.0 (3.3–4.6) 1.2 (0.3–2.1) 0.3 (0.0–1.0) 6.2 (1.7–10.8) 2.7 (1.7–3.7) 2.4 (1.0–3.8) 0.8 (0.0–2.3) Unknown 0.5 (0.5–0.6) 1.0 (0.5–1.4) 1.2 (0.8–1.5) 0.5 (0.0–1.0) 0.3 (0.0–1.0) 0.9 (0.0–2.7) 0.1 (0.0–0.3) 0.9 (0.0–1.7) 3.0 (0.1–6.0) income, % (95% ci ) < 50K 31.6 (31.1–32.2) 18.3 (16.5–20.1) 40.5 (38.8–42.1) 1.8 (0.7–2.8) 2.6 (0.8–4.5) 6.5 (2.3–12.0) 4.3 (3.0–5.5) 5.3 (3.2–7.3) 24.2 (16.8–31.6) 50K–74K 51.3 (50.8–51.9) 61.8 (59.6–64.1) 50.7 (49.0–52.4) 54.8 (50.6–58.9) 87.4 (83.7–91.2) 46.4 (37.0–55.8) 66.0 (63.0–68.9) 70.0 (65.8–74.2) 70.5 (62.6–78.3) > 75K 17.0 (16.6–17.5) 19.8 (18.0–21.7) 8.8 (7.8–9.7) 43.5 (39.4–47.6) 9.9 (6.5–13.3) 46.4 (37.0–55.8) 29.8 (26.9–32.6) 24.7 (20.8–28.7) 5.3 (1.4–9.2) s ex, % (95% c l) Female 50.0 (49.4–50.6) 54.5 (52.2–56.8) 51.4 (49.7–52.6) 47.7 (43.6–51.8) 62.3 (56.8–67.7) 42.0 (32.7–51.2) 49 (45.9–52.0) 54.3 (49.7–58.9) 47.7 (39.1–56.3) Male 50.0 (49.4–50.6) 45.5 (43.2–47.8) 48.6 (46.9–50.3) 52.3 (48.2–56.4) 37.7 (32.2–43.2) 58.0 (48.8–67.3) 51.0 (48.0–54.1) 45.7 (41.1–50.3) 52.3 (43.6–60.9) Marital s tatus
Married (including common law)
58.9 (58.3–59.5) 54.2 (51.9–56.6) 37.2 (35.5–38.8) 74.6 (71.1–78.2) 63.6 (58.1–69.0) 73.2 (66.9–81.5) 71.1 (68.3–73.9) 60.0 (56.4–64.5) 50.0 (41.4–58.6)
Single (never married)
9.5 (9.1–9.8) 15.3 (13.7–17.0) 26.8 (25.3–28.3) 6.7 (4.6–8.8) 6.0 (3.3–8.6) 8.9 (3.6–14.3) 7.6 (6.0–9.3) 10.1 (7.3–12.8) 12.1 (7.2–17.9) W idowed 15.1 (14.7–15.6) 14.6 (12.9–16.2) 12.9 (11.8–14.1) 9.2 (6.8–11.5) 19.9 (15.3–24.4) 5.4 (1.1–9.6) 12.1 (10.1–14.1) 14.2 (11.0–17.4) 12.1 (7.2–17.9) Other 16.5 (16.1–17.0) 15.9 (14.2–17.6) 23.0 (21.6–24.5) 9.5 (7.1–11.9) 10.6 (7.1–14.1) 12.5 (6.3–18.7) 9.2 (7.4–11.0) 15.8 (12.4–19.1) 25.8 (18.2–33.3) s tage, % (95% ci ) 1 63.2 (62.6–63.7) 59.2 (56.9–61.5) 58.3 (56.6–60.0) 61.3 (57.2–65.3) 59.3 (53.7–64.8) 65.2 (56.2–74.1) 61.7 (58.7–64.7) 66.3 (62.0–70.7) 56.1 (47.5–64.6) 2 12.9 (12.5–13.3) 12.5 (10.9–14.0) 14.5 (13.3–15.7) 11.8 (9.1–14.5) 11.9 (8.2–15.6) 7.1 (2.3–12.0) 11.3 (9.3–13.2) 12.9 (9.8–16.0) 17.4 (10.9–24.0) 3 17.0 (16.6–17.5) 18.5 (16.7–20.4) 19.0 (17.7–20.4) 17.4 (14.3–20.6) 20.5 (15.9–25.1) 22.3 (14.5–30.2) 20.2 (17.7–22.7) 15.8 (12.4–19.1) 22.0 (14.8–29.1) 4 6.9 (6.6–7.2) 9.8 (8.4–11.2) 8.1 (7.1–9.1) 9.5 (7.1–11.9) 8.3 (5.2–11.4) 5.4 (1.1–9.6) 6.8 (5.3–8.4) 5.0 (3.0–7.0) 4.5 (0.9–8.1) h istology , % (95% ci ) Adenocar cinoma 60.2 (59.6–60.7) 66.9 (64.8–69.1) 62.6 (61.0–64.3) 78.3 (74.9–81.7) 66.9 (61.5–72.2) 77.7 (69.8–85.5) 78.5 (76.0–81.1) 71.8 (67.6–75.9) 47.0 (38.3–55.6) Adenosquamous 2.9 (2.7–3.1) 3.4 (2.6–4.3) 2.9 (2.3–3.5) 2.8 (1.5–4.2) 3.0 (1.1–4.9) 0.9 (0.0–2.7) 2.2 (1.3–3.1) 1.8 (0.5–3.0) 3.8 (0.5–7.1) Large cell 3.1 (2.9–3.3) 2.4 (1.7–3.1) 3.6 (3.0–4.3) 2.5 (1.2–3.7) 3.3 (1.3–5.3) 5.4 (1.1–9.6) 1.2 (0.5–1.9) 2.0 (0.7–3.2) 4.5 (0.9–8.1) Non-small cell 3.7 (3.5–3.9) (2.3–3.7) 5.4 (4.6–6.1) 2.6 (1.3–4.0) 2.3 (0.6–4.0) 2.7 (0.0–5.7) 2.0 (1.1–2.8) 1.8 (0.5–3.0) 8.3 (3.6–13.1) Others 0.9 (0.8–1.1) 1.7 (1.1–2.4) 1.1 (0.7–1.4) 1.1 (0.2–1.9) 0.7 (0.0–1.6) 0.9 (0.0–2.7) 0.7 (0.2–1.2) 2.0 (0.7–3.2) 0.8 (0.0–2.3) Squamous 29.3 (28.7–29.8) 22.7 (20.8–24.7) 24.4 (22.9–25.9) 12.7 (9.9–15.4) 23.8 (19.0–28.7) 12.5 (6.3–18.7) 15.4 (13.2–17.7) 20.8 (17.1–24.5) 35.6 (27.3–43.9) s urgical category , % (95% ci ) (Bi)Lobectomy 75.7 (75.2–76.2) 76.5 (74.5–78.5) 75.8 (74.3–77.2) 86.1 (83.2–88.9) 80.4 (76.0–85.0) 80.4 (72.9–87.8) 81.4 (79.0–83.8) 77.9 (74.1–81.7) 77.3 (70.0–84.5) ( Continued )
N = 35,689 White non-h ispanic White h ispanic Black c hinese Japanese s outh a sian Other a sian Other r ace a merican indian/ a laskan Pneumonectomy 5.7 (5.4–6.0) 5.5 (4.4–6.5) 5.4 (4.6–6.2) 2.5 (1.2–3.7) 3.6 (1.5–5.8) 3.6 (0.1–7.1) 3.9 (2.7–5.0) 4.6 (2.7–6.5) 9.1 (4.1–14.1) Segmentectomy 3.1 (2.9–3.3) 3.2 (2.4–4.0) 2.9 (2.3–3.4) 2.3 (1.1–3.5) 3.6 (1.5–5.8) 0.9 (0.0–2.7) 2.7 (1.7–3.7) 1.8 (0.5–3.0) 2.3 (0.0–4.8) Sub-lobar r esection, NOS 0.6 (0.5–0.7) 0.9 (0.5–1.3) 1.0 (0.6–1.3) 0.4 (0.0–0.8) 0.7 (0.0–1.6) 0.9 (0.0–2.7) 0.5 (0.1–0.9) 1.1 (0.1–2.1) NA W edge Resection 14.9 (14.5–15.4) 13.9 (12.3–15.6) 15.0 (13.8–16.2) 8.8 (6.5–11.1) 11.6 (8.0–15.2) 14.3 (7.7–20.9) 11.6 (9.6–13.5) 14.7 (11.4–17.9) 11.4 (5.9–16.8) s ub-lober > 2 cm, % (95% ci ) No 92.6 (92.3–92.9) (91.5–93.8) (91.3–93.1) 95.0 (93.3–96.7) (89.4–95.2) (87.0–96.8) (91.3–94.4) (92.7–96.7) (91.1–98.3) Ye s 7.4 (7.1–7.7) 7.4 (6.2–8.5) 7.8 (6.9–8.7) 5.0 (3.3–6.7) 7.7 (4.8–10.6) 8.1 (3.2–13.0) 7.1 (5.6–8.7) 5.3 (3.3–7.3) 5.3 (1.7–8.9) n
umber of nodes examined
Mean (95% CI) 9.0 (8.9–9.1) 8.5 (8.2–8.9) 8.2 (8.0–8.5) 9.0 (8.3–9.7) 9.0 (8.1–9.8) 9.9 (8.0–11.8) 8.3 (7.8–8.7) 8.6 (7.9–9.3) 8.3 (6.7–9.9) Median (range) 7 (0–90) 7 (0–87) 6 (0–90) 7 (0–90) 7 (0–44) 6.5 (0–68) 6 (0–60) 7 (0–67) 6 (0–54) n
umber of nodes positive
Mean (95% CI) 0.6 (0.6–0.7) 0.7 (0.6–0.7) 0.6 (0.6–0.7) 0.7 (0.5–0.9) 0.8 (0.6–1.1) 0.8 (0.4–1.2) 0.7 (0.6–0.9) 0.8 (0.6–0.9) 0.8 (0.5–1.2) Median (range) 0 (0–61.0) 0 (0–26.0) 0 (0–29.0) 0 (0–28.0) 0 (0–21.0) 0 (0–13.0) 0 (0–16.0) 0 (0–24.0) 0 (0–17.0) n ode positivity , % (95% ci ) No 78.2 (77.7–78.6) 77.5 (75.6–79.5) 76.7 (75.3–78.1) 74.5 (70.9–78.1) 73.8 (68.9–78.8) 75.9 (67.8–83.9) (71.3–76.7) 76.8 (72.9–80.7) 74.2 (66.7–81.8) Ye s 21.8 (21.4–22.3) 22.5 (20.5–24.4) 23.3 (21.9–24.7) 25.5 (21.9–29.1) 26.2 (21.2–31.1) 24.1 (16.1–32.2) 26.0 (23.3–28.7) 23.2 (19.3–27.1) 25.8 (18.2–33.3) n ode density Mean (95% CI) (0.06–0.07) 0.07 (0.06–0.07) 0.08 (0.07–0.09) 0.08 (0.07–0.08) 0.09 (0.07–0.11) 0.08 (0.06–0.10) 0.08 (0.04–0.11) 0.10 (0.08–0.11) 0.08 (0.07–0.10) 0.08 (0.05–0.10) Median (range) 0 (0–1.0) 0 (0–1.0) 0 (0–1.0) 0 (0–1.0) 0 (0–1.0) 0 (0–1.0) 0 (0–1.0) 0 (0–1.0) 0 (0–0.9) 30-day survival, % (95% ci ) No 1.1 (1.0–1.2) 1.8 (1.2–2.4) 1.1 (0.7–1.4) 1.1 (0.2–1.9) 0.3 (0.0–1.0) 3.3 (0.1–6.4) 1.3 (0.6–2.0) 0.2 (0.0–0.7) 3.1 (0.1–6.0) Ye s 98.9 (98.8–99.0) 98.2 (97.6–98.8) 98.9 (98.6–99.3) 98.9 (98.1–99.8) 99.7 (99.0–100.0) 100.0 (93.6–99.9) 98.7 (98.0–99.4) 99.8 (99.3–100.0) 96.9 (94.0–100.0) 90-day survival, % (95% ci ) No 4.1 (3.9–4.4) 5.2 (4.1–6.3) 4.0 (3.3–4.7) 2.8 (1.4–4.2) 2.4 (0.6–4.2) 1.9 (0.0–4.5) 2.7 (1.7–3.7) 1.9 (0.6–3.2) 6.9 (2.5–11.3) c ancer death, % (95% ci ) No 76.6 (76.1–77.1) 77.7 (75.7–79.6) 76.1 (74.7– 77.6) 82.7 (79.6–85.9) 75.8 (71.0–80.7) 85.7 (79.1–92.3) 81.1 (78.7–83.5) 84.9 (81.6–88.2) 81.1 (74.3–87.8) Ye s 23.4 (22.9–23.9) 22.3 (20.4–24.3) 23.8 (22.4–25.3) 17.3 (14.1–20.4) 24.2 (19.3–29.0) 14.3 (7.7–20.3) 18.9 (16.5–21.3) 15.1 (11.8–18.4) 18.9 (12.2–25.7)
Other cause death, % (95%
ci ) No 91.9 (91.6–92.2) 93.5 (92.4–94.7) 92.4 (91.5–93.3) 94.9 (93.1–96.7) 91.4 (88.2–94.6) 94.6 (90.4–98.9) 94.0 (92.5–95.4) 95.0 (93.0–97.0) 90.9 (85.9–95.9) Ye s 8.1 (7.8–8.4) 6.5 (5.3–7.6) 7.6 (6.7–8.5) 5.1 (3.3–6.9) 8.6 (5.4–11.8) 5.4 (1.1–9.6) 6.0 (4.6–7.5) 5.0 (3.0–7.0) 9.1 (4.1–14.1) 95% confident inter
vals are given in parentheses. W is used as reference population. All characteristics differing from the W are in bold-print a
nd have brown colored backgrounds. Otherwise, green and blue depict individual rows are
different colors for ease of visualization.
Ta
B
le
2
South Asian Chinese Other Race Other Asian Black White Non-Hispanic American Indian/Alaskan Native
White Hispanic Japanese P<0.0001By Race
By Race of Paient
N=35,689 P<0.001
Chinese South Asian Other Race Black White Hispanic Other Asian White Non-Hispanic JapaneseAmerican Indian/Alaskan Native A
B
FigUre 1 | (a) Unadjusted overall survival (OS) by ethnic group in the TS population. (B) Multivariable adjusted OS by ethnic group in the TS population.
Os in the Total surgical Population
Multivariable analysis (MVA) for OS for TS population can be seen in Table 3. Age (p < 0.0001, HR = 1.029) and male sex (p < 0.0001, HR = 1.453) were significantly associated with OS. OS was significantly better than Whites (HR = 0.693–0.843) in all groups except for AI/ANs, Japanese, Blacks, and Hispanics who had a similar OS. MVA-adjusted OS by ethic group can be seen in Figure 1B. As compared to Connecticut, worse survival was noted in California, Greater Georgia, Iowa, Kentucky, Louisiana, and Utah. OS was not income dependent. Insured patients had a better OS than those on Medicaid (p < 0.0001, HR = 1.286). Married patients had a better OS than divorced (p < 0.0001,
HR = 1.191), widowed (p < 0.0001, HR = 1.229), and single patients (p < 0.0001, HR = 1.1215). As compared to Stage I, Stages II–IV were associated with a worse OS with a progressively increasing HR (all p < 0.0001, HR = 1.702–3.273). As compared to patients with adenocarcinoma, all histologies were associated with a worse OS (p < 0.0001 to <0.0008, HR = 1.119–1.564). Using well-differentiated tumors as a reference, all other tumor grades were associated with a worse OS (all p < 0.0001, HR = 1.665–3.273). Segmentectomies and (bi)lobectomies were associated with a better OS than pneumonectomies, p = 0.0011, HR = 0.80; p < 0.0001, HR = 0.72, respectively. Patients who received radiation (p < 0.0001, HR = 1.162) experienced worse
TaBle 3 | Multivariate analysis of overall survival in the TS population.
all surgical (N = 35,689) p-Value hazard ratio
Age—years <0.0001 1.029 sex Female – 1 Male <0.0001 1.453 race White Hispanic 0.49 0.968 White non-Hispanic – 1 Black 0.46 1.026 Chinese <0.0001 0.693 Japanese 0.06 1.027 South Asian 0.01 0.843 Other Asian 0.01 0.843 Other Race 0.02 0.772
American Indian/Alaskan Native 0.74 1.065
surveillance epidemiology and end reporting registry
Alaska Natives 0.72 0.873
Atlanta 0.40 1.062
California excl SF/SJM/LA 0.001 1.167
Connecticut – 1 Detroit 0.95 0.996 Greater Georgia 0.0005 1.217 Hawaii 0.33 1.102 Iowa 0.01 1.176 Kentucky 0.0001 1.249 Los Angeles 0.06 1.111 Louisiana 0.004 1.198 New Jersey 0.12 1.081 New Mexico 0.22 1.127 Rural Georgia 0.82 1.049 San Francisco-Oakland 0.12 1.107 San Jose-Monterey 0.49 1.059 Seattle 0.07 1.126 Utah 0.008 1.269 income <$50,000 0.05 1.06 $50,000–75,000 – 1 >75,000 0.24 0.963 Marital status Divorced <0.0001 1.191 Married – 1 Separated 0.18 1.144 Single <0.0001 1.215 Unknown 0.05 1.118 Domestic partner 0.67 0.783 Widowed <0.0001 1.229 stage I – 1 II <0.0001 1.702 III <0.0001 1.867 IV <0.0001 3.273 insurance Insured – 1 Medicaid <0.0001 1.286 Uninsured 0.08 1.135 Unknown 0.33 1.286 lateral location Bronchus, Left 0.92 1.014 Bronchus, right 0.01 1.42 Bronchus, unknown 0.33 0.613 Left lower 0.08 1.056 Left upper 0.10 1
all surgical (N = 35,689) p-Value hazard ratio
Left NOS 0.04 1.211 Left overlapping 0.15 0.801 Lung, NOS <0.0001 2.061 Right lower <0.0001 1.23 Right middle 0.75 1.015 Right upper – 1 Right NOS 0.45 1.062 Right overlapping <0.0001 1.371 histology—no. (%) Adenocarcinoma – 1 Adenosquamous 0.0008 1.196 Large cell <0.0001 1.348 Non-small cell 0.0003 1.174 Other <0.0001 1.564 Squamous <0.0001 1.159 grade Moderately, II <0.0001 1.702 Poorly, III <0.0001 1.867 Undifferentiated, IV <0.0001 3.273 Unknown <0.0001 1.665 Well, I – 1 surgical procedure (Bi)Lobectomy <0.0001 0.721 No surgery Pneumonectomy – 1 Segmentectomy 0.0011 0.800
Sub-lobar resection, NOS 0.13 1.172
Wedge 0.63 0.978
Radiation post-operative <0.0001 1.162 Number of nodes examined <0.0001 0.988 Number of nodes positive <0.0001 1.04
Node density <0.0001 1.429 Year of diagnosis—no. (%) 2007 – 1 2008 0.95 1.002 2009 0.28 0.969 2010 0.02 0.927 2011 0.0018 0.888 2012 <0.0001 0.787
OS. Number of nodes examined was associated with better OS (p < 0.0001, HR = 0.988), but number of nodes positive (p < 0.0001, HR = 1.04) and lymph node density (p < 0.0001, HR = 1.429) were associated with worse OS. Compared to year 2007, those patients diagnosed in 2010–2012 had significantly better OS with progressively decreasing hazard ratios. OS by insurance status can be seen in Figure 2.
Os in the esr Population
Multivariable analysis for OS for ESR population can be seen in
Table 4. Age (p < 0.0001, HR = 1.034), and male sex (p < 0.0001, HR = 1.506) were significantly associated with OS. OS was significantly better than Whites in the Other Race (p = 0.0051, HR = 0.555) and Other Asian groups (p = 0.012, HR = 0.736), but it was similar in all other ethnic groups. As compared to Connecticut, worse survival was noted in California, Greater Georgia, Kentucky, Louisiana, and Utah. OS was not income dependent. Insured patients had a better OS than those on Medicaid (p < 0.0001, HR = 1.385). Married patients had a
(Continued)
By Type of Insurance
N=35,689
P<0.0001
Insured Unknown Uninsured MedicaidFigUre 2 | Multivariable adjusted overall survival by insurance type in TS population.
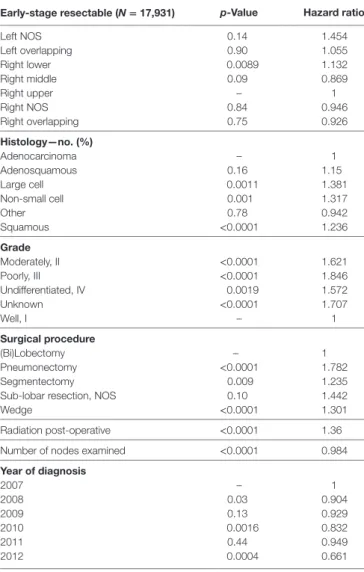
better OS than divorced (p < 0.0001, HR = 1.301), widowed (p < 0.0001, HR = 1.292), and single patients (p = 0.0015, HR = 1.121). Increasing tumor size (p < 0.0001, HR = 1.016) and T2 vs T1 (p < 0.0129, HR = 1.107) had a worse OS. Only the right lower lobe location was associated with survival (p < 0.0089, HR = 1.132). In comparison to patients with adeno-carcinoma, large cell adeno-carcinoma, NSCLC-NOS, and squamous cell carcinoma were associated with a worse OS (p < 0.0011 to <0.0001, HR = 1.15–1.381). Using well-differentiated tumors as a reference, all other tumor grades were associated with a worse OS (HR = 1.572–1.846). Segmentectomies (p < 0.0090, HR = 1.235), pneumonectomies (p < 0.0001, HR = 1.782), and wedge resections (p < 0.0001, HR = 1.301) were associated with a worse OS than (bi)lobectomies. Patients who received radia-tion (p < 0.0001, HR = 1.36) experienced worse OS. Number of nodes examined was associated with better OS (p < 0.0001, HR = 0.984). Compared to year 2007, those patients diagnosed in 2010 and 2012 had significantly better OS.
lcss in the esr Population
Multivariate analysis for LCSS for ESR population can be seen in Table 5. Age (p < 0.0001, HR = 1.023) and male sex (p < 0.0001, HR = 1.393) were significantly associated with LCSS. LCSS was not significantly associated with race or income. As compared to Connecticut, worse LCSS was noted in Greater Georgia, Kentucky, and Louisiana. Insured patients had a better LCSS than those on Medicaid (p < 0.0001, HR = 1.445). Married patients had a better LCSS than divorced (p < 0.0004, HR = 1.301) and widowed (p < 0.0036, HR = 1.200). Increasing tumor size (p < 0.0001, HR = 1.020) and T2 vs T1 (p = 0.0003, HR = 1.213) were associated with a worse LCCS. Only the right middle lobe location was associated with LCSS (p < 0.0469, HR = 0.803). As compared to patients with adenocarcinoma, NSCLC-NOS (p < 0.002, HR = 1.382) and large cell carcinoma
(p = 0.0003, HR = 1.543) were correlated with a worse LCSS. Using well-differentiated tumors as a reference, all other tumor grades were associated with a worse LCSS (HR = 1.693–2.171). Segmentectomies (p < 0.0065, HR = 1.329), pneumonectomies (p = 0.0027, HR = 1.781), and wedge resections (p < 0.0001, HR = 1.353) were associated with a worse LCSS than (bi) lobectomies. Patients who received radiation (p < 0.0001, HR = 1.556) experienced worse LCSS. Number of nodes exam-ined was associated with better LCSS (p < 0.0001, HR = 0.978). Compared to year 2007, those patients diagnosed in all other years, except for 2011 had a significantly better LCSS. OS and LCSS by marital status can be seen in Figures 3A,B.
90-Day Mortality analysis
Multivariate analysis for 90-day OS for TS population can be seen in Table 6. Age (p < 0.0001, HR = 1.045) and male sex (p < 0.0001, HR = 1.547) were significantly associated with 90-day OS. 90-day mortality was the same in all ethnic groups. Higher median income (>$75,000) was associated with a better survival. As compared to Connecticut, worse survival was noted in Louisiana and Utah. Insured patients had a better 90-day OS than those on Medicaid (p = 0.0005, HR = 1.359) and those with unknown insurance (p = 0.0003, HR = 2.774). Married patients had a better OS than single (p = 0.0188, HR = 1.239) and unmarried/domestic partner patients (p = 0.0310, HR = 3.523). Right bronchus (p = 0.0001, HR = 2.652), bronchus unknown (p = 0.0012, HR = 6.926), and right lower lobe (p < 0.0001, HR = 1.386) were associated with worse 90-day mortality than the right upper lobe location. As compared to Stage I, Stages II–IV were associated with a worse OS with a progressively increasing HRs (all p < 0.0001, HR = 1.607–4.381). As compared to patients with adenocarcinoma, NSCLC-NOS (p < 0.0034, HR = 1.460), other (p < 0.0001, HR = 2.334), and squamous cell carcinoma (p < 0.0001, HR = 1.436) had a higher risk of 90-day mortality.
early-stage resectable (N = 17,931) p-Value hazard ratio Left NOS 0.14 1.454 Left overlapping 0.90 1.055 Right lower 0.0089 1.132 Right middle 0.09 0.869 Right upper – 1 Right NOS 0.84 0.946 Right overlapping 0.75 0.926 histology—no. (%) Adenocarcinoma – 1 Adenosquamous 0.16 1.15 Large cell 0.0011 1.381 Non-small cell 0.001 1.317 Other 0.78 0.942 Squamous <0.0001 1.236 grade Moderately, II <0.0001 1.621 Poorly, III <0.0001 1.846 Undifferentiated, IV 0.0019 1.572 Unknown <0.0001 1.707 Well, I – 1 surgical procedure (Bi)Lobectomy – 1 Pneumonectomy <0.0001 1.782 Segmentectomy 0.009 1.235
Sub-lobar resection, NOS 0.10 1.442
Wedge <0.0001 1.301
Radiation post-operative <0.0001 1.36 Number of nodes examined <0.0001 0.984
Year of diagnosis 2007 – 1 2008 0.03 0.904 2009 0.13 0.929 2010 0.0016 0.832 2011 0.44 0.949 2012 0.0004 0.661
TaBle 4 | Multivariate analysis for overall survival in early-stage resectable population.
early-stage resectable (N = 17,931) p-Value hazard ratio
Age—years <0.0001 1.034 sex Female – 1 Male <0.0001 1.506 race White Hispanic 0.08 0.856 White non-Hispanic – 1 Black 0.80 0.984 Chinese 0.15 0.787 Japanese 0.19 0.757 South Asian 0.35 0.702 Other Asian 0.012 0.736 Other Race 0.0051 0.555
American Indian/Alaskan Native 0.69 0.873
surveillance epidemiology and end reporting registry
Alaska Natives 0.63 0.598
Atlanta 0.47 1.098
California excl SF/SJM/LA 0.05 1.173
Connecticut – 1 Detroit 0.57 1.06 Greater Georgia 0.004 1.312 Hawaii 0.11 1.32 Iowa 0.70 1.043 Kentucky 0.0099 1.286 Los Angeles 0.77 1.028 Louisiana 0.03 1.258 New Jersey 0.22 1.108 New Mexico 0.38 1.158 Rural Georgia 0.13 0.503 San Francisco-Oakland 0.61 1.06 San Jose-Monterey 0.95 0.99 Seattle 0.18 1.154 Utah 0.05 1.397 income <$50,000 0.71 1.019 $50,000–74,000 – 1 ≥75,000 0.19 0.93 Marital status Divorced <0.0001 1.301 Married – 1 Separated 0.23 1.239 Single 0.0015 1.211 Unknown 0.54 1.062 Domestic partner 0.84 1.221 Widowed <0.0001 1.292 Tumor size <0.0001 1.016 Tumor stage T1 – 1 T2 0.01 1.107 insurance Insured – 1 Medicaid <0.0001 1.385 Uninsured 0.69 1.065 Unknown 0.67 0.887 lateral location Bronchus, left 0.29 0.468 Bronchus, right 0.87 0.891 Bronchus, unknown 0.89 0.872 Left lower 0.36 0.952 Left upper 0.92 1.004
Using well-differentiated tumors as a reference, 90-day mortality was higher in patients having poorly differentiated, undifferenti-ated, and unknown differentiated tumors. Pneumonectomies were associated with a significantly higher 90-day mortality than all other resection types (p = 0.0281 to <0.0001, HR = 0.418– 0.775), except for sub-lobar, NOS which had a higher mortal-ity (p = 0.0012, HR = 1.885). Patients who received radiation experienced a significantly lower 90-day mortality (p < 0.0001, HR = 0.217). Number of nodes examined was associated with better OS (p = 0.0001, HR = 0.984), but number of nodes positive and lymph node density were associated with worse OS. Similar 90-day mortality was noted to 2007 for years 2008–2012.
characteristics associated With nodal
Positivity
In Table 7, a multivariate analysis was performed for the risk of having nodal positivity in patients undergoing a definitive surgi-cal procedure with a T1–T2 tumor <2 cm and at least one lymph node examined. The results were adjusted for type of surgical resection. Age (p < 0.0001, HR = 1.036) and male sex (p < 0.0001, HR = 1.386) were significantly associated with positive nodes.
TaBle 4 | Continued
early-stage resectable (N = 17,931) p-Value hazard ratio Left upper 0.91 0.994 Left NOS 0.42 1.334 Left overlapping 0.77 1.16 Right lower 0.09 1.111 Right middle 0.05 0.803 Right upper – 1 Right NOS 0.86 0.941 Right overlapping 0.91 0.966 histology—no. (%) Adenocarcinoma – 1 Adenosquamous 0.43 1.106 Large cell 0.0003 1.543 Non-small cell 0.002 1.382 Other 0.87 0.957 Squamous 0.06 1.104 grade Moderately, II <0.0001 1.81 Poorly, III <0.0001 2.171 Undifferentiated, IV 0.005 1.693 Unknown <0.0001 2.013 Well, I – 1 surgical procedure (Bi)Lobectomy – 1 Pneumonectomy 0.003 1.781 Segmentectomy 0.007 1.329
Sub-lobar resection, NOS 0.08 1.61
Wedge <0.0001 1.353
Radiation post-operative <0.0001 1.556 Number of nodes examined <0.0001 0.978
Year of diagnosis—no. (%) 2007 – 1 2008 0.02 0.875 2009 0.02 0.857 2010 0.001 0.779 2011 0.06 0.842 2012 0.003 0.612
TaBle 5 | Multivariate analysis for lung cancer-specific survival in early-stage resectable population.
early-stage resectable (N = 17,931) p-Value hazard ratio
Age—years <0.0001 1.023 sex Female 1 Male <0.0001 1.393 race White Hispanic 0.26 0.877 White non-Hispanic – 1 Black 0.54 0.949 Chinese 0.41 0.839 Japanese 0.07 0.534 South Asian 0.76 0.872 Other Asian 0.06 0.745 Other Race 0.10 0.655
American Indian/Alaskan Native 0.14 0.348
surveillance epidemiology and end reporting registry
Alaska Natives 0.44 2.575
Atlanta 0.82 0.96
California excl SF/SJM/LA 0.17 1.183
Connecticut – 1 Detroit 0.36 1.13 Greater Georgia 0.02 1.344 Hawaii 0.60 1.134 Iowa 0.16 1.218 Kentucky 0.0025 1.473 Los Angeles 0.41 1.112 Louisiana 0.0065 1.457 New Jersey 0.55 1.07 New Mexico 0.05 1.497 Rural Georgia 0.36 0.585 San Francisco-Oakland 0.92 0.985 San Jose-Monterey 0.65 0.909 Seattle 0.76 1.046 Utah 0.31 1.278 income <$50,000 0.17 0.912 $50,000–74,000 – 1 ≥75,000 0.62 0.965 Marital status Divorced 0.0004 1.272 Married – 1 Separated 0.96 0.988 Single 0.06 1.16 Unknown 0.61 0.935 Domestic partner 0.97 0 Widowed 0.0036 1.2 Tumor size <0.0001 1.02 Tumor stage T1 – 1 T2 0.0003 1.213 insurance Insured 1 Medicaid <0.0001 1.445 Uninsured 0.89 1.029 Unknown 0.84 0.932 lateral location Bronchus, left 0.92 0 Bronchus, right 0.63 1.41 Bronchus, unknown 0.97 0 Left lower 0.68 0.971
Positive nodes were not associated with any ethnic or income group. As compared to Connecticut, a greater risk of positive nodes was found in Greater Georgia, Hawaii, and Utah. T2 tumor had a higher risk of positive nodes than T1 tumors (p = 0.0004, HR = 1.289). Patients without a married partner (p < 0.0033, HR = 1.376) or without insurance (p < 0.0003, HR = 1.376) were more likely to have positive nodes. Right lower lobe loca-tion (p < 0.0353, HR = 1.185) was associated with a higher likelihood of positive nodes than the right upper lobe location. As compared to patients with adenocarcinoma, adenosquamous cell (p < 0.0316, HR = 1.416), large cell (p < 0.0252, HR = 1.426), and squamous cell carcinomas (p = 0.0437, HR = 1.149) had a higher risk of having positive nodes. Using well-differentiated tumors as a reference, nodal positivity was higher in patients having poorly differentiated (p < 0.0001, HR = 2.157), moderately differentiated (p < 0.0001, HR = 1.784), and unknown differentiated tumors (p < 0.0001, HR = 1.802). Number of nodes examined was not associated with nodal positivity. Nodal positivity was less likely in years 2010–2012 (p = 0.0427–0.0027), with a progressively decreased HR (0.821–0.0027).
TaBle 5 | Continued
By Marital Status N=17931 P<.0001 Separated Unknown Single Widowed Divorced Married By Marital Status N=17931 P=0.004 Single Unknown Married Widowed Divorced Separated A B
FigUre 3 | (a,B) Multivariable adjusted overall survival and lung cancer-specific survival in the early-stage resectable population by marital status.
DiscUssiOn
The purpose of our investigation was to assess difference in out-comes (OS and 30/90 day mortality), presentation, and treatment in nine different ethnic groups who underwent surgical resection of NSCLC. As compared to Whites, the unadjusted OS and LCSS was significantly greater in the Chinese, South Asian, Other Asian, and the Other Race groups. After multivariable adjust-ment, OS was significantly better than Whites in all groups except for AI/ANs, Japanese, Blacks, and Hispanics who had a similar OS. Despite presenting with higher stage tumors, lower median incomes, lower rates of insurance, less nodes examined, less grade 1 tumors, and lower marriage rates, the OS and LCSS of the Black
group were not significantly different than that of the Whites. In comparison to the White group, Hispanics had a similar LCSS, but had an improved OS despite having a higher unadjusted 30-day mortality. Although Hispanics presented with a lower percentage of Stage I patients, lower marriage rates, less nodes examined, and lower rates of insurance, they presented with many better prognostic features compared to the Whites including higher income, lower tumor grades, younger age, higher percentage of female patients, and a higher percentage of adenocarcinomas. The Chinese and Other Asian groups were more likely to receive a (bi) lobectomy than the Whites, but the other ethnic groups largely did not differ in the type of surgical procedure. The reason for the higher 30-day mortality (unadjusted) in the Hispanic population
all surgical (N = 35,689) p-Value hazard ratio Left NOS 0.01 1.628 Left overlapping 0.34 1.369 Lung, NOS 0.0004 2.37 Right lower <0.0001 1.386 Right middle 0.80 0.965 Right upper – 1 Right NOS 0.004 1.587 Right overlapping <0.0001 2.725 histology—no. (%) Adenocarcinoma – 1 Adenosquamous 0.79 1.044 Large cell 0.42 1.139 Non-small cell 0.003 1.46 Other <0.0001 2.334 Squamous <0.0001 1.436 grade Moderately, II 0.23 1.134 Poorly, III 0.003 1.378 Undifferentiated, IV 0.005 1.745 Unknown 0.0004 1.584 Well, I – 1 surgical procedure
Sub-lobar resection, NOS 0.001 1.885
(Bi)lobectomy <0.0001 0.475
Pneumonectomy – 1
Segmentectomy <0.0001 0.418
Wedge 0.03 0.775
Radiation post-operative <0.0001 0.217 Number of nodes examined 0.0001 0.984 Number of nodes positive 0.51 0.986
Node density 0.08 1.352 Year of diagnosis—no. (%) 2007 – 1 2008 0.35 1.087 2009 0.41 1.077 2010 0.82 1.021 2011 0.96 0.996 2012 0.53 1.065
TaBle 6 | Multivariate analysis for 90-day overall survival in TP.
all surgical (N = 35,689) p-Value hazard ratio
Age—years <0.0001 1.045 sex Female – 1 Male <0.0001 1.547 race White Hispanic 0.09 1.219 White non-Hispanic – 1 Black 0.96 1.005 Chinese 0.58 0.861 Japanese 0.11 0.532 South Asian 0.58 0.672 Other Asian 0.21 0.772 Other Race 0.11 0.563
American Indian/Alaskan Native 0.11 1.861
surveillance epidemiology and end reporting registry
Alaska Natives 0.80 0.813
Atlanta 0.34 1.212
California excl SF/SJM/LA 0.51 1.098
Connecticut – 1 Detroit 0.41 0.858 Greater Georgia 0.10 1.301 Hawaii 0.91 1.036 Iowa 0.91 1.022 Kentucky 0.09 1.317 Los Angeles 0.13 1.271 Louisiana 0.04 1.428 New Jersey 0.39 1.134 New Mexico 0.25 1.332 Rural Georgia 0.16 1.854 San Francisco-Oakland 0.96 0.99 San Jose-Monterey 0.79 1.068 Seattle 0.10 1.347 Utah 0.01 1.735 income <$50,000 0.07 1.16 $50,000–75,000 – 1 >75,000 0.01 0.782 Tumor stage I – 1 II <0.0001 1.607 III <0.0001 2.238 IV <0.0001 4.381 Marital status Divorced 0.78 0.974 Married – 1 Separated 0.88 0.954
Single (never married) 0.02 1.239
Unknown 0.52 1.1
Unmarried or domestic partner 0.03 3.523
Widowed 0.13 1.127 insurance Insured – 1 Medicaid 0.0005 1.359 Uninsured 0.24 1.279 Unknown 0.0003 2.774 lateral location Bronchus, left 0.51 0.786 Bronchus, right 0.0001 2.652 Bronchus, unknown 0.0012 6.926 Left lower 0.37 0.917 Left upper 0.43 1.063
is currently unknown, but the all other populations had a similar or better (Japanese or Other Race) 30-day survival to the White population. Although the unadjusted 90-day mortality was lower in the Other Asian and Other Race populations, there was no difference between the other ethnic groups and the Whites. However, the MVA demonstrated that there was no significant difference between the ethnic groups as compared to Whites. It should be noted that we included stage IV patients in this analysis of patients undergoing a definitive surgical procedure because a satellite nodule in a different lobe of the ipsilateral lung was classified by the AJCC staging as metastatic until 2010 when the new AJCC seventh edition classified this situation as T4 (11). The percentage of each ethnic group undergoing a definitive surgical procedure for Stage IV disease varied from 4.5 to 9.8%. Only the Hispanic group had significantly different percentage of Stage IV patients than the White patients (9.8% of Hispanics vs 6.9% of Whites). Two thousand five hundred sixty three patients with Stage IV tumors underwent a definitive surgical procedure.
TaBle 6 | Continued
all surgical patients with T1 or T2 tumors <2 cm (N = 7,580)
p-Value hazard ratio
Right NOS 0.30 0.653 Right overlapping 0.87 1.087 histology—no. (%) Adenocarcinoma – 1 Adenosquamous 0.03 1.419 Large cell 0.03 1.426 Non-small cell 0.46 1.113 Other 0.11 0.199 Squamous 0.04 1.149 grade Moderately, II <0.0001 1.784 Poorly, III <0.0001 2.157 Undifferentiated, IV 0.89 1.047 Unknown <0.0001 1.802 Well, I – 1
Number of nodes examined 0.28 0.995
Year of diagnosis—no. (%) 2007 – 1 2008 0.70 0.971 2009 0.71 0.969 2010 0.04 0.821 2011 0.003 0.679 2012 0.003 0.519
TaBle 7 | Multivariate analysis for node positivity by various factors for T1–T2 tumors <2 cm with at least one node removed, adjusted for type of surgical resection.
all surgical patients with T1 or T2 tumors <2 cm (N = 7,580)
p-Value hazard ratio
Age—years <0.0001 1.036 sex Female – 1 Male <0.0001 1.386 race White Hispanic 0.99 0.998 White non-Hispanic – 1 Black 0.89 0.986 Chinese 0.06 0.488 Japanese 0.32 0.699 South Asian 0.70 0.675 Other Asian 0.31 0.808 Other Race 0.38 0.754
American Indian/Alaskan Native 0.09 1.219
surveillance epidemiology and end reporting registry
Alaska Natives 0.97 1
Atlanta 0.38 1.19
California excl SF/SJM/LA 0.36 1.13
Connecticut – 1 Detroit 0.59 0.912 Greater Georgia 0.02 1.415 Hawaii 0.05 1.83 Iowa 0.95 0.988 Kentucky 0.41 1.144 Los Angeles 0.77 0.953 Louisiana 0.49 1.136 New Jersey 0.93 1.012 New Mexico 0.43 1.256 Rural Georgia 0.90 1.099 San Francisco-Oakland 0.97 1.008 San Jose-Monterey 0.54 0.837 Seattle 0.11 1.323 Utah 0.04 1.705 income <$50,000 0.10 1.151 $50,000–75,000 – 1 >75,000 0.39 0.922 Tumor size 1.008 Tumor stage T2 vs T1 0.0004 1.289 Marital status Other 0.003 1.191 Married – 1 insurance Insured – 1 Other 0.0003 1.376 lateral location Bronchus, left 0.95 1.047 Bronchus, right 0.95 1 Left lower 0.90 0.989 Left upper 0.62 0.965 Left NOS 0.83 1.088 Left overlapping 0.95 1.047 Lung, NOS 0.99 1 Right lower 0.04 1.185 Right middle 0.08 0.782 Right upper – 1
One thousand six hundred twenty-seven patients were classified as having tumors nodules in different ipsilateral lobes during the years 2007–2009. One thousand one hundred twenty-nine underwent a sub-lobar resection (966 wedge, 92 segmentectomy, and 71 sub-lobar, NOS). Although some patients may have undergone a diagnostic wedge procedure, we assume that most of the remaining patients who did not have tumor nodules in different ipsilateral lobes (N = 936) may have been found to have metastatic disease shortly after their surgical procedure. However, the performance of staging investigations and their timing in relation to surgical procedures is not available in SEER. Nevertheless, after removing the patients who would now be re-classified as having Stage III NSCLC, the numbers were too small for further characterization of these patients by ethnicity.
It is interesting to note that the multivariable analyses for OS in the TS and ESR, and LCSS in the ESR populations yielded similar results to the multivariable analyses for OS in our companion manuscript containing two different lung cancer populations (all patients presenting with NSCLC and those presenting with Stage IV disease). In all four lung cancer populations in both manuscripts, well-established risk factors (12, 13) for OS and LCSS were noted in all multivariable analyses including tumor size, stage, differentiation, gender, age, and t-stage. After adjust-ment for histolopathologic, gender, age, treatadjust-ment, and marital variables, all ethnicities in all analyses had similar or significantly better OS and LCSS (ESR group only) compared to the White group. Adenocarcinoma was uniformly associated with a better OS. A consistently lower OS and LCSS were noted for all four lung cancer populations in Greater Georgia, Louisiana, and Kentucky. Similarly, patients in California and Iowa had poorer outcomes except for OS in the Stage IV population in California and OS
TaBle 7 | Continued
in the ESR group in Iowa. The reason for the consistently poor outcomes across all stages and presentations in these registries is currently not known, but we believe that the number physician per 100,000 may be a factor because all five states rank in the bot-tom half of states in terms of the density of total active physicians as well as primary care physicians (14). Of interest, the highly significantly survival decrement (p < 0.0001) for tumor location in the mainstem bronchi in the companion manuscript was less significant in the surgical patients where only the right mainstem (p = 0.01) remained significant for OS in the TS group. There was no OS or LCSS decrement noted in the ESR population for the mainstem bronchi location. However, there was only a small num-ber of tumors associated with the mainstem bronchi (N = 30) in the ESR group. We hypothesize that surgery neutralizes the effects of mainstem bronchi locations because this modality effectively eradicates a location that can cause obstructive pneumonias in a compromised patient group. Interestingly, although the compa-nion paper noted that both lower lobe locations were noted to be associated with decreased OS, only the right lower lobe location was noted to be associated with worse OS in the surgical patients. The association of the lower lobes with worse outcomes has been noted in other investigations (15, 16). Our analysis demonstrates that the worse OS survival in patients having tumor located in the right lower lobe may be due to an increased risk of nodal involve-ment. Prognosis in all lung cancer populations was improved by being married, not having Medicaid, and being insured, but unlike the previous analysis, income was not correlated with LCSS and OS in the surgical patients in this investigation with the exception of borderline worse of OS in the TS population for those individuals with a median household income of <$50,000 (p = 0.0457). In addition, all lung cancer populations were noted to have a general improvement in OS during the years of this study. The improvement in the surgical populations may have been due to variables that are not contained within SEER such as improved staging, increased use of chemotherapy, and better post-operative care. However, the improved OS in the ESR group would argue against the increased use of adjuvant therapy because chemotherapy would be less likely to be used in this group (17, 18). Likewise, it may be argued that better post-operative care did not contribute to the better OS of the TS population because the 90-day mortality did not improve during the years of this study.
This manuscript was able to assess some treatment-related factors because SEER-18 does contain some variables related to radiation and surgery. Patients receiving pre-operative radia-tion were excluded because it was felt that this treatment could obscure/improve histolopathologic variables. Because SEER-18 does not contain information pertaining to chemotherapeutic treatment, we deliberately decided to separately assess a surgical sub-group of patients with tumors 4 cm or less without nodal involvement because these patients would be unlikely to receive chemotherapy (17, 18). Furthermore, we decided to investigate LCSS as well in this group of early-stage patients because of their relatively high likelihood of surviving lung cancer and possibly succumbing to other smoking-related causes. Worse OS and LCSS were consistently noted after a pneumonectomy despite multivariable analyses that accounted for histopathologic, patient, and tumor location variables. The adverse survival of
patients undergoing a pneumonectomy was identified in recent retrospective study that demonstrated that that the lower sur-vival may be due to an increased risk of distal metastases (19). Although the immune effects of a larger lung cancer procedures such as pneumonectomy as compared to (bi)lobectomy and sub-lobar resections is not known, it has been shown that tran-sthoracic surgery for esophageal cancer as compared to smaller and less invasive surgical procedures (gastrectomy for cancer and cholecystomy for benign gallstones) has been associated with a transient immunosuppression (increased T-cell apoptosis and decreased T-cell cytokine production) during post-operative days 1–3 (20). Interestingly, a different research group noted that both transhiatal and transthoracic esophagectomies were associated with reduced TH1-type cytokine production on post-operative day 1, but depression of Th2-type cytokine was more profound with the latter procedure (21). In both surgical populations, the number of nodes examined was strongly correlated with OS and LCSS and was similarly noted in a past SEER analysis (22). The better outcomes associated with an increasing number of nodes examined may be due to the removal of microscopic disease that may or may not be recognized (especially in the ESR group) by routine pathologic methods (23), but because there is no OS with mediastinal lympadenectomy as compared to nodal sampling (24), one might infer that the beneficial effects of lymph node examination may be due to upstaging cancers that would otherwise be classified as node negative. Post-operative radiation was associated with poorer OS and LCSS. Although past retrospective analyses have demonstrated a possible survival benefit for radiation therapy in patients with N2 disease (25, 26), others have not (27). However, there has been general agreement that post-operative radiation results in a survival decrement in patients with N0 and N1 disease (25, 26). A recent retrospective investigation demonstrated that there was an OS benefit for post-operative radiation therapy for patients who experience a positive resection margin for all nodal stages (28). We would assume that the patients who receive post-operative radiation therapy for nodal stages N0–N1 during the years of our study had a positive margin, but SEER does not have information concerning margin status, and our results show a strongly negative effect of radiation on OS and LCSS in the surgical patients. Although there may be negative selection factors (i.e., positive margin, lymphatic, and/ or vascular invasion) in the patients receiving radiation, it may be that radiation therapy has no efficacy and could possibly only have deleterious effects in the post-operative setting, especially in those with N0–N1 disease.
The MVA for 90-day OS revealed that mortality was not related to ethnicity, but was significantly correlated with single/ unmarried partner status, Medicaid or unknown insurance, and income. Nevertheless, several known histopathologic and patient prognostic factors associated with aggressive disease/ poor outcomes predicted 90-day mortality included increasing patient age, male sex, tumor differentiation, stage, and non-adenocarcinoma histology and suggest that aggressive tumor spread and/or understaging at the time of resection may be the reasons for poor early survival. However, because financial and partnership variables did affect 90-day mortality, one may conclude that patients may be able to improve their short-term