— — — — — — — — — — — — —
Proefschrift ter verkrijging van de graad van doctor aan
Tilburg University, op gezag van de rector magni…cus,
prof. dr. Ph. Eijlander, in het openbaar te verdedigen
ten overstaan van een door het college voor promoties
aangewezen commissie in de aula van de Universiteit op
vrijdag 9 december 2011 om 14.15 uur door
Juan-Miguel Londoño-Yarce geboren op 29 oktober
Acknowledgement vii
Introduction ix
1 The Variance Risk Premium around the World 1
1.1 Introduction . . . 2
1.2 Data and De…nitions . . . 4
1.3 Variance Premium: Single-Country Evidence . . . 6
1.4 A Two-Country Model for the role of the Variance Premium in International Equity Markets . . . 8
1.4.1 Model Setup and Assumptions . . . 8
1.4.2 Model-Implied Variance Premiums . . . 10
1.4.3 Model-Implied Equity Premiums . . . 11
1.4.4 Numerical Implications of the Two-Country Model . . . 12
1.5 The Variance Premium and International Equity and Option Markets: Em-pirical Evidence . . . 15
1.5.1 Cross-country Variance Premium Correlations . . . 15
1.5.2 Cross-Country Equity Return Correlations . . . 16
1.5.3 Exploring the role of the Variance Premium in Explaining Excessive comovements . . . 18
1.6 Conclusions . . . 19
1.A Detailed Solution of the Two-country Model . . . 21
1.B Excessive Return Comovements . . . 23
Bibliography . . . 24
2 Cumulative Prospect Theory and the Volatility Premium 49 2.1 Introduction . . . 50
2.2 Overview of Cumulative Prospect Theory . . . 53
2.3 CPT and Asset Prices . . . 54
2.3.1 Making CPT suitable for asset pricing . . . 55
2.3.2 CPT parametrization . . . 57
2.4 Equilibrium Equity and Option Returns under CPT-Preferences . . . 58
2.4.2 Equilibrium prices under CPT . . . 59
2.5 CPT and the Volatility Premium: Numerical Simulations . . . 60
2.5.1 One-period setting . . . 60
2.5.2 Di¤erent degrees of Moneyness: ATM Straddles . . . 63
2.5.3 Checking for the uniqueness of equilibria . . . 63
2.5.4 Exploring the time-varying nature of the volatility premium . . . 64
2.6 Conclusions . . . 65
2.A Optimal non-…nite portfolio weights . . . 67
Bibliography . . . 67
3 Understanding Industry Betas 85 3.1 Introduction . . . 86
3.2 Alternative Measures of Industry Betas . . . 87
3.2.1 DCC-MIDAS betas . . . 88
3.2.2 Kernel betas . . . 90
3.3 The Dynamics of Industry Betas . . . 90
3.3.1 Data . . . 91
3.3.2 Estimation results for DCC-MIDAS and kernel methods . . . 91
3.3.3 Beta dynamics . . . 92
3.3.4 Structural breaks . . . 93
3.3.5 Industry cyclicality . . . 94
3.4 The Determinants of Industry Betas . . . 95
3.4.1 Existing models and previous empirical …ndings . . . 95
3.4.2 Empirical evidence: industry betas and cross-sectional dispersion . . 96
3.4.3 Dispersion in betas as a predictor of future equity returns . . . 98
3.5 Conclusions . . . 99
3.A Market-wide Variables . . . 101
1.1 Summary Statistics. Variance (and Volatility) Premiums . . . 28
1.2 Base Scenario for the Numerical Implications of the Two-Country Model . . . 29
1.3 Variance Premium Correlations across countries . . . 29
1.4 Predicting Variance Premium Correlations across Countries . . . 30
1.5 The role of Foreign Variance Premium in Predicting International Equity Returns . . . 31
2.1 CPT parameters . . . 72
2.2 Summary statistics. Time-varying volatility premium implied by CPT . . . . 72
3.1 Fama and French’s 30 industry portfolios. Summary statistics . . . 106
3.2 DCC-MIDAS betas. Estimated parameters . . . 107
3.2 DCC-MIDAS betas. Estimated parameters. Continued . . . 108
3.3 Estimated bandwidths . . . 109
3.4 Quarterly window ex-post betas. Summary statistics and ranking . . . 110
3.5 Annual window ex-post betas. Summary statistics and ranking . . . 111
3.6 DCC-MIDAS betas. Summary statistics and ranking . . . 112
3.7 Kernel betas. Summary statistics and ranking . . . 113
3.8 Individual structural breaks in the level of betas . . . 114
3.8 Structural breaks in the level of betas. Continued . . . 115
3.9 Common structural breaks in the level of betas . . . 116
3.9 Common structural breaks in the level of betas. Continued . . . 117
3.10 Industry cyclicality. Contemporaneous regressions . . . 118
3.10 Industry cyclicality. Contemporaneous regressions. Continued . . . 119
3.11 Industry betas and their fundamentals . . . 120
3.11 Industry betas and their fundamentals. Continued . . . 121
3.12 Cross-sectional dispersion and its fundamentals . . . 122
3.12 Cross-sectional dispersion and its fundamentals. Continued . . . 123
3.13 Predictive power of the cross-sectional dispersion in betas over equity returns 124 3.14 Predictive power of the cross-sectional dispersion in betas over equity returns. Partitioned sample . . . 125
1.1 Estimated (model-free) Variance premiums . . . 32
1.2 Signi…cance of the average Variance Premiums. Alternative speci…cations . . 33
1.3 The role of the Local Variance Premium in Predicting Local Equity Returns . 34
1.3 The role of the Local Variance Premium in Predicting Local Equity Returns.
Continued . . . 35
1.4 loads of VoV on the Variance Premiums. Alternative Parameters . . . 36
1.4 loads of VoV on the Variance Premiums. Alternative Parameters. Continued 37
1.5 Consumption Volatility and VoV loads on Equity Premiums. Alternative
Parameters . . . 38
1.5 Consumption Volatility and VoV loads on Equity Premiums. Alternative
Parameters. Continued . . . 39
1.6 Cross-Country Return Correlations and Model-implied correlation of
con-sumption . . . 40
1.7 The role of the US Variance Premium in Predicting International Equity
Returns . . . 41
1.7 The role of the US Variance Premium in Predicting International Equity
Returns. Continued . . . 42
1.8 The role of the US Variance Premium in Predicting Equity Return
Correla-tions across countries . . . 43
1.8 The role of the US Variance Premium in Predicting Equity Return
Correla-tions across countries. Continued . . . 44
1.9 The role of the US Variance Premium in explaining Excessive Variance
Pre-mium Comovements . . . 45
1.9 The role of the US Variance Premium in explaining Excessive Variance
Pre-mium Comovements. Continued . . . 46
1.10 The role of the US Variance Premium in explaining Excessive Return
Co-movements . . . 47
1.10 The role of the US Variance Premium in explaining Excessive Return Co-movements. Continued . . . 48
2.1 Maximization problem restricted to (normally distributed) risky assets.
Al-ternative parametrizations . . . 73
2.2 Maximization problem including a derivative (straddle). Alternative
2.3 Distribution of equity returns under the physical and distorted probability measures . . . 75
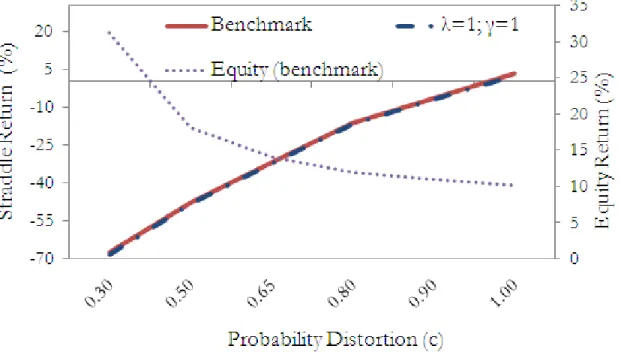
2.4 Numerical Simulations. Equilibrium expected return for stocks and zero-beta
straddles for alternative values of parameter c . . . 76
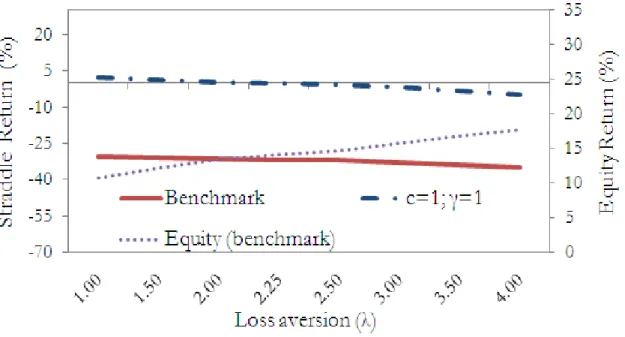
2.5 Numerical Simulations. Equilibrium expected return for zero-beta straddles
for alternative degrees of loss aversion . . . 77
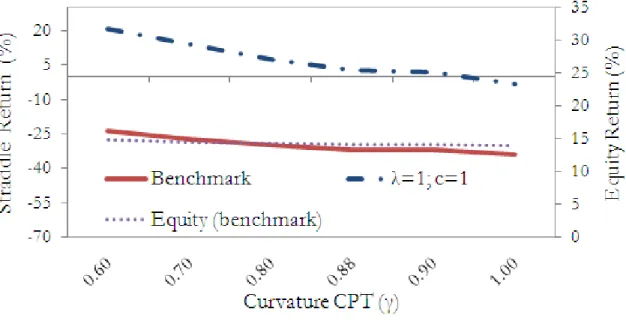
2.6 Numerical Simulations. Equilibrium expected return for zero-beta straddles
for alternative values of the curvature of the value function . . . 78
2.7 Numerical Simulations. Equilibrium expected return for zero-beta straddles
for alternative values of the curvature in the domain of gains . . . 79
2.8 Numerical Simulations. Equilibrium expected return of zero-beta straddles
for alternative values of parameter b . . . 80
2.9 Numerical Simulations. Equilibrium expected return of ATM straddles for
alternative parameter values . . . 81 2.10 Numerical Simulations. Uniqueness of the optimum for alternative
parame-trizations . . . 82 2.11 Dynamics of the measure of recent gains and losses for a simulated path for
equity returns . . . 83 2.12 Dynamics of the expected return of zero-beta straddles for a simulated path
I am grateful to everyone at the Tilburg School of Economics and Managent. In particular, to all members of the Departments of Finance and Econometrics and the CentER for Research in Economic and Business. Especially to my advisors Lieven Baele and Joost Driessen as well as to the other members of my dissertation committee: Esther Eiling, Rik Frehen and Frank de Jong.
My dissertation consists of three self-contained essays on asset pricing. The …rst one is my Job market paper called "The variance risk premium around the world". The second one is a joint work with with Lieven Baele, Joost Driessen and Oliver Spalt and is called "Cumulative Prospect Theory and the volatility premium". Finally, the third essay is a joint work with Lieven Baele and is called "Understanding Industry betas". Each essay is summarized in turn.
My …rst paper investigates the variance risk premium in an international setting. In this paper I …rst provide new evidence on the basic stylized facts traditionally documented for the US. I show that while the variance premiums in several countries are, on average, positive and display signi…cant time variation, they do not predict local equity returns in countries other than the US. Then, I extend the domestic model in Bollerslev, Tauchen and Zhou (2009) to an international setting. In light of the qualitative implications of my model, I provide empirical evidence that the US variance outperforms all other countries’variance premiums in predicting local and foreign equity returns.
The second paper explores the ability of Cumulative Prospect Theory (CPT) to explain the observed negative volatility premium embedded in option prices. In this paper, we simulate equilibrium prices for zero-beta straddles when agents are endowed with CPT-type preferences. We …nd that overweighting the probability of extreme events, one of the components of CPT, plays a key role in increasing the implied price of straddles. In contrast, increasing the scale of the value function, the second component of CPT, yields minor changes in the equilibrium prices of these straddles unless agents display a very large degree of loss aversion. We also explore these implications in a time-varying framework where we …nd that the price agents are willing to pay to hedge the risk of extreme events depends on the previous performance of their portfolio.
Finally, the third paper models and explains the dynamics of market betas for 30 US industry portfolios between 1970 and 2009. We use a DCC-MIDAS and kernel regression technique as alternatives to the standard ex-post measures. In this paper, we …nd betas to exhibit substantial persistence, time variation, ranking variability, and heterogeneity in their business cycle exposure. While we …nd only a limited amount of structural breaks in the betas of individual industries, we do identify a common structural break in March 1998. Finally, we …nd the cross-sectional dispersion in industry betas to be countercyclical and negatively related to future market returns.
The Variance Risk Premium around the World
Abstract
This paper investigates the variance risk premium in an international setting. First, I provide new evidence on the basic stylized facts traditionally documented for the US. I show that while the variance premiums in several countries are, on average, positive and display signi…cant time variation, they do not predict local equity returns in countries other than the US. Then, I extend the domestic model in Bollerslev, Tauchen and Zhou (2009) to an international setting. In light of the qualitative implications of my model, I provide empirical evidence that the US variance outperforms all other countries’variance premiums in predicting local and foreign equity returns.
JEL Classi…cation: E44, F36, G12, G13, G15.
Keywords: variance risk premium, economic uncertainty, interdependence, international integration, comovements, return predictability.
Acknowledgment
This paper has bene…ted signi…cantly from the comments of my advisors at Tilburg Uni-versity Lieven Baele and Joost Driessen. I would also like to thank the valuable comments from Geert Bekaert, Esther Eiling, Eric Engstrom, Rik Frehen, Bruno Gerard, Frank de Jong, and participants at the UvT Department of …nance Brownbag and the Basque Country University Department of Economics Seminars. All errors are mine.
1.1
Introduction
Traditional asset pricing models have mainly focused on characterizing the reward for equity risk. However, such models typically fail to capture the reward for bearing variance risk. The variance risk premium is formally de…ned as the di¤erence between the risk neutral and the physical expectation of the total return variation. It can be estimated using model-free measures as the di¤erence between the option implied variance and the expected realized variance. The observed variance premium in the US is large and varies signi…cantly over time. In order to generate a time-varying variance premium, standard asset pricing models have been adjusted in di¤erent ways. One strand of the literature, and the one that will be followed in this paper, links the variance risk premium to macroeconomic uncertainty. This strand follows the intuition behind the long-run risk model in Bansal and Yaron (2004) (BY hereafter), and the idea that agents have a preference for an resolution of uncertainty in Bansal et. al. (2005). Extending BY’s model, Bollerslev, Tauchen and Zhou (2009) (BTZ hereafter) show that the variance premium predicts equity returns; an implication for which they …nd empirical evidence for the US. An alternative strand of the literature relates the variance premium to agents’ attitudes towards non-normalities in the distribution of returns. In Bakshi and Madam (2006), for example, the variance risk premium is explained by the desire of risk averse agents to buy protection against extreme events. In a similar vein, Bekaert and Engstrom (2010), Todorov (2010), and Gabaix (2009), using di¤erent methodologies, focus on the interplay between returns, risk aversion and extreme events to explain many asset pricing regularities, including the variance risk premium.
Existing work, both theoretical and empirical, has predominantly focused on the US market. This paper adds to the literature by extending the variance premium analysis to an international setting. The contribution is threefold. First, I provide new evidence on the basic stylized facts related to the variance premium for a total of eight countries. I show that while the variance premiums display signi…cant time variation in all countries analyzed, the local return predictability does not hold internationally. Then, I extend the domestic model in Bollerslev, Tauchen and Zhou (2009) to an international setting. My model links the variance premium to local and aggregate macroeconomic uncertainty and yields a qualitative explanation for the local predictability puzzle. Finally, I provide new empirical evidence to investigate the main qualitative implications of my model. The empirical evidence suggests that the US variance premium predicts the equity returns in the US as well as in any other country in the sample. In addition, the evidence also suggest that the US variance premium plays a key role in predicting the variance premium correlations as well as the equity return correlations across countries.
I now discuss the di¤erent parts and contributions of the paper in more detail. In the …rst part, I investigate the main stylized facts related to the variance premium previously documented for the US in an international setting. In particular, I investigate whether the time-varying and positive nature of the variance premium as well as its capacity to predict returns holds internationally. In order to do so, I collect data for the US, Germany, UK, Japan, Switzerland, The Netherlands, Belgium, and France for the sample period 2000 to 2009. As it has become standard in the literature, the variance premiums for all countries are estimated using model-free measures of the expected variance of returns. Thus, the (squared of the) model-free implied volatility (IV) index for each equity market approximates the expectation of the total return variation under the risk neutral measure (Carr and Madan, 1998; and Britten-Jones and Neuberger, 2000) while the expectation under the physical measure is approximated by a conditional forecast of the actual realized variance.
The single-country evidence shows that the variance premiums display signi…cant time variation and are, on average, positive for all countries in the sample. This international
evidence is in line with previous …ndings for the US.1 However, I show that the variance premium can predict local equity returns only in the US. For any other country analyzed, the evidence suggests that the local variance premiums cannot predict local equity returns. This …nding suggests a puzzle that cannot be solved by the existing domestic models where
the variance premium implicitly explains the variation in the local equity premium.2
The strictly domestic nature of the existing models motivates the theoretical contribution of this paper. In the second part, I propose a model to investigate the role of the variance premium in explaining the interactions across international equity and option markets. The model is a two-country extension of that in BTZ and extends the intuition that agents have a preference for an early resolution of uncertainty to an international setting. The macroeconomic uncertainty is characterized in my model by the volatility dynamics of the consumption growth of each country and is allowed to be transmitted across countries given a unique representative agent endowed with recursive preferences. In such a setting, the shocks to macroeconomic uncertainty in any country characterize the variance premium in all countries. In particular, the variance premiums of the two countries reveal the volatility of volatility of consumption generated in both countries. Now, given that changes in the volatility of volatility also explain a portion of the total risk premiums of any country, the model not only implies that variance risk is priced but also provides the intuition for the potential role of the variance premium of any country in predicting local and foreign equity returns. In other words, agents demand a reward for the existing local and foreign sources of risk (i.e., the volatility and the volatility of volatility of consumption). Although this uncertainty transmission mechanism is bidirectional, the model explicitly assumes a leader economy. The consumption process of this leader economy is entirely driven by local shocks. However, the shocks of the leader country consumption process can be partially transmitted to a second country, the follower.
My model yields several qualitative implications for the interactions across international equity and option markets that explain the inability of the variance premium to predict local equity returns in countries other than the US. The …rst main implication of my model is that the variance premium in each country is uniquely characterized by the volatility of volatility of consumption (VoV) of the two countries. The load of each country’s VoV increases with the relative size of its economy and the degree of economic dependence among countries (leader-follower relation). As a consequence of having common components, the variance premiums are highly correlated across countries; and the cross-country variance premium correlation is mainly driven by the VoV generated in the leader country. Thus, the leader country variance premium plays the key role in predicting the variance premium correlations across countries. The second main implication of my model is that the VoV of the two countries also load on all countries’ equity premiums. Similar to the implication for the variance premiums, the load of VoV increases with the relative size of each economy and the implied correlation of the consumption processes. This second implication links the variance premium to all countries’equity premiums. As a consequence, this implication explains the possibility that the variance premium of a leader economy predicts other countries’equity returns which in turn implies that the leader country variance premium plays the key role in predicting equity return correlations across countries.
The third contribution of this paper is that it provides new empirical evidence on the two main qualitative implications of my model. That is, I investigate the fundamental linkages between the variance premiums across countries as well as the interplay between the vari-ance premiums and international equity returns. To do so, I …rst provide evidence that the 1See for instance Britten-Jones and Neuberger (2000), Jiang and Tian (2005), Bakshi and Madan (2006),
Carr and Wu (2009), Bollerslev, Gibson and Zhou (2010), and BTZ, among others.
2BTZ, Zhou (2010), and Drechsler and Yaron (2010) …nd empirical evidence for their respective
model-implied return predictability. However, Bekaert and Engstrom (2010) …nd weak evidence of return pre-dictability.
variance premiums are highly correlated across countries as suggested by the common loads of volatility of volatility in the variance premiums suggested by my model. As a natural extension of the high variance premium correlation across countries, I also investigate the role of the variance premium in explaining unusual variance premium correlations across countries at the daily frequency. The analysis of unusual correlations closely follows the contagion literature (Bekaert, Harvey, and Ng, 2005) and suggests that the variance premi-ums are unusually correlated after extreme US variance premium episodes. The US variance premium contagion pattern only holds in the very short term, from 1 to 10 days.
Next, I investigate the second main implication of my model which suggests that the leader country variance premium plays the key role in predicting local and foreign equity returns. On the one hand, I confront the evidence on the poor performance of the local variance premiums in predicting local returns for countries other than the US. Thus, I provide new evidence that only the US variance premium predicts equity returns for all countries in the sample. The predictive power of the US variance premium over international equity returns holds for horizons between 1 to 6 months, and reaches its maximum at the quarterly horizon. In addition, I show that the US variance premium outperforms all other countries’ variance premiums in predicting local and foreign equity returns. On the other hand, I provide evidence that international equity returns tend to comove more intensely following episodes of increasing US variance premium. The predictive power of the variance premium for both equity returns and cross-country return correlations holds for horizons between 3 and 6 months and is additional to that of traditional (local or US) variables such as the term spread and the dividend yield.
The remainder of the paper is organized as follows: Section 1.2 introduces the main de…nitions and data used throughout the paper. Section 1.3 provides international single-country evidence on the regularities related to the variance premium. Section 1.4 introduces the international consumption based general equilibrium model and analyzes its qualitative implications. Section 1.5 investigates the empirical evidence in light of the implications of my model. Finally, Section 1.6 concludes.
1.2
Data and De…nitions
In this section, I introduce the data used to estimate the monthly variance premiums for the following countries: US, Germany, Japan, UK, Switzerland, The Netherlands, Belgium and France. The variance premium is de…ned as the di¤erence between the risk neutral and the
physical expectation of the market return variation between timetand one month forward
t+ 1for each market. It is estimated, as it has become standard in the related literature,
using model-free measures for the expectations of the total return variation.
I approximate the risk neutral expectation of the market return variation as (the square of) the model-free options implied volatility (IV) index for each market. The methodology for the IV index was initially proposed by Carr and Madan (1998) and Britten-Jones and Neuberger (2000). The IV index has shown to provide a much better approximation to the expected risk neutral return variation than previously Black-Scholes based measures (Bollerslev, Gibson and Zhou, 2010). The IV indices are constructed from a portfolio of European calls where the underlying is a representative market index for each country as in
ivj;t= 2
Z 1
0
Cj;t(t+ 1;Bj(t;tK+1)) Cj;t(t; K)
K2 dK;
where Cj;t are the prices of calls with strikes from zero to in…nity, and Bj(t; t+ 1) are the
local prices of zero-coupon bonds with one month ahead maturity.
The availability of the IV index for the countries analyzed is limited by the recent development of their option markets. The index was …rst reported for the US by the Chicago
Board Options Exchange (CBOE), the VIX, in 1993 (with data from 1990). The VIX was adapted to the model-free methodology in 2003, and was then called the New-VIX. An index for the German market, the VDAX, was released by the German Stock Exchange (Deutsche Beurse and Goldman Sachs) in 1994 (with data from 1992). The Swiss Exchange introduced the index for Switzerland, the VSMI, in 2005. Currently, Eurex estimates and reports both VDAX and VSMI following a uni…ed New-VIX methodology. The Center for the Study of Finance and Insurance (CSFI) at Osaka University launched an index for Japan, the VXJ, with data from 1995. Finally, in 2007, Euronext announced IV indices for France (VCAC), Belgium (VBEL), the UK (VFTSE, in partnership with FTSE), and
The Netherlands (VAEX) with data from 2000.3 Considering the data restrictions for the
European markets, the empirical analysis in this paper is centered on the sample period between 2000 and 2009.
Now, in order to construct the variance premiums, an expectation of the total return variation under the physical measure has to be estimated. I estimate a measure based on the …rst order autoregressive forecast of the total realized return variation or realized variance from the following equation:
rvj;t+1= o+ 1rvj;t+t;
where the realized variance is calculated summing the squared daily equity returns for each market as in rvj;t= Nt X ti=1 (rj;ti) 2;
where rj;ti are daily local returns within month t. I rely on daily returns since data at a
higher frequency are not available for all countries in the sample.4
Now, in order to make the results comparable to those in the literature, and as a preven-tive solution to the possible underperformance of this benchmark measure, all results are checked using three alternative approximations of the expected realized variance. In the …rst measure, I use the martingale measure where the expected realized variance is approximated as the current realized variance(Et(rvt+1) =rvt). In the second one, I estimate a forecast
of the realized variance that includes the local IV index as in the following equation:
rvj;t+1= o+ 1rvj;t+ 2ivj;t+t:
Finally, in the third one, I estimate a forecast of the realized variance that includes the range-based variance for each country as in
rvj;t+1= o+ 1rvj;t+ 2RangeVj;t+ t;
whereRangeVj;t is the range-based variance calculated as
RangeVj;t= 1 4 ln 2 Nt X ti=1 range2ti;
whererangeti is the daily di¤erence between the highest and the lowest price of the index.
5 3Both, the UK (FTSE) and France (French March des Options Negociables de Paris) had previously
introduced IV indices separately.
4It has been shown in the literature that the use of intradaily returns outperforms lower frequency data
in the estimation of the realized variance (Andersen et. al., 2001, Barndor¤-Nielsen and Shephard, 2002; and Meddahi, 2002).
5Martens and van Dijk (2007) provide a description of the range based estimation of volatility. Jacob
In order to estimate the variance premiums, the monthly data (end of the month) for the IV indices as well as the daily returns for the underlying index returns for all countries
are obtained from Datastream. All returns are expressed in local currencies.6 Now, in order
to obtain the local excess returns to investigate the return predictability, I consider the 3-months T-bill rates for each country. These T-bill rates are also obtained from Datastream. In order to save space, the discussion in this section is centered on the components of the variance premium. All other variables used in the paper are described in Appendix 1.B.
1.3
Variance Premium: Single-Country Evidence
In this section, I investigate whether the stylized facts observed for the variance premium in the US also hold internationally. In a …rst step, I analyze the positive and time-varying nature of the variance premium. Then, I investigate the ability of the local variance premium in predicting equity returns in each country separately.
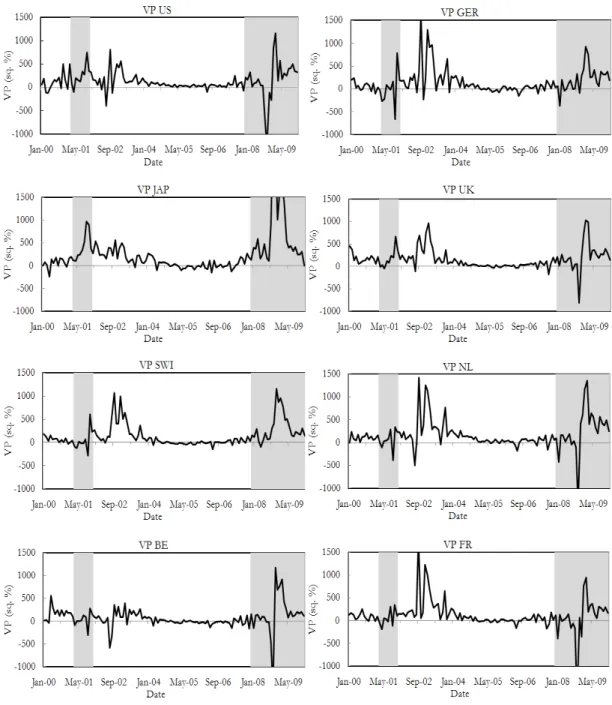
In order to get an idea of the magnitude and the time-varying nature of the variance premiums, Figure 1.1 displays the (benchmark) time series for all countries considered. The main statistics of these series are summarized in Table 1.1. This table also displays the IV indices and their underlying equity market indices for each country. The volatility premiums [volpj;t=ivt
p b
rvj;t+1] are also included in the table in order to visualize the magnitude of the premiums in annual percentages. The average volatility premium ranges between 1.7% for Belgium to 3.8% for Japan. In order to get an intuitive idea of these magnitudes in terms of one month maturity at-the-money put options, the 3.8% volatility premium in Japan translates into a price di¤erence of 18% in a Black Scholes world. That is, one month at-the-money put options priced at 26.75% implied volatility, which is the average IV index for Japan, are 18% more expensive than the same options priced at 22.87% implied volatility, which is the average realized volatility for this country in this sample.
The information in Table 1.1 and Figure 1.1 suggests that the variance premiums dis-play signi…cant time variation. In particular, the premiums show several episodes of high volatility and notorious spikes around the same periods of time which translate into large Kurtosis for all series. The …rst high-variance-premiums episode occurs around the end of the technological boom in 2000. A second episode occurs at the end of 2002. This second episode coincides with the high macroeconomic uncertainty reported in the second semester of 2002 in the US (…rst semester of 2003 for Germany. An episode also related to the corporate accounting scandals around those years). Finally, the most notorious variance premium spikes occur around the recent subprime crisis. Not surprisingly, the minimum and maximum values for all series, except for Germany, occur in the last quarter of 2008. For Japan, for example, the variance premium reached 3,398.2 (annual percentage squared)
in October 2008.7
Now, in order to assess the positive nature of the average variance premiums, Figure 1.2 summarizes the results for a test on the signi…cance of the mean variance premium for all countries. This …gure displays the average variance premiums and their respective con…dence intervals for the four alternative measures introduced in Section 1.2. The evidence suggests that the average variance premium is positive and signi…cant for all countries analyzed and all alternative measures considered, except perhaps when the martingale measure is used. This evidence supports the idea that agents also price market volatility in countries other than the US. These results are new evidence that extends that found for the US by Britten-Jones and Neuberger (2000), Jiang and Tian (2005), Bakshi and Madan (2006), Carr and Wu (2009), Todorov (2010), Bollerslev, Gibson and Zhou (2010), Bekaert and Engstrom
6The results are checked for robustness when all returns are expressed in US dollars.
7See Bollerslev, Gibson and Zhou (2010), and Corradi, et. al. (2009) for a more detailed analysis of the
(2010), and BTZ, among others.8 This paper is, to the best of my knowledge, the …rst to
show that these stylized facts also hold in other developed markets.9
I now test another US-based stylized fact, namely that the local variance premium
predicts local equity returns.10 Given the new evidence presented above on the existence of
a volatility premium in all countries analyzed, I investigate the role of the variance premium in predicting returns for all countries in the sample. To do so, Figure 1.3 reports the estimation results for the following regressions:
(r rf)j;t;t+h= 0;;j;h+ 1;;j;hvpj;t+ 2;;j;hdyj;t+ 3;;j;htsj;t+ j;h;t;
where (r rf)j;t;t+h represents future compounded annualized excess returns h-months
ahead,dyj;t is the local dividend yield, andtsj;t is the local term spread.
The evidence in Figure 1.3 con…rms most of the results previously found in the literature for the US. That is, the US variance premium predicts returns specially for horizons between 3 to 6 months. In fact, the evidence shows that the US variance premium explains up 15% of the total variation in future equity returns at the quarterly frequency. The predictive power, as well as the coe¢ cient of the variance premium in these regressions, follows a hump-shaped pattern and becomes null for horizons around one year.
However, the evidence suggests that the local variance premium plays a modest or in-signi…cant role in predicting returns in any other country analyzed except perhaps for Bel-gium. For example, the results show that for Germany, Japan, the UK and the Netherlands,
theR2 is modest and hardly ever above 1%. Not surprisingly, for these countries, the
vari-ance premium does not predict equity returns for any horizon considered. Now, for Belgium
theR2 is as high as 10% for the one-month horizon; and the predictive power of the
vari-ance premium follows a linearly decreasing as the horizon increases. Actually, the varivari-ance premium in Belgium plays a signi…cant role in predicting returns for horizons up to 10
months.11 Finally, for France, although theR2are also modest, the predictability follows a
pattern similar to that found for the US. That is, both the R2 and the variance premium
coe¢ cient is only signi…cant at the 2-months horizon.
In sum, although this is, to the best of my knowledge, the …rst paper to present evidence on the role of the variance premium in predicting returns for countries other than the US, the single-country evidence is puzzling. My …ndings are on the one hand consistent with the existence of time-varying variance premiums for a large sample of countries. On the other hand, they suggests that the variance premium does not predict returns in countries other than the US. The concurrence of these two …ndings cannot be explained by the existing domestic models where the variance premium implicitly explains the variation in the local equity premium. This puzzling evidence is nonetheless the motivation for the international general equilibrium model introduced in the following section. The model proposed is able to qualitatively explain the poor evidence for the role of the local variance premium in predicting returns outside the US. This model suggests that the variance premium of a leader country plays a dominant role in predicting returns for all other countries; a key implication for which I provide empirical evidence in the subsequent section.
8A group of papers have also provided preliminary evidence of this regularity using Black–Scholes-based
implied volatility. See, for instance, Bakshi, Cao and Chen (2000), Christo¤ersen, Heston and Jacobs (2006), and Bollerslev and Zhou (2006).
9This is certainly not the …rst one in analyzing the informational content of option markets internationally.
Some preliminary evidence that volatiliy risk is priced in an international setting can be found in Mo and Wu (2007) and Driessen and Maenhout (2006). Implied volatility in international markets has also been analyzed in Konstantinidi, Skiadopoulos, and Tzagkaraki (2008), Siriopoulos and Fassas (2009), and Jiang, Konstantinidi and Skiadopoulos (2010).
1 0See for instance BTZ, Zhou (2010) and Drechsler and Yaron (2010).
1 1It is worth pointing out that the variance premium in Belgium shows the lowest Sharpe ratio (almost half
that for the rest of the countries). This could preliminary suggest that the variance premium is particularly volatile in Belgium. This in turn implies a noisier measure in this country, potentially driven by the liquidity of the Belgian option market.
1.4
A Two-Country Model for the role of the Variance
Premium in International Equity Markets
The domestic nature of the existing models in the literature restricts the analysis of the variance premium in an international setting. These models cannot provide an explanation for the poor role of the local variance premium in predicting returns in countries other than the US as shown in the previous section. Therefore, I propose an international consumption-based general equilibrium (GE) model where the variance risk is priced in the global as well as in the local portfolios. My model yields several new qualitative implications for the role of the variance premium in international markets. The most relevant implication of the model is that the variance premium of a leader economy plays a dominant role in predicting equity returns in all portfolios. In addition, the model implies that the leader country variance premium also plays a role in explaining equity and option markets correlations across countries.
In this section, I present the basic setup of the model as well as its main implications.12 I do not attempt to estimate nor to test my model but rather to use its qualitative impli-cations to investigate the inability of the variance premium to predict local equity returns in countries other than the US. Therefore, I propose a numerical simulation of the model in order to understand its implications and illustrate the mechanism behind it. These nu-merical simulations provide the link between the single-country evidence, the implications of the model and the empirical evidence presented in the following section.
1.4.1
Model Setup and Assumptions
The model presented here is a two-country extension of that in BTZ. It preserves two key ingredients in BTZ’s model: the use of recursive preferences, and the time-varying nature of macroeconomic uncertainty characterized by the volatility of consumption. However, my model adds to the literature by extending the intuition that …nancial markets dislike macro-economic uncertainty (BY and Bansal, et. al., 2005) to an international setting. Therefore, I include the additional sources of risk embedded in the consumption process of each country, namely the country-speci…c time-varying volatility and the volatility of volatility (VoV) of
consumption.13 The setup of the model requires several additional assumptions. First, the
two countries are assumed to be of a "considerable" size. That is, they both play a role in determining the global consumption growth which is a weighted average of the two coun-tries’consumption growth. Second, one of the countries is assumed to be "the leader". The consumption process for the leader country is assumed to be entirely driven by local shocks, while the consumption process for the second country, "the follower", is also a¤ected by the shocks generated in the leader country. Finally, I assume fully integrated equity markets. That is, there exists a unique representative agent holding a global portfolio with positions in the two equity markets. The assumptions of fully integrated equity markets and poten-tially integrated economies seem adequate given the particular characteristics of the sample considered in this paper.
Formally, each country consumption process is modeled similar to BTZ. The log of the
consumption growthgj;t for the leader country (labeled as 1) follows
g1;t+1= 1;g+ 1;tzg1;t+1; (1.1)
1 2In order to save space, the detailed solution of my model is presented in Appendix 1.A
1 3Bekaert, Engstrom and Xing (2009) survey the evidence on time-varying volatility of consumption for
the US. Bansal, et. al. (2005) provide empirical evidence of time-varying macroeconomic uncertainty for the US, Germany, Japan, and the UK. Now, BTZ also …nd preliminary empirical evidence on the existence of time-varying VoV for the US.
2
1;t+1=a + 21;t+pq1;tz 1;t+1;
q1;t+1=aq+ qq1;t+'qpq1;tzq1;t+1;
whereas the consumption process for the follower country (labeled as 2) follows
g2;t+1= 2;g+ g 1;g+ 1;tzg1;t+1+ 2;tzg2;t+1; (1.2)
2
2;t+1=a + 22;t+pq2;tz 2;t+1;
q2;t+1=aq+ qq2;t+'qpq2;tzq2;t+1:
The global consumption growth is a weighted average of the two countries’ consumption process as in
gw;t=!g1;t+ (1 !)g2;t;
where! is the weight of the leader country in the global economy.
In order to simplify the model, the parameters in the volatility and VoV processes in Eqs. (1.1) and (1.2) are assumed to be the same across countries. I also assume that there are neither within nor cross-country statistical correlations in the shocks. The only correlations
assumed in my model are those implied by the parameters g (level) and (volatility)
in Eq. (1.2). These two parameters control the extent to which the follower country is
a¤ected by the shocks generated in the leader country. In particular, implies that the
consumption process of the follower country is a¤ected not only by the local macroeconomic uncertainty, but also by that generated in the leader economy. More importantly, the fact that both economies are exposed to the same sources of macroeconomic uncertainty yields
the systematic component in both countries’variance premiums.14
Now, the unique world representative agent is endowed with Epstein Zin Weil preferences (Epstein and Zin, 1989; and Weil, 1989). That is, her life-time utility function is given by the following equation:
Ut= [(1 )C
1
t + (Et[Ut1+1]) 1
]1 ; (1.3)
where0< <1is the time discount rate, 0is the risk aversion parameter, and =11 1
for 1is the intertemporal elasticity of substitution (IES).15 These preferences have the
property of assigning non-zero market prices to shocks not directly related to aggregate consumption. This property is crucial to investigate other risk factors such as news related to volatility which is the main objective of this paper.
1 4The parameters
g, and can of course be set to 0; a case that I will also analyze in the numerical
sim-ulation of the model. Now, although gturns out to have an insignifcant e¤ect on the role of international
variance premium, it is kept to maintain the possibility of a common level component in consumption. Alter-native ways of characterizing the systematic component of the variance premiums outside the simpli…cations of a two-country model are being explored in my current research agenda.
1 5To be coherent with the idea of agents that fear an increase in macroeconomic uncertainty, is assumed
to be higher than 1. This assumption accomodates some empirical asset pricing regularities, among them: (i) a positive variance premium; (ii) the feedback e¤ect between PD ratios and consumption volatility; and (iii) a low risk-free rate (BY and BTZ). See also Mehra and Prescott (1985) for reasonable values of .
1.4.2
Model-Implied Variance Premiums
Given the solution of the model in Appendix 1.A, it can be shown that the two countries’ VoV isolate the variance premium in the global and the local portfolios. The expression for
the global portfolio’s variance premium is given by16
V Pw;t=EtQ[V arrj;t+1] E
P
t [V arrj;t+1];
whereV arrj;t is the conditional variation of returns between time tandt+ 1for portfolio
j forj= 1;2; w (see appendix 1.A). The variance premium can be approximated as17
V Pw;t ( 1) w;1(Vw;1q1;t+Vw;2q2;t); (1.4)
where ( 1) w;1Vj;k represents the load of qk;t on V Pj;t. For the global portfolio, these
loads are characterized by the following expressions:
Vw;1= (!+ (1 !) )2Aw;1+ (A2w;1+A2w;2'2q) 21'2qAw;2;
Vw;2= (1 !)2Aw;3+ (A2w;3+A2w;4'2q) 21'2qAw;4;
where Aj;1; Aj;2; Aj;3 andAj;4 are respectively the loads of the risk factors 21;t+1; q1;t+1; 2
2;t+1; q2;t+1on the wealth-consumption ratio of each portfolio. These loads are derived in detail in Appendix 1.A.
For the leader country, the variance premium is given by
V P1;t = EQt [V arr1;t+1] E P t [V arr1;t+1] (1.5) ( 1)kw;1(V1;1q1;t+V1;2q2;t); V1;1=Aw;1+ (A21;1+A12;2'2q) 12;1'q2A2; V1;2=A21;3+ (A21;4'2q) 21;1'2qAw;4; while for the follower country
V P2;t = EQt [V arr2;t+1] E P t [V arr2;t+1] (1.6) ( 1) w;1(V2;1q1;t+V2;2q2;t); V2;1= 2Aw;1+ (A22;1+A22;2'2q) 22;1'2qAw;2; V2;2=Aw;3+ (A22;3+A22;4'2q) 22;1'2qAw;4:
1 6It is important to keep in mind that this is actually the drift di¤erence of the conditional variance
between the two measures. In the case of Gaussian shocks, the level di¤erence(V arQ(r
t+1) V arP(rt+1))
would be zero (see Drechsler and Yaron, 2010). I intentionally omit the use of models that generate a level di¤erence in the variance premium to maintain the simplicity of the expressions and given that the main attention will be centered in the qualitative implications of my model and not its calibration.
1 7The risk neutral probability is replaced by its log-linear approximation:
EQt ( 2r;t+1) log[e rt;tEt(emt=1+ 2 r;t+1)] 1 2V art( 2 r;t+1):
Eqs. (1.4) to (1.6) imply that the VoV of both countries are the unique sources of
the variance premiums in all portfolios. Actually, for <1, the two countries’ VoV load
positively on the variance premiums. That is, Vj;k 0 for j; k = 1;2; w (see appendix
1.A). Consequently, the global and local variance premiums are positive if <1. While the
load of foreign VoV in the leader country variance premium is explained by the recursive nature of the utility function given fully integrated equity markets, the leader country VoV load on the follower country variance premium has the following two sources: the recursive nature of the preferences, and the implied sensitivity to the leader country macroeconomic uncertainty (See Eq. (1.2)).
As an immediate consequence of the common components in the variance premium of all portfolios, the variance premium covariance across countries is uniquely characterized by the two countries’VoV. The expression for the variance premium covariance derived from Eqs. (1.5) and (1.6) can be written as follows:
Covt(V Pt1+1; V Pt2+1) = ( 1)2kw;2 1'2q(V1;1V2;1q1;t+V1;2V2;2q2;t) (1.7)
where the VoV of both countries loads positively on the variance premium covariance across countries as long as <1.
1.4.3
Model-Implied Equity Premiums
In order to understand the relation between the variance premiums and the dynamics of returns, in this section, I …nd the expressions for the equity premiums.
The global equity premium is characterized by the following expression:
EPw;t = Et(rw;t+1 rf;t) (1.8) = 2w;t 1 2 2 w;t +(1 )kw;1(Pw;1q1;t+Pw;2q2;t);
whererj;t+1 is the (log) gross return for portfolioj (j= 1;2; w),rf;t is the global risk-free
rate, 2w;t = ! 21;t+ (1 !) 22;t is the volatility of the world consumption, and ( 12 2rwt)
is the geometric adjustment term. The term (1 )kw;jPj;k represents the load of qk;t on
EPj;t. For the global portfolio these loads are given by
Pw;1 = kw;1(A2w;1+A2w;2'2q);
Pw;2 = kw;1(A2w;3+A2w;4'2q):
Equation (1.8) shows the three model-implied components of the global risk premium.
The …rst component is the classic risk-return trade-o¤ 2
w;t. This …rst component is also
present when the agents are endowed with CRRA preferences. Now, there are two additional components, one for the VoV generated in each country. The VoV components of the equity premium represent the true premium for variance risk since they are driven by the shocks to the volatility and the volatility of volatility of consumption in both countries. In the case of the global portfolio, the VoV of both countries load positively on the equity premium
if < 1. That is, (1 )kw;1Pw;j 0, for j = 1;2 (see Appendix 1.A). These positive
loads are in line with the concept that, at least for the global portfolio, agents are positively compensated for the risk generated by the time-varying nature of the VoV.
The expressions for the equity premiums for each country are given by EP1;t = Et(r1;t+1 rf;t) (1.9) = (! + (1 !) ) 21;t 1 2 2 r1;t +(1 )kw;1(P1;1q1;t+P1;2q2;t); and EP2;t = Et(r2;t+1 rf;t) (1.10) = (!+ (1 !) ) 12;t+ (1 !) 22;t 1 2 2 r2;t +(1 )kw;1(P2;1q1;t+P2;2q2;t); where Pj;1 = kj;1(Aw;1Aj;1+Aw;2Aj;2'2q); Pj;2 = kj;1(Aw;3Aj;3+Aw;4Aj;4'2q); forj = 1;2:
As for the global portfolio, the equity premium in each country is characterized by a volatility of consumption component, and two VoV components, one for each country. In particular, the VoV components in Eqs. (1.9) and (1.10) represent the true premium for local and foreign variance risk. Now, comparing the expressions for the Variance premium (Eqs. (1.5) and (1.6)) with those for the equity premiums (Eqs. (1.9) and (1.10)) yields the basic intuition for the role of local and foreign variance premium in predicting equity returns in any country. The intuition is as follows: the VPs reveal the VoV in both countries which in turn drives (in part) the time variation in the equity premiums. It is important to bear in mind that although the VoV is not a necessary condition to generate a variance risk premium, introducing the VoV isolates the risk premium on volatility and di¤erentiate it from the consumption risk premium.
It seems natural from Eqs. (1.8) to (1.10) to expect that the VoV also explains the time variation in the covariance of returns across countries. The expression for the covariance of returns is given by
Covt(r1;t+1; r2;t+1) = 21;t+CO1q1;t+CO2q2;t; (1.11)
whereCOj is the load ofqj;t on the covariance of returns. These loads are given by
CO1 = 1;1 2;1(A1;1A2;1+A1;2A2;2'2q);
CO2 = 1;1 2;1(A1;3A2;3+A1;4A2;4'2q):
1.4.4
Numerical Implications of the Two-Country Model
In this section, I present some numerical simulations of my model in order to investigate the mechanism of transmission of VoV shocks across countries. The purpose of these simula-tions is to analyze the qualitative implicasimula-tions of my model for the variance premiums and for the interaction between the variance premiums and the equity returns. I believe that understanding these qualitative implications provides a natural step between the model and the empirical evidence presented in the next section.
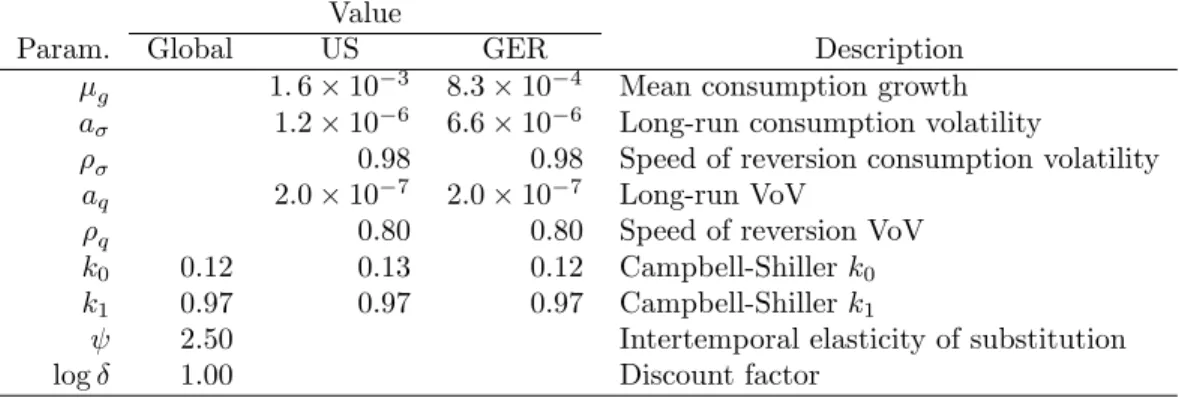
The base scenario for the numerical simulations is displayed in Table 1.2. In this scenario, the parameters in the preference function are calibrated as in BTZ. Now, in order to simplify
the interpretation of results, I consider the hypothetical case where the world is composed of only two countries: the US, and Germany. Just for the purpose of illustrating the mechanism
behind the model, the US is considered as the leader economy.18 For these two countries,
the parameters in Eqs. (1.1) and (1.2) are calibrated as follows: j;g is estimated as the
average IP growth in each country during the period 1973-2009; j; is estimated as the IP
growth unconditional variance for the same period; and the rest of the parameters are taken from BTZ (homogeneous parameters for the two countries). Now, the Campbell and Shiller
constants ko and k1 are estimated using data for the Price-Dividend (PD) ratio for each
country as well as for the Datastream world portfolio. The log-linearization constants are
estimated ask1= e
E(P D)
1+eE(P D), whereE(P D)is the unconditional mean of the (log) PD ratio,
andk0= k1ln(1 k1) (1 k1) ln(1 k1)(Campbell and Cochrane, 1999). Bear in mind
that ko and k1 should actually be made dependent of the theoretical wealth-consumption
ratio (see Appendix 1.A). However, I use the unconditionally expected PD ratio, to make
these two parameters independent from the set of parameters considered in each case.19
Variance Premium Dynamics
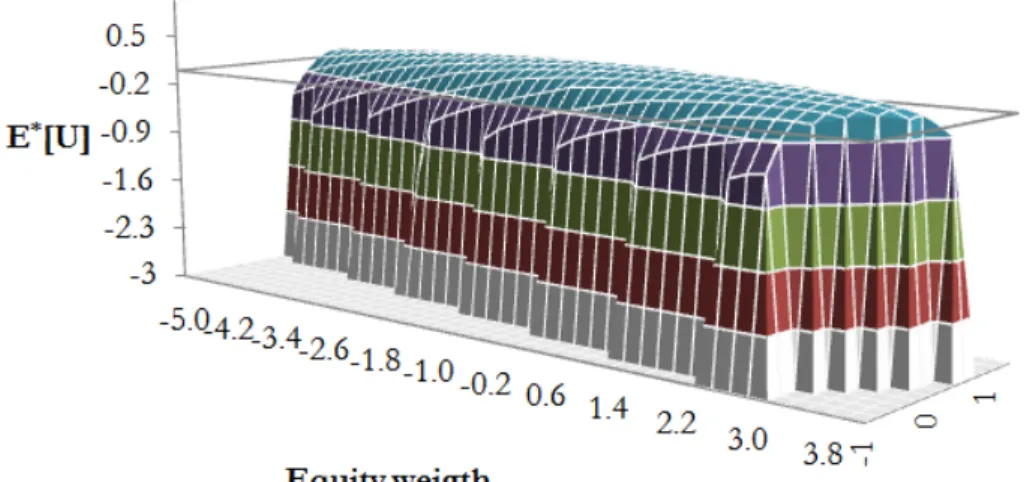
According to the …rst main implication of my model, both countries’VoV load positively on all portfolios’variance premiums (see Eqs. (1.4) to (1.6)). In order to show this implication, Figure 1.4 displays the (unconditionally expected) VoV loads on the variance premium for all portfolios. The …gure shows the components of the variance premiums for alternative
values of the risk aversion ( ), the weight of the leader country (!), and the correlation of
consumption ( ). The simulations show that the implied size of the US VoV load dominates
that of Germany in all cases considered. The dominance of the US VoV increases with the
relative size of the leader economy (!), and with the relative dependence of the follower
economy ( ). The contribution of the follower economy VoV in the variance premiums,
on the other hand, is almost insigni…cant no matter the size nor the independence of the consumption process in this economy.
The simulations also suggest that the magnitude of the expected variance premiums monotonously increases with the risk aversion, and decreases with the relative size of the
riskiest market.20 The riskiest market is assumed, for coherence, to be that in the follower
country. However, for all cases considered, the average variance premium is quantitatively far from that empirically observed for these two countries (see Table 1.1). The limitation to quantitatively re‡ect the observed premium in models with recursive preferences has been previously documented by Drechsler and Yaron (2010) in a single-country setting.
In unreported results, I show that the model-implied variance premium correlation across the two countries is above 0.98 for all simulations. This results is to be expected given the high common component of the leader country VoV in all variance premiums. Actually, for all cases considered, the model implies that the leader country VoV accounts for more than 99% of the total cross-country variance premium covariance. Surprisingly, the result on the dominant role of the leader country’s VoV holds no matter the relative size of the follower economy ((1 !)<0:5) or its implied correlation with the leader economy.
In sum, the numerical simulations show that the VoV generated in the leader economy accounts for most of the systematic component of the variance premiums. Therefore, the VoV generated in the leader economy plays the key role in explaining the variance premium 1 8In the following section, the identi…cation of the leader economy will be fully given by the empirical
evidence.
1 9A full calibration of my model is out of the scope of this paper. This paper’s attention is centered in
the qualitative implications of my model. These implications explain in turn the main empirical …ndings of this paper such as the local predictability puzzle and the ability of the US variance premium to predict all other countries equity returns.
2 0It is easy to show the same monotonous relation for the IES . Results for the relation between and
for all portfolios. This in turn implies that the leader country VoV is also the key driver of the expected variance premium correlation across countries.
Return Dynamics
According to the second main implication of my model, the two countries’VoV that uniquely characterize the variance premiums also drive the time variation in equity premiums. Figure 1.5 displays the model-implied components of the equity premium for the global and the local portfolios for alternative sets of parameters. The leader country VoV load dominates that of the follower country in all portfolios’ equity premiums for all cases considered. In some cases, the VoV of the leader country loads negatively on the follower country’s equity premium. This case only occurs when economies are poorly correlated as can be seen in Panel J and K. However, the follower country VoV loads negatively on the leader country’s equity premium for all cases considered, except of course for the extreme case where the size of the follower economy is insigni…cant (Panels C,F,I, and L).
The possibility of VoV loading negatively on the equity premiums can actually be ex-plained by the mechanism of transmission of shocks to VoV implied by the model. According to this mechanism, a positive shock to VoV in the follower country has a negative impact on the leader country’s equity premium. This e¤ect can be interpreted as a macroeconomic uncertainty induced ‡ight-to-safety from the follower to the leader economy. The possi-bility of an uncertainty ‡ight-to-safety in this direction is actually generated by the fact that the leader country consumption process is, by construction, not sensitive to the shocks generated in the follower country (Eq. (1.1)). Investing in equities in the leader country is then expected to become a more attractive investment alternative with respect to this foreign source of risk. In contrast, an uncertainty ‡ight-to-safety in the other direction (leader to follower) is not always possible. This is due to the fact that the follower country consumption process is a¤ected by the shocks in the leader economy (Eq. (1.2)). Therefore, a ‡ight-to-safety in this direction is only possible if the economies are assumed to be quite independent. For example, in the case of totally independent economies in Panel J, any equity market is free from the uncertainty risk generated in the foreign economy. Thus, in this extreme case, the VoV of one country will always load negatively on the other country’s equity premium.
As a consequence of the second main implication of my model, both countries’VoV also play a role in explaining the covariance of equity returns across countries. As expected, even if the follower economy has a large (relative) size, the VoV of the leader country dominates.
The dominance of the leader country VoV increases with the relative size of its economy (!),
and the degree of dependence across the two economies ( ). In line with the simulations
in Figure 1.5, the VoV generated in the follower country may even load negatively on the covariance of returns. Actually, in the case of totally independent or mildly correlated economies, the simulations con…rm that even VoV generated in the leader economy might
load negatively on the covariance of returns.21
Finally, the simulations in Figure 1.6 show the relation between the correlation across economies and the model-implied correlation across equity markets. The simulations re‡ect the documented disparity between the correlation of equity markets and the correlation of economies. They show that the equity return correlation is in some cases higher than the im-plied correlation of consumption. In particular, the simulations suggest that for moderately
risk averse agents ( > 2) and moderately correlated economies, the implied correlation
across equity markets is larger than that implied by the correlation of consumption. This result arrives as a direct consequence of the recursive nature of the representative agent’s preferences.
In sum, the numerical simulations show that the VoV generated in the leader economy plays the key role in explaining the time variation in the equity premium of all portfolios. As a consequence of this implication, the leader economy VoV also plays a dominant role in explaining the time variation in equity return correlations across countries. The simula-tions also show some consequences derived from the model setup. In particular, from the assumptions of integrated markets where the representative agent is endowed with recursive preferences and one economy behaves as a follower. For example, the model introduces the possibility of a macroeconomic uncertainty induced ‡ight-to safety, which in turn introduces the possibility that the VoV of one country covaries negatively with the equity premium of another country.
1.5
The Variance Premium and International Equity
and Option Markets: Empirical Evidence
In this section, I present the empirical evidence based on the qualitative implications of the GE model analyzed in Section 1.4. First, using the variance premiums for all countries in the sample, I investigate their role in (i) explaining the time variation in the variance premium for all other countries, (ii) predicting the variance premium correlations across countries, (iii) predicting not only the local equity returns, but also those in other countries, and (iv) predicting the correlation of equity returns across countries. Then, I propose an extension of the empirical evidence to analyze the potential role of the variance premium in explain-ing excessive comovements across equity and option markets. The excessive comovements analysis seems a natural extension to understand equity and option markets linkages around episodes of extreme macroeconomic uncertainty beyond the implications of the model.
1.5.1
Cross-country Variance Premium Correlations
A …rst implication of my model is that the variance premiums are highly correlated across countries. The high variance premium correlation is due to the common load of the leader country VoV in all variance premiums (leader, follower, and global portfolio). This in turn implies that the leader country variance premium plays a key role in predicting the variance premium correlations across countries. In order to analyze this implication, I …rst provide evidence for the variance premium correlations across countries. Then, I investigate the role of each all country’s variance premium in predicting the variance premium correlations with any other country.
Table 1.3 displays the variance premium correlations across all countries in the sample. In line with the …rst implication of my model, all countries but Japan show correlations above 0.5. In particular, the US and the UK show a high correlation coe¢ cient of 0.73. Among European markets, France and The Netherlands show the highest correlation coe¢ cient in the sample: 0.89. However, Japan’s variance premium shows a relatively low, or even negative, correlation with the variance premium of any other market excepts perhaps with
Switzerland.22 The evidence for Japan stands in sharp contrast to the implications of the
model. In fact, my model can only accommodate positive variance premium correlations. This is in turn derived from the ability of my model to characterize only positive variance premiums.
The results on the high variance premium correlations has been previously documented in the literature for a shorter sample of countries. For example, Bekaert, Hoerova and Scheicher (2009) …nd evidence of high risk aversion and uncertainty correlation between 2 2The highly idiosyncratic dynamic of the variance premium in Japan has been previously documented in
Germany and the US. Although their measures are not directly the variance premiums, their empirical methodology uncovers the risk aversion and uncertainty time series using the observed IV and realized volatilities for these two countries. Sugihara (2010) also …nds evidence of strong linkages in volatility premiums between the US, Germany and Japan. He actually …nds empirical evidence that the correlation between these three markets is stronger around certain episodes; in particular, after the subprime crisis. However, in this paper, I not only extend the evidence for a larger sample of countries but also provide a fundamental explanation for the dynamics of the variance premium correlation across countries. In particular, my model relates the high variance premium correlation across countries to a systematic component which is mainly driven by the leader country variance premium.
A direct consequence of the common component in all variance premiums is that the variance premium correlations are predicted by the leader country’s variance premium. In
order to test this consequence, Table 1.4 reports the estimated coe¢ cients 1;jk for the
following regressions:
t(vpj;t;t+1; vpk;t;t+1) = 0;jk+ 1;jkvpk;t+ jk;t;
where the correlation coe¢ cient for the period tto t+ 1is calculated using daily data for
the variance premiums of the two countries for the month starting immediately after the realization ofvpk;t 1.23;24 The evidence suggests that the US variance premium predicts the one-month-ahead variance premium correlation between the US, Germany, and Japan (…rst
horizontal block of results).25 However, the results show that the US variance premium
does not outperform all other countries’variance premium. For example, the …rst vertical block of results in the table suggests that the variance premiums in Germany, Japan, the UK, Switzerland and The Netherlands can also forecast the variance premium correlation
between these countries and the US.26
In sum, the evidence in this section suggests that the variance premium correlations across countries increase following episodes of increasing variance premiums. It also suggests that the model-implied dominant role of the leader country variance premium restricts the potential ability of other countries in predicting one-month ahead variance premium correlations. In order to explore higher frequency correlation patterns, in section 1.5.3, I investigate the role of the US variance premium in explaining excessive variance premium comovements at the daily frequency.
1.5.2
Cross-Country Equity Return Correlations
The second main implication of my model is that the variance premiums covary with the equity premiums (Eqs. (1.9) and (1.10)). This is due to the fact that the VoV shocks that uniquely characterize the variance premiums also load on both countries’equity premiums. In particular, the model implies that the leader country’s VoV dominates that of the follower country in all equity premiums. As a consequence, the variance premium of a leader country should outperform that of the follower country in predicting local and foreign returns. In this section, I provide evidence for the role of foreign variance premiums in predicting equity returns for all countries in the sample.
2 3The following month (t; t+ 1) is assumed to be the period22days after the realization ofvp k;t. 2 4Equation (1.7) actually has an implication on the variance premium covariance. To avoid a potential
scale problem, and make results easier to interpret, I only report cross-country correlations. An expression for the variance premium correlation from Eq. (1.7) is direct, although not necessarily linear in VoV.
2 5In unreported results, I actually show that, except for the variance premium measure based on the
martingale assumption, the predictive role of the US variance premium over its correlation with Germany and Japan holds for all alternative variance premium speci…cations considered.
2 6Given the high correlation invp
tacross countries, it would be hard to disentangle the simultaneous role
Table 1.5 reports the estimation results for the following regressions:
(r rf)j;t;t+3= 0;j;k+ 1;j;kvpk;t+ 1;j;kdyj;t+ 1;j;ktsj;t+ j;k;t;
where (r rf)j;t;t+3 represents future compounded annualized excess returns 3-months
ahead, dyj;t is the local dividend yield, and tsj;t is the local term spread.27 On top of
the local predictability evidence discussed in Section 1.3, the evidence in Table 1.5 suggests that only the US variance premium plays a signi…cant role in predicting equity returns for all other countries in the sample. Nevertheless, for other pairs of countries, the predictive power of the foreign variance premium over international equity returns holds. This is the case for the signi…cant predictive power of the Japanese variance premium over the equity returns of Belgium and France. It is also the case for the (often borderline) predictive power of the variance premium of all countries, except for Switzerland and Japan, over the US equity returns.28
In order to investigate more in depth the predictive power of the US variance premium over international equity returns, Figure 1.7 reports the estimation results for the following regressions:
(r rf)j;t;t+h= 0;j;h+ 1;j;hvpU S;t+ 1;j;hdyj;t+ 1;j;htsj;t+ j;h;t;
where (r rf)j;t;t+h represents future compounded annualized excess returns h-months
ahead. The results suggest that he predictive power of the US variance premium for all countries except perhaps for Japan resembles the hump-shaped pattern found by BTZ for the US (local return predictability). This pattern re‡ects the fact that the variance premium should be a dominant predictor for horizons where the VoV is the main source of variation in equity returns. The extension of this evidence for other countries indicates that the US VoV is the dominant source of variation in all countries’equity returns for horizons between 3 and 6 months. The …gure also suggests that the predictive power of the US variance premium is
complementary to that of local term spreads and dividend yields.29 Now, when compared
to Figure 1.3, the evidence also suggest that the US variance premium outperforms the local variance premiums in predicting equity returns for all countries considered. In unreported results, I show that the ability of the US variance premium to predict one-quarter ahead foreign returns holds if a noise signal is added to the original variance premium. For all countries, except perhaps for the Netherlands and Japan, the standard deviation of the
noise signal has to be at least 50% that of the original US variance premium before its
predictive power disappears.30 Moreover, the predictive power of the US variance premium
holds for all alternative variance premium speci…cations considered, except perhaps for the range-based estimation.31;32
2 7The evidence suggests that the predictive power of the variance premium is stronger at the quarterly
horizon. This result is in line with the …ndings in BTZ for the US and is discussed in detail in the international setting below.
2 8In fact, in unreported results, I show that not even a proxy for the world variance premium (with and
without the US) is able to signi…cantly predict equity returns for all other countries in the sample. The world variance premium exercise relates to concurrent independent evidence found by Bollerslev, Marrone, Xu and Zhou (2011).
2 9The hump-shaped predictability pattern, as well as the signi…cance of the US variance premium in
predicting foreign equity returns is robust to considering the US term spread and dividend yield. Results for these regressions are available upon request.
3 0For the Netherlands and Japan, adding any noise to the US variance premium almost immediately
weakens its predictive power. In contrast, for the UK, the standard deviation of the noise signal has to be at least 70% that of the original variance premium before its predictive power disappears.
3 1When the range based forecast of realized volatility is used, the US variance premium predicts returns
only for the UK, Belgium and France.
3 2Results for the robustness tests are left unreported in order to save space and center the discussion. The
results for the noise stress tests, the alternative variance premium speci…cations, samples, currencies, as well as for alternative variance covariance matrix approximations (In particular, Hodrick, 1992) are available
As a consequence of the systematic component of equity premiums, the leader country variance premium should also be a useful predictor of equity return correlations across countries (Eq. (1.11)). In order to test this consequence, Figure 1.8 reports the estimation results for the following regressions:
t(rj;t;t+h; rU S;t;t+h) = 0;jk+ 1;j;U SvpU S;t+ jk;t;
where t(rj;t;t+h; rU S;t;t+h) is the h-months ahead equity return correlation between any
country and the US. The results suggest that the US variance premium predicts equity return correlations between the US and any other country in the sample except for Japan and Belgium. As for the equity