Fully Automatic Analysis of Engagement and Its
Relationship to Personality in Human-Robot
Interactions
Hanan Salam
∗, Oya Celiktutan
∗, Isabelle Hupont, Hatice Gunes, and Mohamed Chetouani
Abstract—Engagement is crucial to designing intelligent sys-tems that can adapt to the characteristics of their users. This paper focuses on automatic analysis and classification of engage-ment based on humans’ and robot’s personality profiles in a triadic human-human-robot interaction setting. More explicitly, we present a study that involves two participants interacting with a humanoid robot, and investigate how participants’ personalities can be used together with the robot’s personality to predict the engagement state of each participant. The fully automatic system is firstly trained to predict the Big Five personality traits of each participant by extracting individual and interpersonal features from their nonverbal behavioural cues. Secondly, the output of the personality prediction system is used as an input to the engagement classification system. Thirdly, we focus on the concept of “group engagement”, which we define as the collective engagement of the participants with the robot, and analyse the impact of similar and dissimilar personalities on the engagement classification. Our experimental results show that (i) using the automatically predicted personality labels for engagement classification yields an F-measure on par with using the manually annotated personality labels, demonstrating the effectiveness of the automatic personality prediction module proposed; (ii) using the individual and interpersonal features without utilising personality information is not sufficient for engagement classification, instead incorporating the participants’ and robot’s personalities with individual/interpersonal features increases engagement classification performance; and (iii) the best classification performance is achieved when the participants and the robot are extroverted, while the worst results are obtained when all are introverted.
Index Terms—Human-Robot Interaction, Engagement Clas-sification, Personality Prediction, Affective Computing, Person-Adaptive Systems
I. INTRODUCTION
Social interactions between humans are governed by mul-tiple personal and contextual factors [1]. People interact in a certain manner with others because 1) they are characterized by a certain personality which affects their perception and actual behavior [2]; and 2) their are able to draw certain judgments about the characteristics (e.g., personality) of the person they are interacting with, which allows them to adapt their behaviour to others and leads to more engaging expe-riences. To create such human-like natural interactions in a human-robot interaction context, a humanoid robot needs to
∗Both authors contributed equally to this article.
H. Salam, I. Hupont and M. Chetouani are with Institut des Systèmes Intelligents et de Robotique, Sorbonne Universities, Paris, France.
O. Celiktutan and H. Gunes are with the Computer Laboratory, University of Cambridge, United Kingdom.
be endowed with the ability to infer its user’s personality. The more the robot is aware of the person it is interacting with, the better it will be able to adapt its behaviour to him/her and will be able to engage the user in the interaction.
In applications ranging from interaction with embodied conversational agents to robots, one of the main challenges is to maintain users’ sense of engagement [3]. Different strategies to foster users’ behavioural engagement have been proposed in the literature, for example, backchannel responses [4], feedback [5], politeness [6], endowing the agent with hu-mor [7], and managing the agent’s surprise [8] or alignment [9] strategies. These studies focused on analysing the effect of these strategies on the engagement of the user, however, they ignored the relationship between the user’s personality and engagement.
In light of these, there arises the need to question whether implementing the aforementioned strategies increases the en-gagement of the user, or whether the user’s personality is such that he/she already is able to engage easily with technology. To be able to answer these questions, we need to integrate an understanding of the user’s personality, predict the user’s behavioural engagement and examine the relationship between personality similarity/dissimilarity and engagement.
There is an increasing interest in the literature in studying groups1 (e.g., group cohesion [10] in the context of task-oriented groups). Similarly, in multi-party human-robot in-teraction where the robot’s goal is to engage more than one participant, it would be more appropriate to study how engaged a single person is together with the engagement state of multiple people.
Despite its importance, there has been relatively a few works focusing on engagement and/or its relationship to personality in social interaction settings. In a human-human interaction setting, Oertel and Salvi [11] manually annotated speech activity and eye gaze patterns to describe the participants’ behaviours with respect to each other and model individual engagement and group involvement in groups of human parti-cipants, however they didn’t take into account the participants’ personalities. In a human-robot interaction setting, Aly and Tapus [12] made a robot to manifest two different personality types, namely, extroverted and introverted, and investigated whether people prefer a robot matching their personalities based on self-asessments, in other words, without conducting 1According to Meriam Webster dictionary, a group is defined as a number
any automatic engagement prediction. In a human-virtual agent interaction setting, Cerekovic et al. [13] incorporated a set of multimodal features with personality traits to predict an individual’s experience of interaction, however they relied on self-assessed, manually annotated personality traits.
This paper aims at filling in the above-mentioned gaps by presenting a fully automatic analysis algorithm in the context of human-robot interaction. Our contributions can be summarised as follows. Differently from [11], [12], [13], we focus on understanding engagement and its relationship to personality in a triadic human-robot interaction scenario where two participants are involved in an interaction with a small humanoid robot. We propose an approach to model group engagement that is defined as the joint engagement state of two participants interacting with each other and a humanoid robot [14]. In order to predict individual engagement and group engagement, we exploit nonverbal visual features that are computed automatically in contrast to [11] that uses manu-ally annotated features. Unlike [13], we predict the personality of each participant from the extracted features and further predict participants’ engagement states using these automat-ically predicted personality labels since manually annotated personality labels might not be available in the course of an interaction in a real-life situation.
We examine the impact of human participants’ personality traits on their engagement with the robot across two robot conditions (i.e., extroverted robot versus introverted robot) as introduced in Section IV. The role of the robot is to vary the context of the interaction and lead the conversation by asking the participants a set of questions. In Section V, we investigate two sets of non-verbal visual features:individual featuresand
interpersonal features. While individual features describe each of the participants’individualbehaviours (e.g., body activity),
interpersonal features model the participants’ interpersonal
behaviours (e.g., relative distance, attention given and re-ceived) with respect to the other parties in the interaction (robot and other participant). In Section VI, we examine rela-tionships between the extracted features and personality labels and engagement labels. In Section VII, we first utilize these features to predict the personality of each participant. We then perform engagement classification using the extracted features together with the automatically predicted personality labels and demonstrate how classification performance changes when the automatically predicted personality labels are used instead of the manually annotated personality labels. For classifying group engagement, we combine the sets of extracted features from both participants.
II. RELATEDWORK
A. Engagement
In the context of Human-Robot Interaction (HRI), engage-ment is defined by Sidner et al. [15] as “the process by which two (or more) participants establish, maintain and end their perceived connection”. Previous research on engagement attempted to underpin the underlying components of engage-ment. Corrigan et al. [16] demonstrated that engagement is mainly composed of two components:cognitiveandaffective.
While the cognitive component is manifested mainly by at-tention, the affective component is embodied by enjoyment. In their extensive review on engagement definition, Glas et al. [17] have discussed a set of concepts that are strongly related to engagement and sometimes even used interchange-ably. These concepts include attention, involvement, interest,
immersion,rapport,empathyandstance.
Computational methods of engagement prediction aimed at detecting different phases of engagement: (1) intention to engage; (2) engagement level and (3) disengagement. Fosteret al. [18] focused on the detection of the user’s intention to engage. Leite et al. [19] investigated the detection of disen-gagement in individual and group interactions. Benkaouar et al.[20] built a multi-class model for the recognition of all three phases of engagement (i.e., intention to engage, engaged and disengaged). Peters et al.[21] defined three quality levels of engagement: engaged in the interaction, superficially engaged with the scene and action space and uninterested in the scene or action space. Others deal with the detection of the levels of engagement. Castellano et al. [22] defined two classes, i.e., medium-high to high engagement and medium-low to low engagement. Michalowski et al. [23] differentiated between the different levels of engagement according to if the user is present, interacting, engaged or just attending. To build models that predict the different stages of engagement, various features were proposed in the literature. These include contextual [14], [22], [24], attentional [25], [26], affective [18], [22], physio-logical [27], motion [28], and proxemics features [23].
Bohus & Horvitz [29] pioneered research on engagement in multi-party interactions. They implemented engagement strategies which enable a robot to deal with situations where multiple users were present. However, they did not model personality of the participants and engagement of the group. Leite et al. [19] investigated how a model trained on data collected from participants interacting individually with a robot performs on test data collected from group interactions, and vice-versa. Salam and Chetouani [14] conducted a study in a triadic HRI scenario to investigate to what extent it is possible to infer an entity’s engagement state starting from the cues of the other entities in the interaction. Their results showed that in a multi-party interaction, the cues of the other entities in the interaction can be used to infer the engagement state of the entity in question, which suggests that we act as one entity when we are in the context of a group. However, they have not performed any automatic analysis of personality or group engagement as we do in this paper. Oertel and Salvi [11] dealt with modelling individual engagement and group involvement as well as their relationship using manually annotated features based on speech activity and gaze patterns only. In particular, they summarised the gaze and speech behaviour of the participants individually and with respect to each other. But they did not take into account the participants’ personalities.
B. Personality
Personality computing has been one of the hottest topics in the last few years [30]. While most of the works have
focused on single-person scenarios, there have been several works studying personality analysis in multi-party social in-teractions [31], [32], [33]. Although these works are not within the scope of Human-Robot Interaction, we briefly review them due to their relevance in terms of used features and personality prediction approaches.
In a collaborative context, Staiano et al. [31] asked four participants to perform Mission Survival task [34]. Recorded meetings were divided into short clips and each was assessed by external observers with respect to the Big Five personality traits [35] (extroversion,neuroticism,openness, conscientious-ness, and agreeableness) independently. To characterise the social interaction, they extracted a set of vocal and visual features such as speaking activity, variation in prosody and attention features (e.g., attention given and attention received based on head pose and eye gaze). Clip-level classification results showed a better accuracy forextroversionand neuroti-cism, where social attention features and speaking energy were the prominent features.
Aran and Gatica-Perez [32] used recordings from ELEA corpus [36], which is similar to [34] in terms of the num-ber of participants and the task. They combined audio and motion features with a set of high level features based on head, body, speaking activity and focus of attention. The best classification results were achieved with feature-level fusion for extroversion (74.5%). In their follow-up study [33], they took into account similar features using the same recordings from [32]. In addition to individual-level features, they pro-posed a method to detect temporal co-occurrence patterns in the target’s features and the group’s features (e.g., the others change their postures as the target speaks) and used these co-occurrence features to predict the personality of the target. Whileagreeableness was the trait most benefiting from co-occurrence features, the best classification accuracy was achieved with individual-level features for openness.
Within the scope of HRI, Rahbaret al.[37] used individual features (i.e., quantity of motion) and interpersonal features (i.e., synchrony, dominance and proxemics) to predict the ex-troversion trait. They achieved the best F-measure when they fused individual and interpersonal features at the feature level using Logistic Regression.
Differently from the works summarised above, in this paper, we focus on understanding personality in a multi-party HRI scenario where two participants are involved in an interaction with a small humanoid robot and investigate the use of indi-vidual features (e.g., body activity) and interpersonal features (e.g., relative distance, attention given and received) to predict Big Five personality traits in this context.
C. Interplay between Engagement and Personality
Various research studies were conducted on the interplay between the users’ engagement states and their personalities. For instance, Ivaldiet al.[38] assessed the influence of extro-version and negative attitude towards robots on the duration and frequency of gaze and speech cues during a cooperative task, where a human had to physically manipulate a robot to assemble an object. Two prominent findings were: (i) the more
people are extrovert, the more and longer they tend to talk with the robot; (ii) the more people have a negative attitude towards robots, the less they look at the robot’s face but the more they look at the robot hands where the assembly and the contact occur. Their results provided evidence that the engagement models widely used in HRI can significantly benefit from the users’ attitudes towards robots and their personality traits.
Some studies examined the effect of personality match (similar or complementary personality types) on the engage-ment state of the participants. For example, Park et al. [39] conducted a study using robots that were programmed to mimic humans’ personality types (i.e., introverted, extroverted or intermediate). The results indicated that participants who interacted with a robot exhibiting a similar personality to theirs were more comfortable than those who were exposed to a robot having a complementary personality. A similar phenomenon was observed by Aly and Tapus in [12] where they manipulated robot’s behaviours to display either an extro-verted personality or an introextro-verted personality and matched the participants with the robot exhibiting a personality similar to theirs. Celiktutan and Gunes [40] studied the relationship between the interaction experience (measured in terms of the level of enjoyment), the personality of the robot and the personalities of participants using first-person vision features. Their results showed that, for the extroverted robot condition, perceived enjoyment with the robot was found to be signif-icantly correlated with participants’ extroversion and agree-ableness traits. However, for the introverted robot condition, such a relationship could not be found.
While these HRI studies were in line with the similarity rule, in the context of Human-Agent Interaction (HAI) the experimental results in [13] supported the complementarity rule [41]. Cerekovicet al.[13] considered two virtual agents from the SEMAINE System [42]. While one agent (Obadiah) was gloomy and neurotic with low variation in speech and a flat tone, the other one (Poppy) was cheerful and extroverted with frequent gestures and head nods. Each participant evalu-ated their interaction with both agents along three dimensions: quality, rapport and likeness. In order to predict the levels of these three dimensions, they took into account both visual fea-tures and manually annotated personality trait labels collected from external observers. While the personality scores alone did not yield good results, they boosted the performance when combined with the visual features. They found that extroverted people tended to like the neurotic agent, whereas people that score high onneuroticismliked the cheerful agent.
In this paper we examine the relationships between en-gagement and personality as in [12] but in a triadic HRI scenario as in [40]. While [40] only focuses on personality classification, we perform both individual engagement and group engagement classification on top of the personality prediction, where we incorporate personality traits as a feature to classify engagement. Unlike [13], we predict personality of each participant from visual features and perform engagement prediction using these automatically predicted personality la-bels.
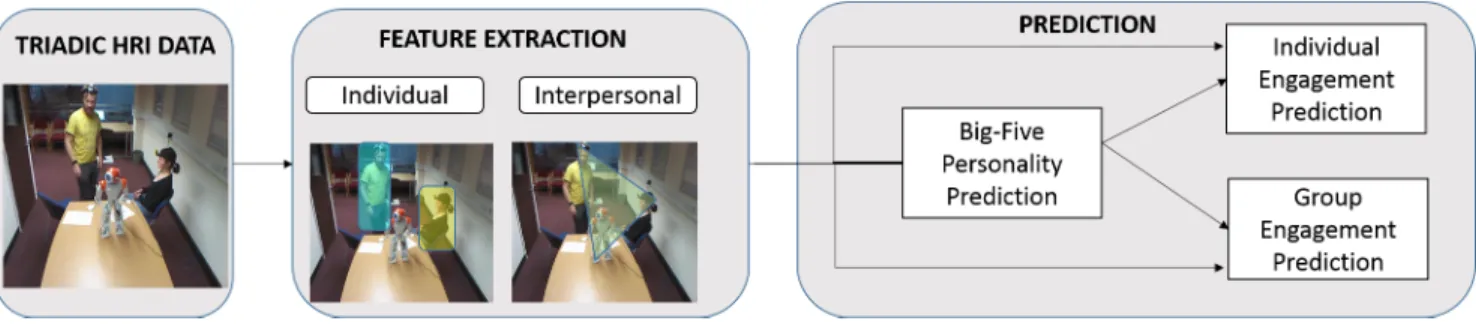
Fig. 1. Overview of our proposed approach.
III. OVERVIEW OF THEPROPOSEDWORK
Our approach can be divided into three phases. As shown on the left hand side of Figure 1, we deal with a triadic HRI scenario consisting of two participants and a robot (cf. Section IV-A). The motivation behind using a triadic HRI scenario comes from the assumption that people tend to show a different facet of their personalities when they are in a multi-party interaction context. This leads to a better analysis of the engagement state or the personality of each participant in the presence of other entities in the interaction.
We first extract a set of individual and interpersonal features that describe non-verbal behaviours of the participants at the individual-level as well as their behaviours with respect to each other and with respect to the robot as illustrated in the middle of Figure 1 (cf. Section V). We then perform engagement classification (i.e., engaged versus non-engaged) using a two stage approach as shown on the right hand side of Figure 1. We train automatic regressors for each personality trait and use these regressors to predict participants’ Big Five personality traits (cf. Section VII-B). Personality predictions are used together with a rich set of individual and interpersonal features and the robot’s personality to train the engagement classifier (cf. Section VII-C), which offers insight into the impact of personality on the prediction of individual engagement. Fi-nally, we modelgroup engagementby combining the extracted features from both participants.
IV. DATA ANDLABELS
The goal of this study is to analyse the role of personality in the prediction of human participants’ engagement states in Human-Human-Robot Interactions. In order to vary the inter-action context and observe different participants’ behaviours, we use a robot that is made to alternately portray two different personalities, namely, extroverted and introverted, in each interaction session.
A. Data
We used the Wizard of Oz setup introduced in [40] with the humanoid robot NAO [43]. NAO was remotely controlled to ask a set of pre-scripted questions to two participants regarding their memories, occupations as well as their feelings towards robots. In order to obtain various combinations of personality types (e.g., an extroverted participant, an introverted partic-ipant and an extroverted robot), we implemented different
behaviours on the robot associated with extroversion and
introversion. The extroverted robot displayed hand gestures and talked faster and louder. On the other hand, the introverted robot sounded hesitant, less energetic and exhibited a still posture in the course of the interaction.
A total of 18 participants took part in our study and 12
triadic interactions between the robot and two participants were recorded using a Kinect Xbox 360 depth sensor 2 as shown in Figure 1. Four of the participants took part in the experience more than once provided that they were exposed to different robot personalities (extroverted or introverted). The participants were also asked to wear ego-centric cameras to record the interaction from first-person perspective. However, in this study we exclusively focus on the recordings from the Kinect sensor apart from the sound. Sound was recorded by the microphones built in the ego-centric cameras and then was synchronised and combined with the Kinect RGB recordings. This procedure resulted in approximately 3 hours of audio-visual recordings.
For engagement and personality annotation and automatic analysis, we segmented each recording into short clips. Each clip contains the robot asking a question to one of the participants and the target participant responding. This yielded on average19episodes per participant, per session and a total of248clips. Each clip has a duration ranging from20to120
seconds.
B. Labels
We collected annotations for the level of engagement and Big Five personality traits using an online crowdsourcing platform as explained in Section IV-B1. In section IV-B2, we analyse the obtained annotations.
1) Annotation of Clips: Crowdsourcing is a model of labor production that outsources work to large, loosely defined groups of people [44]. Collecting ground truth labels through crowdsourcing for affective computing has recently gained popularity as it enables collecting responses from a large group of people within a short period of time. Due to its efficiency and rapidity, we used a crowdsourcing service called Crowdflower [45] to collect labels for the level of engagement and the personality traits of participants.
Current research in crowdsourcing demonstrates that the number of untrustworthy users is usually not large [46].
There is evidence of a number of different techniques (“hon-eypots") used to guard against malicious or lazy labellers. A commonly used “honeypot" technique consists of asking explicitly verifiable questions to reduce invalid responses [47]. Even though CrowdFlower platform provides its own workers selection mechanisms to ensure trustworthiness and reliability on the test participants, a “honeypot" extra question was added to both engagement and personality questionnaires. In this multiple-choice question, participants were asked about the main dialogue topic in the clip. Only one of the answers was true, while the remaining answers had no relation at all to the clip’s content as shown in Table I (see Part 1).
For each clip, we designed two different jobs, namely, engagement assessment and personality assessment. For en-gagement assessment, in line with the state of the art (see Section II-A), we considered engagement as a construct which is composed ofinvolvement,interestandenjoyment, and used the Temple Presence Inventory (TPI) questionnaire [48] to have the engagement levels of the participants (low engage-ment vs. high engageengage-ment) annotated by external observers. This questionnaire aims at measuring a person’s immersive tendency, or presence, in a virtual environment. It was previ-ously used in the context of an interactive gaming environment (SimCity Classic and The Sims 3) [48] and in the context of human-robot interaction to assess user’s engagement [49]. As recommended in [48], we selected individual items that were useful and appropriate for our study, and we adapted the selected items to a human-robot interaction context. The questionnaire used in our study is presented in Table I (see Part 2-a) where we also added a supplementary item on the general liking of the interaction (the fourth item). For personality assessment, we used the widely known Big Five Inventory personality questionnaire [50].
Since each clip contained two participants, we divided the questionnaires into two parts, i.e., one part for assessing the participant to the right of the robot and another part for assessing the participant to its left. For both engagement and personality, each job consisting of one clip was assessed by a total of 10 judges. For engagement, each judge was reimbursed with 5 cents per job, while for personality, 10 cents were reimbursed per job as the personality questionnaire was longer than the engagement questionnaire. In order to prevent repeated rating effects, jobs containing clips of the same target were launched on a delay basis. All the jobs were restricted to 12 selected European countries, USA, Canada and South Africa, and were completed by a total of166and183different workers within a duration of two weeks for engagement and personality, respectively.
Group Engagement Labels. We propose a definition of en-gagement that concerns group interactions. We define “group engagement" as the engagement state of two entities in the interaction together with another entity. Looking at the illus-tration in Figure 2, the entities of the interaction are the two humans and the robot. In this case, the group engagement represents the engagement state of both participants with the robot. In other words, group engagement occurs when both participants are engaged with the robot. Similar notions in group interactions are found in the literature and should not
TABLE I
ENGAGEMENT AND PERSONALITY QUESTIONNAIRES USED IN OUR STUDY
Part 1 – “Honeypot" Question
Tick the right answer The Robot asks the people:
1. about their feelings and thoughts towards robots. 2. about their favorite football team.
3. personal questions, for example, about their memories. 4. about the places they recently visited.
Part 2-a – Engagement by the Temple Presence Inventory (TPI)[48]
Rating scale: Not at all - Very much (10 points) The person to my left/right:
1. is engaged/involved in the interaction with the robot. 2. is bored.
3. is interested by what the robot is saying. 4. likes this interaction.
Part 2-b –Personality by the Big-Five Inventory [50]
Rating scale: Not at all - Very much (10 points) The person to my left/right:
1. is reserved. 2. is generally trusting. 3. is relaxed, handles stress well. 4. tends to be lazy.
5. has few artistic interests. 6. is outgoing, sociable. 7. tends to find fault with others. 8. does a through job.
9. gets nervous easily. 10. has an active imagination.
Fig. 2. Illustration of group engagement.
be mixed up with the notion of group engagement as defined in “Cohesion" and “Mutual Engagement". According to Casey-Campbell [51], cohesion is defined as “the group members’ inclinations to forge social bonds, resulting in the group sticking together and remaining united". On the other hand, in the context of music improvisation, mutual engagement occurs when people creatively spark together and enter a state of group flow [52].
In this paper, we refer to the engagement of a single partici-pant with the robot as “individual engagement" to differentiate
it from “group engagement". To obtain ground-truth labels for group engagement, we follow a bottom-up approach and move from individual-level assessments by simply assigning one of the two labels, i.e., similar and dissimilar, to each clip. While similarrefers to the cases where both participants are either engaged or non-engaged,dissimilar corresponds to cases where only one of the participants is engaged.
2) Analysis of Annotations: In Table II, we present inter-agreement and intra-inter-agreement for individual engagement an-notations. For inter-agreement, the level of consensus between different raters was measured by the Intra-Class Correla-tion [53]. We used ICC(1,1) and ICC(1,k) as in our exper-iments each target participant was rated by a different set of k raters (k = 10 in our case). While ICC(1,1) measures the extent to which any two raters agree with each other, ICC(1,k) measures the degree of agreement for annotations that are averages of k independent annotations on the tar-get participants. The ICC(1,1) shows lower correlations for single rater (0.03 ≤ ICC(1,1) ≤ 0.27), whereas ICC(1,k) display large correlations for the averaged annotations (0.20≤ ICC(1, k) ≤ 0.79) (all measures are at a significance level of p < 0.001). Intra-agreement was measured in terms of standardised Cronbach’s α. For engagement annotations (see Table II), we obtained α= 0.76for all raters, over all items, which is widely accepted as a good level of agreement [54]. Note that we presented these values for all the clips and for10
raters per clip as we could not observe any large differences in our analyses with respect to different robot personalities (extroverted vs.introverted).
We repeated the same experiment for personality annota-tions and presented the results in Table III. Our initial analysis of personality annotations showed that ICC and Cronbach’sα values were significantly smaller as compared to individual engagement annotations. We conclude that personality anno-tation is more challenging than engagement annoanno-tation, and requires more social and cognitive skills. Assessing personality also depends on many different criteria such as the rater’s personality, rater’s unique perspective etc. [55], which renders it more subjective to reach a high level of agreement between different raters. Therefore, prior to any analysis, we selected 8 raters with the highest agreement out of 10 raters per clip. This procedure resulted in a total of 219 clips and 8 annotations per clip. For the remaining clips, inter- and intra-agreement in terms of ICC and Cronbach’sαare presented in Table III-(a). We implemented a ranking-based method to see whether any low quality raters remained. Such methods were previously employed in the literature of personality computing. For instance, [56] used a method which ranked raters based on pairwise correlations of raters’ responses measuring different traits. In this study, we approached this problem similarly. We first computed the weighted mean of the raters’ responses. The raters were then ranked according to the distances between their responses and the weighted mean. The top raters having the least distance from the weighted mean were kept for further analysis. For assessing the reliability of this approach, we com-puted the ICC(1,1) and ICC(1,k) for different judge numbers ranging from k = 8 (without elimination) to k = 3 (eliminating the 5 least ranked raters). Our results showed that setting
TABLE II
ANALYSIS OF ENGAGEMENT ANNOTATIONS: INTER-AGREEMENT IN TERMS OFICC (AT A SIGNIFICANCE LEVEL OFp <0.001)AND
INTRA-AGREEMENT IN TERMS OFCRONBACH’Sα
Inter Intra ICC(1,1) ICC(1,k) Cronbach’sα
Engaged 0.27 0.79
-Bored 0.03 0.20
-Interested 0.10 0.51
-Liked 0.10 0.54
-Overall 0.20 0.71 0.76
the number of raters to 5 (k=5) provided a good trade-off between inter- and intra-rater agreement. Additionally 5 is the typical number of raters used in the related literature. It also increased the inter-agreement from the range of 0.28−0.41
(at a significance level of p < 0.001) to 0.52−0.64 (at a significance level of p < 0.001), where the highest level of agreement was obtained for conscientiousness. Selecting 5 raters out of 8 raters did not affect the intra-agreement for agreeableness, conscientiousness and neuroticism, how-ever, improved the intra-agreement significantly for extrover-sion(see Table III-(b)).
To generate ground-truth labels per clip, we aggregated engagement and personality annotations of multiple raters by taking their average. We used these labels for computational analysis as explained in Section VII.
V. FEATUREEXTRACTION
We explored a rich set of features to model the behaviours of the participants in the interaction. The extracted features can be divided into two groups:individual featuresand inter-personal features. Individual features describe the individual behaviours of each participant, e.g., body activity computed from articulated pose and motion energy images, body appear-ance, etc. Interpersonal features characterize the inter-personal behaviours of the participants with respect to each other and the robot. These include the visual focus of attention (VFOA), the global quantity of movement, the relative orientation of the participants, the relative distance between the participants, and the relative orientation of the participants with respect to the robot.
As shown in Figure 3, our feature extraction pipeline starts with the detection of the group in the clip, i.e., the region of interest (ROI) comprising the robot and both participants. The ROI is further used to localize the robot and the two participants by fusing RGB and depth sequences. Once we locate the human participants, we use this information to estimate the articulated pose (skeleton) of the human parti-cipants and detect their heads/faces. These outputs are further used to compute individual features (see Section V-B) and interpersonal features (see section V-C).
A. Group, Participant and Robot Detection
1) ROI/Group Detection: In a given clip, we extract the ROI that contains the participants and the robot. The ROI allows us to avoid false positives during feature extraction. To detect the ROI, a binary mask as illustrated in Figure 4 is
TABLE III
ANALYSIS OF PERSONALITY ANNOTATIONS: (A) RESULTS AFTER THE FIRST STEP OF ELIMINATION WHERE THE NUMBER OF RATERS IS8 (K=8); (B) RESULTS AFTER THE SECOND STEP OF ELIMINATION WHERE NUMBER OF RATERS IS SET TO5 (K=5). WHILE INTER-AGREEMENT IS MEASURED IN TERMS OFICC (AT A SIGNIFICANCE LEVEL OFp <0.001),INTRA-AGREEMENT IS MEASURED IN TERMS OFCRONBACH’Sα. (EX:EXTROVERSION, AG:
AGREEABLENESS, CO: CONSCIENTIOUSNESS, NE: NEUROTICISM, OP: OPENNESS).
(a) k=8 Inter Intra (b) k = 5 Inter Intra
ICC(1,1) ICC(1,k) Cronbach’sα ICC(1,1) ICC(1,k) Cronbach’sα
EX 0.07 0.36 0.04 EX 0.19 0.54 0.40
AG 0.05 0.28 0.40 AG 0.21 0.57 0.41
CO 0.08 0.41 0.39 CO 0.27 0.64 0.41
NE 0.05 0.32 0.51 NE 0.24 0.61 0.57
OP 0.06 0.35 - OP 0.18 0.52 0.11
Fig. 3. Overview of the feature extraction pipeline.
computed by differencing consecutive frames and accumulat-ing the differences over the whole clip. This mask is further used to define a box bounding the three entities (i.e., group) as shown in Figure 4.
2) Upper Body Detection: We use the upper body detector developed in [57] to fit a bounding box to the head and the upper half of the torso of each participant. This method is based on the Deformable Part-based Models (DPMs) [58]. In [57], Viola-Jones face detector [59] was used to improve the upper body detection outputs from DPM. In this paper, we further improved this method by combining it with depth information. We created a human mask using simple heuristics (i.e., distance from the camera) and applied it to each frame prior to applying the upper body detector in order to reduce the search space.
3) Robot Detection: To track the robot in the clips, we perform Otsu’s [60] thresholding method combined with a Kalman filter on the depth data. The method constitutes three stages where each stage corresponds to the computation of a
global Otsu threshold level on the resulting depth frame. A mask of the robot is obtained for every frame from which we extract the bounding box of the mask to localize the robot. Figure 5 shows some results of the robot extraction procedure.
4) Skeleton Joint Detection: We used a body pose es-timation method [57] to detect skeleton joints (e.g., hand, elbow, shoulder etc.) within the detected upper body in RGB sequences. Once skeleton joints were estimated, we applied normalisation in order to render each skeleton independent from position and body size. For each frame, we scaled the Euclidean distance between connected skeleton joints so that the inner distance between the hip and the centre of shoulders was set to the unit length, and then we translated joint positions so that the centre of shoulders coincided with the origin of the coordinate system. We computed individual features from these skeleton joints as explained in Section V-B.
5) Head/Face Detection: We detected each participant’s facial ROI from the Kinect RGB videos. To take into account frequently occurring out-of-plane head rotations, we combined
Fig. 4. Detection of the ROI (centre) and the group (right).
Fig. 5. Examples of robot detection results.
different frontal and profile face detection models based on the OpenCV version of Viola and Jones Haar Cascade algo-rithm [59]. Once each participant’s facial ROI was detected, Intraface library [61] was applied to compute and track head roll-pitch-yaw angles. This head pose information was used afterwards to compute visual focus of attention as explained in Section V-C.
B. Individual Features
We extract a set of individual features from each partic-ipant separately. These features are grouped under (i) mo-tion/activity features extracted from depth sequences, detected upper body boxes and skeletons; (ii) appearance features (i.e., gradient and optical flow) extracted from detected upper body boxes and detected faces; and (iii) high level features such as visual focus attention.
1) Motion/Activity Features: Motion features can be di-vided into three sets based on the information source used, i.e., motion from depth images, upper body boxes and skeleton joints from RGB images.
Motion from Depth Images.In order to compute the quantity of motion of each participant in the clips, we firstly perform a pre-processing step to remove the robot and the background. The robot is removed using a mask which is obtained by summing up the robot’s masks from the robot localization step over all the frames. The background is removed by simple thresholding of the high values of the depth image since parti-cipants and the robot are closer to the Kinect. Secondly, motion is computed by taking the difference between consecutive images and the pixels that are moving the most are identified. From the salient pixels, we compute three features as below.
• Motion Average Image. This represents an image that shows the average motion over the whole clip. It is computed by averaging the motion per frame over the whole clip.
• Motion History Image. This represents a map with in-creasing indices trailing motion where brighter pixels indicate older motion [62].
• Motion Average Signal. This represents a temporal
se-quence showing the average motion of each frame. For the whole clip, we summarize motion features (i.e., motion average image and motion history image) mentioned above by computing simple statistics such as minimum, max-imum, mean, median, standard deviation, entropy, kurtosis and skewness. In addition, the quantity of motion from the motion average image is computed by counting the number of salient pixels normalized by the image size. We also compute the normalized histogram in 6 bins from the motion average signal.
Body Activity from Upper Body Bounding Boxes.Body ac-tivity is represented in two steps. Firstly, for each clip, vertical and horizontal trajectories of the body are computed, where center of the upper body bounding box is considered as a ref-erence point. Spatial coordinates of the box center in the first frame are subtracted from the spatial coordinates of the body boxes in the subsequent frames to make trajectories position independent. In other words, we computed the displacements along vertical and horizontal directions for conjugate frames. Secondly, we compute the standard deviation of body activity in vertical and horizontal directions over the whole sequence.
Body Activity from Skeleton Joints.We compute the speed of the joints for each of the participants. This corresponds to the distance between the joint positions in two consecutive frames.
2) Appearance Features: As appearance features, we com-pute Histogram of Gradient (HOG) and Histogram of Optical Flow (HOF) from the detected upper body boxes and the detected faces per frame and transform these histograms into a single representation for the whole clip using the widely known Bag of Words (BoW) approach.
Upper Body. Firstly, we extract HOG and HOF features from the detected body boxes per participant, per frame. Each body box has a size of120×120and we compute72bin HOG and HOF using a dense grid. This results in169×72 = 12168
TABLE IV
AUTOMATICALLY EXTRACTED NON-VERBAL FEATURES. INDIVIDUAL FEATURES CORRESPOND TO THE NON-VERBAL BEHAVIOUR OF EACH PARTICIPANT INDIVIDUALLY. INTERPERSONAL FEATURES DESCRIBE THE BEHAVIOUR OF THE PARTICIPANTS WITH RESPECT TO EACH OTHER AND WITH RESPECT TO
THE ROBOT.
Type Acronym Description Dim.
Indi
vidual
BOW-HOG Histogram of Gradient is computed within the box bounding a participant’s upper body. A bag-of-words representation is then computed for each participant.
64 BOW-HOF Above is repeated for Histogram of Optical Flow. 64 B-ACT Body Activity is measured in terms of mean and standard deviation of the body bounding
box center along horizontal and vertical directions over time.
2 J-SPEED Joint speed is computed as the distance between the joint positions in consecutive
frames.
84 MA-NH Motion Average Signal Normalized Histogram in 6 bins. 6 MHI-STATS Motion History Image statistics (min, max, mean, median, std, skewness, and kurtosis). 7 MAI-STATS Motion Average Image statistics (same as MHI). 7 I-QoM Image Quantity of Motion is computed by counting the number of moving pixels in
the motion average image normalized by the image size.
1
Inter
personal
P-RO Participants’ relative orientation with respect each other. 7
P-RDIST Participants’ relative distance. 7
RO-ROBOT Relative orientation w.r.t robot. 7
RO-ROBOT-NH Relative orientation w.r.t robot Normalized Histogram. 3
ATT-R Attention given to robot. 1
ATT-P Attention given to the other participant. 1
ATT-U Attention unknown. 1
G-QOM Global Quantity of Movement. 1
length HOG and HOF feature vectors. Using these feature, we build two separate dictionaries for HOG and HOF using K-means algorithm implemented in [63]. Then each sequence is represented as BoW, where the number of histogram bin is set to 64. Similarly to [64] we assume that each participant in a frame is a word in the Bag of Word representation.
C. Interpersonal Features
Interpersonal features can be divided into two groups, namely, dyadic and triadic features. Dyadic features comprise the participant’s orientation with respect to each other, each participant’s orientation with respect to the robot and the distance between the participants. Triadic features include the attention of the participants and the quantity of movement of the participants and the robot together.
Visual Focus of Attention. Gaze in human-human social interactions is considered as the primary cue of attention [65]. Sidner [66] stated that “looking at the speaking conversational partner is evidence of engagement, while looking around that room, for more than very brief moments, is evidence of disinterest in the interaction and possibly the intention to disengage”. Visual Focus Of Attention (VFOA) is the discrete version of gaze that indicates who is looking at whom or what [67].
In order to detect the VFOA of each of the participants, we implement a geometry-based method. This method is inspired by the human field of view. The approximate field of view of an individual human eye (measured from the fixation point, i.e., the point at which one’s gaze is directed) is 95−110◦
temporal (away from the nose and towards the temple) [68]. The immediate field of view is around 35◦. For both eyes the combined visual field is 130−135◦ vertical and 200◦
horizontal [69] (see Figure 6 for an illustration).
We make use of the bounding boxes of the robot and the two participants and the participants’ head orientation in addition
to the skeleton fitting of the two participants. A semi-infinite ray is also issued from the nose of the participants in the direction of the 3D pose vector detected. We issue another semi-infinite ray perpendicular to the shoulder’s line together with two rays+/−35◦from the shoulder’s perpendicular (see figure 6) which approximates the human’s field of view in the image when the head pose information is not available. Furthermore, we detect the intersections of these rays with the bounding boxes of the other participants and the robot to infer the VFOA of the participant in question. The details of the VFOA detection method is presented in Algorithm 1. In every frame, VFOA of each participant is assigned to one of three labels: Robot, Other and Unknown. The label “Robot" corresponds to when the participant gives his attention to the robot, “Other" is assigned when the participant is giving attention to the other participant and “Unknown" label is set when information are not sufficient to detect the VFOA. To summarize the VFOA feature per clip, we compute the percentage of time the participant gives attention to the robot and to the other in the clip.
Algorithm 1 VFOA detection algorithm.
1: procedureVFOA DETECTION
2: RectR←Bounding Box of Robot 3: RectP←Bounding Box of Participant
4: RectOP←Bounding Box of Other Participant
5: HPRayP←Head pose vector issued from participant’s nose
6: ShouldRay←Participant’s shoulders rays
7: VFOA←Participant’s detected Visual Focus of Attention
8: Algorithm:
9: ifRectR∩RectPORHPRayP∩RectOP∩RectRORHPRayP∩RectR ORHPRayP∩RectRORShouldRay∩RectRthen
10: VFOA←Robot
11: ifHPRayP∩RectOPORShouldRay∩RectOP then
12: VFOA←Other
13: else
14: VFOA←U nknown
Global Quantity of Movement. This feature represents the relative quantity of motion of all the entities in the interaction:
Fig. 6. Left: Illustration of the human’s field of view. Right: Examples of VFOA extraction results. To the left, VFOA is approximated by the shoulders orientation due to the lack of head orientation results. To the right, the VFOA of the left person is approximated by the head orientation ray issued from the participant’s nose.
both participants and the robot. It is computed based on image differencing of the entities silhouettes over the whole clip as explained in section V-A1. The percentage of moving pixels is computed from the resulting mask.
Relative orientation of the participants. Starting from the skeletons of the participants, we compute the angle between the shoulders lines of the two participants in each frame. This represents the relative orientation of the two participants with respect to each other. Such feature has been employed in the work of Leclere et al. [70] for studying mother / infant interpersonal interaction.
Relative distance between the participants.To compute the relative distance between the participants, we compute the distance between the centers of the shoulders of the two participants obtained by the skeleton fitting step.
Relative orientation with respect to the robot. For each participant, we compute the angle between the shoulders line and the robot. Assuming that the robot’s shoulders are always horizontal, we approximate the robot’s shoulders line by the horizontal.
To summarise the relative distance between the participants and the relative orientation with respect to the robot features over the whole clip, we compute the mean, max, min, median, standard deviation, kurtosis and skewness. We also compute the normalized histogram of the relative orientation with respect to the robot feature in three bins centered at −30,
0 and30. This is another way to quantify the VFOA of each participant.
VI. CORRELATIONANALYSIS OFLABELS ANDFEATURES
Prior to training any automatic classifiers, we examined the relationships between engagement and personality labels and the extracted features. We computed Pearson correlation and tested the significance of correlations using Student’s t distribution.
Individual Engagement. We first investigated the possible relationships between the five personality traits of extrover-sion,agreeableness,conscientiousness,neuroticism, and open-ness, and the engagement dimensions of engaged, bored, in-terested,likedandoverall. Correlation values are tabulated in Table V. We only present the correlations between engagement labels and personality labels generated from 5 selected raters
TABLE V
CORRELATIONS BETWEEN THE FIVE PERSONALITY TRAITS AND THE ENGAGEMENT DIMENSIONS(AT A SIGNIFICANCE LEVEL∗<0.001AND
∗∗<0.05). CORRELATION VALUES>0.29ARE HIGHLIGHTED. Engaged Bored Interested Liked Overall EX 0.40∗ -0.29∗ 0.37∗ 0.38∗ 0.44∗
AG 0.02 -0.11∗∗ 0.11∗∗ 0.09 0.11∗∗ CO 0.19∗ -0.18∗ 0.22∗ 0.20∗ 0.24∗ NE -0.04 0.07 -0.08 -0.10∗∗ -0.11∗∗ OP 0.01 -0.04 0.05 0.03 0.05
(K = 5). Extroversion is found to be significantly corre-lated with all the engagement dimensions as well as overall
engagement which was calculated by taking the average of the four engagement dimensions (engaged, bored, interested
and liked). Although not as large as for extroversion, we also obtained significant correlations between conscientious-ness,agreeableness andneuroticismand all the engagement dimensions. However, there was no significant correlation found foropenness.
Group Engagement. We investigated the relationship be-tween personality and engagement labels with respect to different robot personalities in Figure 7. Figure 7-(a-b) present the personality pairs with respect to the different robot person-alities. As can be seen when the robot was extroverted, raters tended to perceive the human participants less extroverted as we obtained less number of occurrences of EX-EX (two extroverted participants) pairs as compared to IN-EX (one introverted and one extroverted participant) and IN-IN (two introverted participants) pairs. Similarly, when the robot was introverted, raters tended to perceive the participants less extroverted (see Figure 7-(b)). This might be due to the fact that when the robot behaves less energetic, participants also appear to be less energetic and more introverted. In Figure 7-(c-d), we present the engagement patterns with respect to the different robot personalities. These are (i) both participants are engaged (NEN-NEN); (ii) one of the participants is non-engaged, whereas the other is engaged (NEN-EN); (iii) both participants are perceived to be engaged (EN-EN). In both robot conditions, we observed less number of occurrences of non-engaged pairs and also NEN-EN was more frequent than EN-EN. This might be due to the fact that in each clip the robot asked a question to one of the participants, i.e., while
(a) (b)
(c) (d)
Fig. 7. Distribution of perceived personality and engagement pairs: (a-b) Personality pairs in theextrovertedandintrovertedrobot conditions; and (c-d) Engagement pairs in theextrovertedandintrovertedrobot conditions, respec-tively. (IN:Introverted, EX: Extroverted, NEN: Non-engaged, EN: Engaged).
one of the participants was talking and interacting with the robot, the other participant was listening to the conversation between the robot and her/his interaction partner. Therefore raters perceived one of the participants more engaged as compared to the other one.
We also computed correlations between 6 triplets of per-sonality (all extroverted including the robot, extroverted robot + two introverted participants, extroverted robot + one extro-verted and one introextro-verted participant, etc.) and 3 engagement pairs (two non-engaged participants, one non-engaged and one engaged participant, two engaged participants). We obtained a correlation of 0.16 (at a significance level of p < 0.05). We investigated the correlations regarding the different robot personalities where we obtained 0.20 (p < 0.05) and 0.17
(p < 0.5) for extroverted robot condition and introverted robot condition, respectively. These results show that, although not large, we obtained a significant relationship between personality triplets (EX-EX-EX, EX-IN-IN, EX-IN-EX, etc.) and engagement pairs (NEN-NEN, NEN-EN, EN-EN).
Labels and Features. Finally, we investigated possible re-lationships between each individual feature introduced in Section V and personality traits as well as overall engage-ment. The largest correlation values (at a significance level of p < 0.05) are presented with respect to different robot personalities (i.e., extroverted vs. introverted) in Table VI. As we can see from the table, the best correlation values were obtained between the features based on histogram of optical flow and the studied constructs (personality and engagement).
VII. EXPERIMENTS ANDRESULTS
A. Experimental Setup
Since one of our main goals is to investigate the impact of personality traits on the prediction of engagement, we first focus on the prediction of Big Five personality traits and then
present engagement classification results. We formulated the personality prediction task as a regression problem, where we aim at predicting personality labels ranging from 1 to 10. For this purpose, we applied Gaussian Process regression with an RBF kernel of the WEKA Data Mining tool [71]. We trained a separate regressor for each personality trait. We used the default parameters as we observe that the default parameters yield the best prediction performance using 10-fold cross validation. We performed the personality prediction using the two groups of features (i.e., individual and interpersonal) as well as their combinations.
We formulated automatic engagement prediction as a two-class two-classification problem. Given the labels ranging from 1 to 10, we binarised the labels with respect to the mean computed over training samples and grouped the participants into two classes, e.g., engaged vs. nonengaged. For classification, we compared two different methods. These are Support Vector Machines (SVM) with a linear kernel and Random Forests (RF) of the WEKA [71]. For SVM, we again used the default parameters as they yield the best results. For RF, setting the number of trees to twice the number features yields the best performance, which are 500 and 1000 in the prediction of individual engagement and in the prediction of group engagement, respectively.
Given the personality labels, we performed the classification of engagement by considering 7 different combinations of features: (1) Individual; (2) Interpersonal; (3) Personality; (4) Individual + Interpersonal; (5) Individual + Personality; (6) Interpersonal+Personality; (7) All features. We compared the classification resultswhen manually annotated personality la-bels are usedagainstwhen automatically predicted personality labels are used. For predicting group engagement, we followed a similar procedure. More explicitly, we took into account the same feature combinations listed above. However, differently from individual-level analysis, we combined features from both participants into a single feature vector for group-level analysis.
For personality prediction and engagement classification, we evaluated performance using 10 fold cross validation strategy in a subject-independent fashion. Each time we randomly divided the samples into 10 groups of which we used 9 groups for training and then tested the trained predictors/ classifiers on the remaining group. We repeated this procedure 10 times and took the average over all iterations to calculate the mean performance.
B. Personality Regression Results
We presented the personality prediction results for each feature set, for each personality trait in Table VII. The best results were obtained using individual features as they yielded the minimum square error (MSE) and the maximum coefficient of determination (R2) value for all the personality traits. On the other hand, interpersonal features yielded poor prediction results as compared to individual features and deteriorated the prediction results when combined with individual features (see the last row in Table VII) except for theopennesstrait. Look-ing at theR2values, we noted adequate regression results with
TABLE VI
BEST CORRELATIONS(>0.14,p <0.05)BETWEEN FEATURES AND PERSONALITY LABELS AS WELL AS OVERALL ENGAGEMENT LABEL WITH RESPECT TO DIFFERENT ROBOT PERSONALITIES.
Feature Type Extroverted Robot Introverted Robot
EX AG CO NE OP EN EX AG CO NE OP EN Ind. BOW-HOG 0.14 - 0.16 0.14 0.19 0.14 0.15 0.16 0.15 0.15 0.16 0.17 BOW-HOF 0.31 0.19 0.18 0.17 0.17 0.23 0.24 0.21 0.21 0.15 0.17 0.24 J-SPEED 0.17 - - - - 0.19 - - - -MA-NH 0.15 0.15 0.15 - 0.17 0.18 - 0.19 0.15 - - -MAI-STATS - - - 0.14 - - - -Inter . RO-ROBOT - 0.15 - 0.18 0.14 - - - -ATT-R - - - 0.16 - - - - -ATT-P -0.17 - - 0.16 - - - -G-QOM - - - -0.15 0.15 - - -
-individual features for all the traits where extroversion was the easiest trait to predict (R2 = 0.18) and openness the most challenging one (R2 = 0.10). These results motivated us to perform engagement classification with the automati-cally predicted personality labels in addition to engagement classification with the manually annotated personality labels.
C. Engagement Classification Results
Individual Engagement.In Table VIII, we present the clas-sification results of individual engagement using SVM and RF. A paired t-test was conducted to test for the significant dif-ferences between the results of the different classifiers taking the RF as the base classifier. The paired t-test signifies that the same cross-validation folds are used for all the classifiers in order to obtain a matched pair of results. We observe that, in general, RF performs better than SVM in the classification of individual engagement.
Looking at the performance with manually annotated sonality labels (see the left hand side of Table VIII), per-sonality labels in conjunction with SVM performed better than both individual and interpersonal features with an F-measure of0.69. Combining personality labels with individual and interpersonal features further improved the performance from 0.67 to 0.76 in the case of individual features and from 0.52to0.68in the case of interpersonal features. How-ever, combining individual and interpersonal features without personality labels did not improve the performance as com-pared to using individual features alone (F-measure= 0.67). Combining all the features did not improve the performance with respect to combining personality and individual features either. Using RF classifier boosted the F-measure to0.81. We noted a similar trend in performance with respect to different feature sets. More explicitly, personality labels (F-measure= 0.75) alone performed better than interpersonal features (F-measure= 0.66) and slightly worse than individual features (F-measure= 0.77). In addition to combining all the features with personality labels, individual features together with personality labels yielded the best results (F-measure= 0.81).
As a next step we used the best prediction outputs of personality regression framework to detect individual engage-ment, which was achieved with individual features. Using the automatically predicted personality labels yielded an F-measure on par with using the manually annotated personality labels (see the right hand side of Table VIII). We again
obtained the best results by combining individual features with personality labels as well as combining all the features with personality labels (F-measure= 0.80).
In order to better understand the effect of similar and dissimilar personalities, we examined the classification results with the features yielding the best results (i.e, individual features + personality labels) and RF in more detail. We presented these results with respect to different personality types of the robot and the participants in Table IX, where we divided the participants into two groups: extroverted and
introverted. We achieved the best classification performance when both the participant and the robot wereextroverted (F-measure=0.92), while the worst results were obtained when all wereintroverted (F-measure=0.69).
Group Engagement. In Table X, we presented the classifi-cation results of group engagement using SVM and RF with 10-fold cross validation. Recall that, in group engagement classification, our goal is to discriminate between three classes: (i) both participants are engaged (EN-EN); (ii) only one of participants is engaged (EN-NEN); and (iii) both participants are nonengaged (NEN-NEN). However, since we have a small number of samples from NEN-NEN class, we only considered EN-EN and EN-NEN classes in group engagement classifica-tion. We also presented the results with the manually annotated personality labels due to the fact that they resulted in slightly better performance than using the automatically predicted per-sonality labels in predicting individual engagement. As seen in Table X, while we achieved the best F-measure (0.60) using only individual features in conjunction with RF, combining individual features and interpersonal features or combining individual features and personality labels also led to a similar performance.
D. Discussion
Previous methods for personality prediction significantly varied in the interaction scenarios, the databases used, the clas-sification methods applied, which did not allow us to provide a fair comparison. However, we still provided a comparison to give an insight into what features were found to be useful to predict each of the personality traits. Aran and Gatica-Perez [32] handled the prediction of extroversion trait as a regression problem. For the extroversion trait, they achieved the best results with the weighted Motion Energy Images (MEIs,M SE= 1.28,R2= 0.31). However, Visual Focus of
TABLE VII
PERSONALITY REGRESSION RESULTS USINGGAUSSIANPROCESSES IN TERMS OFMEANSQUAREERROR(MSE)ANDCOEFFICIENT OFDETERMINATION
(R2). EX: EXTROVERSION; AG: AGREEABLENESS; CO: CONSCIENTIOUSNESS; NE: NEUROTICISM; OP: OPENNESS.
EX AG CO NE OP
Feature Set MSE R2 MSE R2 MSE R2 MSE R2 MSE R2
Individual 0.47 0.18 0.48 0.15 0.49 0.15 0.55 0.15 0.30 0.10
Interpersonal 0.52 0.09 0.52 0.08 0.52 0.10 0.59 0.09 0.33 0.01 All 0.48 0.17 0.49 0.14 0.50 0.14 0.56 0.14 0.30 0.10
TABLE VIII
INDIVIDUAL ENGAGEMENT CLASSIFICATION RESULTS IN TERMS OFF-MEASURE FOR DIFFERENT FEATURE COMBINATIONS. THE RESULTS ARE PRESENTED USING BOTH MANUALLY ANNOTATED PERSONALITY LABELS AND AUTOMATICALLY PREDICTED PERSONALITY LABELS. SVM: SUPPORT
VECTORMACHINES, RF: RANDOMFORESTS.
Manual. Annot. Personality Labels Auto. Pred. Personality Labels
Feature Set SVM RF SVM RF Individual 0.67 0.77• - -Interpersonal 0.52∗ 0.66•∗ - -Personality 0.69 0.75• 0.75 0.75 Individual+Interpersonal 0.67 0.78• - -Individual+Personality 0.76v 0.81• 0.64∗ 0.80•v Interpersonal+Personality 0.68 0.79• 0.70∗ 0.77• All 0.75v 0.81•v 0.64∗ 0.80•v
•,◦statistically significant improvement or degradation if comparing SVM and RF.
v,∗statistically significant improvement or degradation if comparing different features combinations.
TABLE IX
INDIVIDUAL ENGAGEMENT RESULTS WITH REGARDS TO ROBOT PERSONALITY AND PARTICIPANT’S PERSONALITY.
a a a a a a a a a a a Participant Personality Robot Personality EX IN EX 0.92 0.87 IN 0.72 0.69 TABLE X
GROUP ENGAGEMENT CLASSIFICATION RESULTS WITH THE MANUALLY ANNOTATED PERSONALITY LABELS IN TERMS OFF-MEASURE FOR
DIFFERENT FEATURE COMBINATIONS. SVM: SUPPORTVECTOR
MACHINES, RF: RANDOMFORESTS.
Feature Set SVM RF
Individual 0.45 0.60• Interpersonal 0.57 0.54 Personality 0.58 0.53 Individual & Interpersonal 0.48 0.60• Individual & Personality 0.44 0.60• Interpersonal & Personality 0.48 0.54
ALL 0.60 0.46◦
•,◦statistically significant improvement or degradation
Attention (VFOA) features resulted in worse results (M SE= 1.61, R2 = 0.13). Similarly, we took into account MEIs and VFOA in the set of individual and interpersonal features, respectively. Our regression results also bore similarities in the sense that we obtained better results with individual features (M SE = 0.47,R2 = 0.18) as compared to the interpersonal features (M SE = 0.52, R2 = 0.09) for extroversion. We observed the same phenomenon for the rest of the personality traits.
On the other hand, Staiano et al. [31] found that social attention features worked better for predicting extroversion.
Rahbar et al. [37] also achieved the best results by com-bining individual and interpersonal features. In contrast, our results showed that individual features always worked better than interpersonal features as well as their combination (see Table VII). This might be due to the fact that, by definition, personality refers to individual differences in patterns of behaving. The judges might have assessed target participants by detaching them from the group without utilising their social communication cues. Table VI supported this assumption as we obtained more significant correlations between individual features and personality traits both in quantity and in absolute values.
For the classification of individual engagement, individual features again provided better performance as compared to interpersonal features in conjunction with both SVM and RF. For example, looking at the results using RF, while F-measure was 0.77 with individual features, it decreased to 0.66 with interpersonal features (see Table VIII). This result was not in line with our expectations as, differently from personality, we assumed that engagement was an interpersonal construct rather than an individual construct. This finding might be due to the challenges in the used clips such as occlusion, low resolution. Head pose estimation and skeleton fitting methods were unable to perform successfully in some of the frames. Interpersonal features such as relative orientation, visual focus of attention that solely rely on these erroneous estimations might deteriorate the performance. However, using personality labels remedied these errors and significantly increased the performance to0.81when the manually annotated personality labels were used, and to0.80when the automatically predicted labels were used. We showed that classification results with the automatically predicted personality labels were as good as with the manually annotated personality labels, which demonstrated that automatically predicted personality labels can be a reliable substitute for manually annotated personality labels.
We examined our individual engagement classification re-sults with respect to both different personality types of the robot and the participants (see Table IX). Unlike the previous works [12] or [13], we could not link any finding to either the similarity rule or the complementary rule. On the other hand, we found that in general it was easier to detect the engagement state of extroverted participants regardless of the robot’s personality as F-measure was found to be 0.92
and 0.87 in the case of extroverted robot and introverted
robot, respectively.Extrovertedrobot provided a slightly better test bed to discriminate between engaged and non-engaged
participants. We compared our results with [13], as they also presented their rapport classification results with respect to different virtual agents (an extroverted one and a neurotic one). They obtained slightly better classification results with the gloomy, neurotic agent (Obadiah). This shows that context created by a robot or a virtual agent has an impact on the classification performance.
For the classification of group engagement, we combined both participants’ features to predict similar and dissimilar patterns, i.e., either both were engaged or only one of them was engaged. We obtained the best results using individual features with RF, similarly to personality prediction and individual engagement classification results. Including interpersonal fea-tures or personality labels did not improve the performance further. This can be explained by the fact that we adopted a bottom-up approach to generate group engagement labels, i.e., we computed group engagement labels from individual engagement labels. Therefore combining participants’ indi-vidual features were sufficient to model group engagement. We conclude that in order to achieve better performance with the interpersonal features, one might need to ask the external observers to assess group engagement by considering the group as a whole rather than using hand-crafted labels.
VIII. CONCLUSION ANDFUTUREWORK
In this paper we aimed at examining the impact of person-ality on individual engagement as well as group engagement. We implemented automatic feature extractors and classifiers, which can be directly utilised on a robotic platform. We investigated the performance of combining personality labels with a set of individual and interpersonal features. Our results showed that, for detecting individual engagement, participants’ personalities play an important role. Using only the personality traits of a user, we were able to predict his/her engagement state to a high extent, and combining them with individual fea-tures improved the performance of the engagement classifier. We also found that it is easier to detect engagement state of
extroverted people as compared tointrovertedpeople. The proposed framework can be improved in several ways. To mitigate the effect of erroneous head pose and skeleton joint estimations, features based on Kinect v2.0 skeleton joints detection can be used to improve the results with interpersonal features as it is known that Kinect v2.0 gives reliable results due to the enhanced depth sensor with respect to Kinect v1.0 used in this work. Moreover, in this study, we exclusively focused on the recordings captured from static, third-person
perspective due to the challenges in processing ego-centric recordings, but alternatively head pose can be estimated jointly from Kinect recordings and ego-centric recordings for en-hancing the performance of interpersonal features. For group engagement, instead of asking external observers to assess the participants independently, it would be better to collect annotations for both participants together, possibly by asking the external observers to rank and compare different clips containing different participant pairs with respect to their group engagement. Furthermore, in this paper, we presented experimental results for 248 clips collected from a total of 18 participants. Although the number of clips is adequate, the limitation of the study is the small participant size, which is typical in human-robot interaction studies (e.g., [12]). As a future work, we plan to extend the personality prediction and engagement classification experiments with a dataset comprising of higher number of participants and clips.
IX. ACKNOWLEDGMENT
This work was performed within the Labex SMART project (ANR-11-LABX-65) supported by French state funds man-aged by the ANR within the Investissements d’Avenir pro-gramme under reference ANR-11-IDEX-0004-02. The work of Oya Celiktutan and Hatice Gunes is also funded by the EPSRC under its IDEAS Factory Sandpits call on Digital Personhood (Grant Ref.: EP/L00416X/1).
REFERENCES
[1] O. Celiktutan and H. Gunes, “Automatic prediction of impressions in time and across varying context: Personality, attractiveness and likeability,”IEEE Transactions on Affective Computing, vol. PP, no. 99, pp. 1–1, 2016.
[2] M. Astrid, N. C. Krämer, and J. Gratch, “How our personality shapes our interactions with virtual characters-implications for research and development,” inIntelligent virtual agents. Springer, 2010, pp. 208– 221.
[3] C. Clavel, A. Cafaro, S. Campano, and C. Pelachaud, “Fostering user engagement in face-to-face human-agent interactions: a survey,” in Toward Robotic Socially Believable Behaving Systems-Volume II. Springer, 2016, pp. 93–120.
[4] M. Schröder, E. Bevacqua, R. Cowie, F. Eyben, H. Gunes, D. Heylen, M. T. Maat, G. McKeown, S. Pammi, M. Pantic et al., “Building autonomous sensitive artificial listeners,” Affective Computing, IEEE Transactions on, vol. 3, no. 2, pp. 165–183, 2012.
[5] S. D’mello and A. Graesser, “Autotutor and affective autotutor: Learning by talking with cognitively and emotionally intelligent computers that talk back,”ACM Transactions on Interactive Intelligent Systems (TiiS), vol. 2, no. 4, p. 23, 2012.
[6] N. Glas and C. Pelachaud, “Politeness versus perceived engagement: an experimental study,” Natural Language Processing and Cognitive Science: Proceedings 2014, p. 135, 2015.
[7] P. Dybala, M. Ptaszynski, R. Rzepka, and K. Araki, “Activating humans with humor–a dialogue system that users want to interact with,”IEICE TRANSACTIONS on Information and Systems, vol. 92, no. 12, pp. 2394– 2401, 2009.
[8] D. Bohus and E. Horvitz, “Managing human-robot engagement with forecasts and... um... hesitations,” inProceedings of the 16th interna-tional conference on multimodal interaction. ACM, 2014, pp. 2–9. [9] S. Campano, C. Langlet, N. Glas, C. Clavel, and C. Pelachaud, “An
eca expressing appreciations,” in Affective Computing and Intelligent Interaction (ACII), 2015 International Conference on. IEEE, 2015, pp. 962–967.
[10] H. Hung and D. Gatica-Perez, “Estimating cohesion in small groups using audio-visual nonverbal behavior,”Multimedia, IEEE Transactions on, vol. 12, no. 6, pp. 563–575, 2010.