University of South Florida
Scholar Commons
Graduate Theses and Dissertations
Graduate School
January 2013
Modeling, Analysis and Control of Voltage-Source
Converter in Microgrids and HVDC
Ling Xu
University of South Florida, [email protected]
Follow this and additional works at:
http://scholarcommons.usf.edu/etd
Part of the
Electrical and Computer Engineering Commons
Scholar Commons Citation
Xu, Ling, "Modeling, Analysis and Control of Voltage-Source Converter in Microgrids and HVDC" (2013).Graduate Theses and Dissertations.
Modeling, Analysis and Control of Voltage-Source Converter in Microgrids and HVDC
by
Ling Xu
A dissertation submitted in partial fulfillment of the requirements for the degree of
Doctor of Philosophy
Department of Electrical Engineering College of Engineering
University of South Florida
Major Professor: Lingling Fan, Ph.D. Christos Ferekides, Ph.D.
Fangxing Li, Ph.D. Zhixin Miao, Ph.D. Lee (Elias) Stefanakos, Ph.D.
Yu Sun, Ph.D.
Date of Approval: November 12, 2013
Keywords: Impedance model, Renewable energies, Resonance, Stability, VSC
DEDICATION
ACKNOWLEDGMENTS
There are many people I would like to express my thanks to during my Ph.D. studies. It is impossible to complete this dissertation without their support.
First of all, I would like to express my sincere gratitude to my advisor Dr. Lingling Fan for her guidance, training and support. The experience as her Ph.D. student is the most important and enjoyable part during my long years’ study. The research facilities provided by the lab is an amazing treasure otherwise the dissertation is not possible to complete. She is always available to discuss the research issues and taught me how to become a researcher, which is the essential part of Ph.D. study.
Secondly, I would like to thank the rest of my committee members: Dr. Christos Ferekides, Dr. Fangxing Li, Dr. Lee (Elias) Stefanakos and Dr. Yu Sun, for their encouragement and constructive comments especially during my Ph.D. proposal. I also would like to express my sincere gratitude to Dr. Zhixin Miao for his unlimited help and guidance during my research and project work.
I owe my thanks to my colleagues from the smart grid power system lab: Yasser Wehbe, Lakanshan Prageeth Piyasinghe, Mohemmed Alhaider, Vahid Rasouli Disfani and Javad Khazaei, for the discussions, help and enjoyable atmosphere in the lab.
Last but not the least, I would like to thank my wife, Ying Liu, my parents, Qimao Xu, Huizhen Yin and my son Jason Xu for their endless love and support during my studies. Especially, I would like to thank my son’s lovely smiling face which always encourages me to move forward.
TABLE OF CONTENTS LIST OF TABLES iv LIST OF FIGURES v ABSTRACT x CHAPTER 1 INTRODUCTION 1 1.1 Background 1
1.2 Statement of the Problem 3
1.3 Approach 4
1.4 Outline of the Dissertation 5
CHAPTER 2 REVIEW OF RELEVANT LITERATURE AND RESEARCH 7
2.1 VSC Control 7
2.2 VSC Applications 8
2.2.1 Microgrid Applications 10
2.2.1.1 VSC Interfaced Battery 10
2.2.1.2 VSC Interfaced PV Station 11
2.2.1.3 Harmonics Reduction with VSC 11
2.2.2 VSC-HVDC Applications 12
2.2.2.1 LCC-HVDC vs VSC-HVDC 12
2.2.2.2 Multi-terminal VSC-HVDC 13
2.2.2.3 VSC-HVDC Modeling 14
2.3 Summary 16
CHAPTER 3 MODELING OF A MICROGRID WITH BATTERY CONNECTED 17
3.1 Introduction 17
3.2 A Microgrid With a Battery and an Induction Generator 18
3.2.1 System Topology 18
3.2.2 Battery Model 19
3.3 VSC Controls 23
3.3.1 PQ Control and dc-link Voltage Control 24
3.3.2 Voltage and Frequency Control 27
3.4 System Evaluation in PSCAD/EMTDC 28
CHAPTER 4 COORDINATED CONTROL OF A SOLAR AND BATTERY SYSTEM IN
A MICROGRID 35
4.1 Introduction 35
4.2 A Microgrid With a Battery, a PV Array and an Induction Generator 36
4.2.1 System Topology 36 4.2.2 Battery Model 38 4.2.3 PV Model 38 4.3 System Controls 40 4.3.1 Battery Control 41 4.3.2 PV Array Control 41 4.3.2.1 PQ Control 42 4.3.2.2 MPPT Control 42 4.3.2.3 Coordinated Control 43
4.4 System Evaluation in PSCAD/EMTDC 44
4.4.1 System Performance at Grid-connected Mode 44
4.4.2 System Performance at Autonomous Mode 45
4.4.2.1 Insolation Variations 46
4.4.2.2 Load Variations 47
CHAPTER 5 VSC BASED HARMONIC AND UNBALANCE MITIGATION FOR A
MI-CROGRID 49
5.1 System Configuration 50
5.1.1 Consequence of Unbalance in Motor Loads 53
5.1.2 Consequence of Unbalance in Rectifier Loads 53
5.2 Controller Design 54
5.3 Validation 58
5.3.1 Case I 60
5.3.2 Case II 61
5.3.3 Case III 64
CHAPTER 6 SYSTEM IDENTIFICATION BASED VSC-HVDC DC VOLTAGE
CON-TROLLER DESIGN 70
6.1 System Model 71
6.1.1 System Topology 71
6.1.2 Control Modes 72
6.1.2.1 Rectifier Station Control 72
6.1.2.2 Inverter Station Control 73
6.2 System Identification 74
6.3 Validation 80
CHAPTER 7 MODELING AND SIMULATION OF MULTI-TERMINAL HVDC FOR
WIND POWER DELIVERY 83
7.1 System Model 83
7.1.1 System Topology 83
7.1.2 Control Modes 84
7.1.2.2 WFVSC Control 86
7.1.3 Grid Fault Operation 87
7.2 Simulation 92
7.2.1 Normal Operation 92
7.2.2 Grid Fault Operation 92
CHAPTER 8 AC IMPEDANCE BASED RESONANCE ANALYSIS IN A VSC-HVDC
SYSTEM 94 8.1 System Model 95 8.1.1 Impedance Models 97 8.1.1.1 Rectifier Station 97 8.1.1.2 Inverter Station 100 8.1.2 Stability Analysis 103
8.2 Impacting Factors of Resonance Stability 104
8.2.1 Feed-forward Filter 105
8.2.2 ac Line Length 109
8.2.3 Power Level 114
CHAPTER 9 DC IMPEDANCE-MODEL-BASED RESONANCE ANALYSIS OF A
VSC-HVDC SYSTEM 115 9.1 Analysis 117 9.1.1 System Model 117 9.1.2 Impedance Model 118 9.1.2.1 Rectifier Station 118 9.1.2.2 Inverter Station 125 9.2 Resonance Analysis 128 9.2.1 Verification 128
9.2.2 dc Current Resonance Analysis 130
9.2.2.1 Impact of dc Capacitor 130
9.2.2.2 Impact of Power Level 136
CHAPTER 10 CONCLUSIONS AND FUTURE WORK 137
10.1 Conclusions 137
10.2 Future Work 138
REFERENCES 139
APPENDICES 148
Appendix A List of Abbreviations 149
Appendix B Reuse Permissions of Published Papers for Chapters 3, 4, 6, 7, 8 152
LIST OF TABLES
Table 2.1 Comparison of LCC-HVDC and VSC-HVDC 13
Table 3.1 Simulation system parameters 20
Table 3.2 Induction machine parameters 20
Table 3.3 PI controller parameters of Fig. 3.6 26
Table 3.4 PI controller parameters of Fig. 3.8 28
Table 4.1 Simulation system parameters 37
Table 4.2 Induction machine parameters 37
Table 4.3 Parameters of solar cell 39
Table 4.4 PI controller parameters of Fig. 4.5 42
Table 5.1 Simulation system parameters 51
Table 6.1 Electrical parameters of the VSC-HVDC system 71
Table 6.2 dc-Link voltage controller parameters 80
Table 8.1 System parameters of VSC-HVDC model 95
Table 8.2 Parameters of individual VSC 96
Table 8.3 Parameters of controllers 100
Table 9.1 System parameters of VSC-HVDC model 117
Table 9.2 Parameters of individual VSC 118
Table 9.3 Parameters of controllers 125
Table 9.4 Comparison between different capacitor sizes 132
LIST OF FIGURES
Figure 1.1 Configuration of a three-phase ac/dc converter. 2
Figure 2.1 Conventionaldq control for a VSC. 8
Figure 2.2 Configuration of Direct Power Controller. 9
Figure 2.3 Configuration of Sliding Mode Controller. 9
Figure 2.4 Impedance model of VSC and grid. 15
Figure 3.1 A microgrid with a battery system. 19
Figure 3.2 A detailed battery model. 21
Figure 3.3 The relationship between open-circuit voltage and SOC. 22
Figure 3.4 Part I: Round trip efficiency test of battery. 23
Figure 3.5 Equivalent model of a battery connected with ac sources. 24
Figure 3.6 Normal charging and PQ control strategy. 25
Figure 3.7 Upper level control considering SOC. 26
Figure 3.8 ac voltage control strategy of inverter. 27
Figure 3.9 Upper level control scheme of islanding mode. 29
Figure 3.10 Performance of the battery at PQ mode. 30
Figure 3.11 System behavior after islanding without control mode switching. 30
Figure 3.12 System behavior during islanding. 32
Figure 3.13 Performance of induction machine during islanding. 32
Figure 4.2 A solar cell model. 38
Figure 4.3 Output characteristics of PV array by varying insolation level. 40
Figure 4.4 PV array and its respective converters. 41
Figure 4.5 Duty cycle control of dc/dc converter. 43
Figure 4.6 Coordinated control strategy of PV and battery system at autonomous mode. 43
Figure 4.7 Power outputs of battery and PV at grid-connected mode. 45
Figure 4.8 System transient during islanding event. 46
Figure 4.9 System transient during insolation variations. 47
Figure 4.10 System transient during load variations. 48
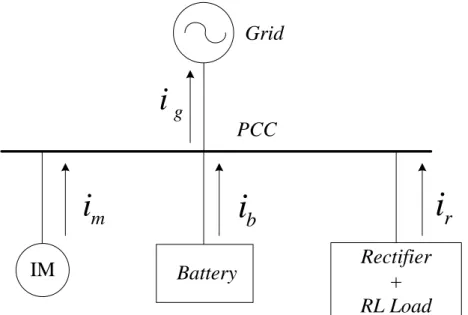
Figure 5.1 System topology of a microgrid. 51
Figure 5.2 Induction machine positive and negative sequence equivalent circuit. 52
Figure 5.3 Induction machine current under 2% unbalanced grid voltage. 53
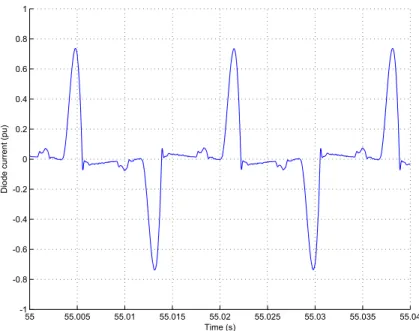
Figure 5.4 Rectifier current under 2% unbalanced grid voltage. 54
Figure 5.5 Grid current under 2% unbalanced grid voltage. 55
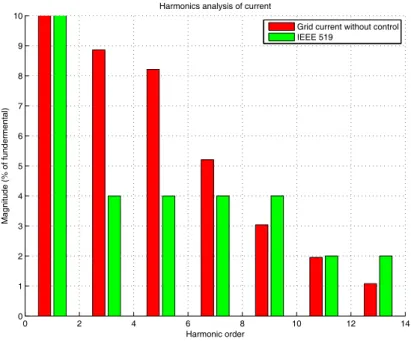
Figure 5.6 FFT analysis of grid current under 2% unbalanced grid voltage. 55
Figure 5.7 Simplified system topology. 56
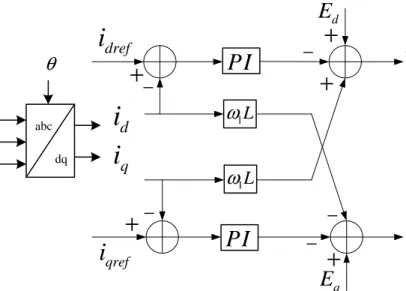
Figure 5.8 Conventional dq control strategy for VSC. 57
Figure 5.9 A PR controller structure. 58
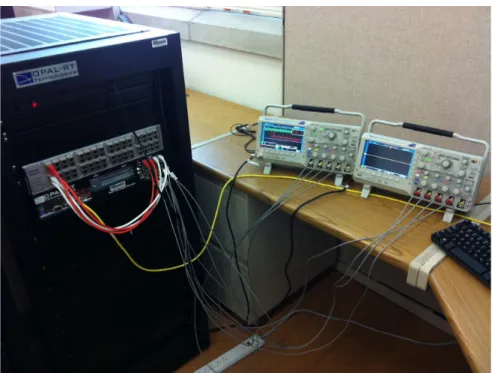
Figure 5.10 Real-time digital simulation setup using RT-LAB. 59
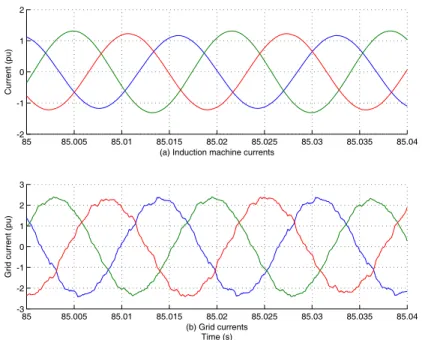
Figure 5.11 Induction machine and grid currents under 0.5% unbalanced grid voltage. 60
Figure 5.12 Rectifier current under 0.5% unbalanced grid voltage. 61
Figure 5.13 Battery inverter currents in stationary frame. 62
Figure 5.14 Grid current under 0.5% unbalanced grid voltage. 62
Figure 5.15 FFT analysis of grid current under 0.5% unbalanced grid voltage. 63
Figure 5.16 Induction machine and grid currents under 2% unbalanced grid voltage. 63
Figure 5.18 Grid current under 2% unbalanced grid voltage. 65
Figure 5.19 FFT analysis of grid current under 2% unbalanced grid voltage. 65
Figure 5.20 Induction machine and grid currents under 4% unbalanced grid voltage. 66
Figure 5.21 Rectifier current under 4% unbalanced grid voltage. 67
Figure 5.22 Battery inverter currents in stationary frame. 67
Figure 5.23 Grid current under 4% unbalanced grid voltage. 68
Figure 5.24 FFT analysis of grid current under 4% unbalanced grid voltage. 68
Figure 6.1 Topology of a two terminal VSC-HVDC system. 71
Figure 6.2 Equivalent model of a VSC connected with ac sources. 73
Figure 6.3 Controller of the rectifier station. 73
Figure 6.4 Detailed controller of the inverter station. 75
Figure 6.5 Active power step up and down responses. 77
Figure 6.6 Open-loop plant and corresponding feedback controller. 77
Figure 6.7 Identified dc-link models with various orders. 78
Figure 6.8 Controller characteristics plot of identified model. 79
Figure 6.9 Validations of identified model with its controller under different combinations
of parameters. 81
Figure 7.1 Topology of a multi-terminal VSC-HVDC system. 84
Figure 7.2 A DFIG wind turbine model. 85
Figure 7.3 dc-link voltage controller. 87
Figure 7.4 An approach to prevent the dc over-voltage after grid fault. 88
Figure 7.5 dc/dc converter topology and control for the battery. 88
Figure 7.6 Active power of rectifier and inverter stations. 89
Figure 7.7 dc voltage of inverter stations. 89
Figure 7.11 Active power of rectifier and inverter stations during ac fault. 91
Figure 8.1 A two-terminal VSC-HVDC system. 96
Figure 8.2 Circuit model of a VSC and ac grid. 96
Figure 8.3 Controller of the rectifier station. 97
Figure 8.4 Controller of the inverter station. 100
Figure 8.5 Small-signal representation of a converter-grid system. 103
Figure 8.6 Real part of the total impedance (left-hand side grid impedance plus converter
impedance) at rectifier side. 106
Figure 8.7 Real part of the total impedance (right-hand side grid impedance plus converter
impedance) at inverter side. 107
Figure 8.8 Rectifier side d-axis current with different filters. 108
Figure 8.9 Rectifier side d-axis PCC voltage with different filters. 108
Figure 8.10 Rectifier side active power with different filters. 109
Figure 8.11 Inverter side d-axis current with different filters. 110
Figure 8.12 Inverter side d-axis PCC voltage with different filters. 110
Figure 8.13 Inverter side power with different filters. 111
Figure 8.14 Nyquist curves for the eigenvalues of Y Zg (rectifier ac system) for various line
inductance. 111
Figure 8.15 Simulation results ofid andiq. Lg = 0.05H. 112
Figure 8.16 Nyquist curves for the eigenvalues of Y Zg (rectifier ac system) for two power
levels. 112
Figure 8.17 d-axis current with different power level. 113
Figure 8.18 Active power with different power level. 113
Figure 9.1 A model of VSC and grid. 118
Figure 9.2 Controller of the rectifier station. 119
Figure 9.3 Bode plots of dc impedance model of rectifier station with different Z(s). 126
Figure 9.4 Detailed bode plots of dc impedance model of rectifier station. 126
Figure 9.6 Rectifier station verification setup. 128
Figure 9.7 Inverter station verification setup. 129
Figure 9.8 Bode plot of dc impedance of rectifier station. 130
Figure 9.9 Bode plot of dc impedance of inverter station. 131
Figure 9.10 Nyquist plots ofYrecZinv. 132
Figure 9.11 Simulation results of 900µF capacitor. 132
Figure 9.12 Simulation results of 1800µF capacitor. 133
Figure 9.13 Simulation results of 3600µF capacitor. 133
Figure 9.14 Nyquist plots of dc current characteristics at different power levels. 134
Figure 9.15 Simulation results of 1800µF capacitor at 200 MW. 134
ABSTRACT
The objective of this dissertation is to carry out dynamic modeling, analysis and control for Voltage-Source Converters (VSC). Two major applications of VSC will be investigated in this dissertation: microgrid application and High Voltage Direct Current (HVDC) application.
In microgrid applications, VSC is used to integrate distributed energy sources such as battery and provide system functions: such as real and reactive power regulation, voltage and frequency support during islanding condition, and abnormal system condition mitigation. In HVDC applica-tions, VSC is used to interconnect dc systems with ac systems. The functions supplied by VSC are similar to that in microgrids. However, the transfer capability and stability in such kind of system are of major interests.
Therefore, Part I of this dissertation focuses on VSC’s applications in microgrids. A battery’s inverter can be operated in both grid-connected PQ regulation mode and voltage and frequency support mode during islanding condition. Transition scheme between these two control modes is firstly investigated to guarantee a smooth dynamic performance. Secondly, a coordinated control strategy between battery’s and PV station’s VSCs is developed to improve microgrid’s power flow. Thirdly, power quality improvement through the battery’s inverter is investigated. VSC’s con-trol and capability for microgrid operation at normal, transient, and abnormal conditions will be modeled and analyzed.
Part II of this dissertation focuses on VSC’s applications in HVDC. The following topics are in-vestigated in this dissertation: (i) how to design VSC-HVDC’s controller using system identification method? (ii) How to coordinate VSCs in multi-terminal HVDC scenarios? And (iii) how to deter-mine VSC-HVDC system’s transfer capability based on stability limits? High-fidelity simulation technology is employed to tackle control validation while frequency domain impedance modeling technique is employed to develop analytical models for the systems. With linear system analysis
tools such as Nyquist plots and Bode plots, stability limits and impacting factors of VSC-HVDC systems can be identified.
This dissertation led to four journal papers (two accepted, one request of revision, one to sub-mit) and five conference papers. The major contributions of this dissertation include: 1) Developed VSC and microgrid models in high-fidelity simulation environment. Developed and validated VSC control schemes for variety of microgrid operations: normal, abnormal, and transient. The de-veloped technologies can facilitate a battery to make up solar power, improve system dynamic performance during transients, and improve power quality. 2) Developed VSC-HVDC simulation models, including two-terminal HVDC and multi-terminal HVDC. Developed VSC-HVDC control schemes for two-terminal and multi-terminal systems. Developed analytical impedance models for VSC-HVDC systems and successfully carried out stability limit identification.
CHAPTER 1 INTRODUCTION
1.1 Background
Due to the development in power electronics industry, the capacity and switching speed of Insulated-Gate Bipolar Transistors (IGBTs) have been improved. IGBTs now meet the require-ments of high power industry. The switching of IGBTs is controlled by gate voltage, and does not require external circuit to turn off. This advantage makes the IGBTs a suitable choice to regulate ac and dc networks without any complicated turn-off control circuit like the thyristors. Since the dc voltage of IGBTs is controllable via proper switching on gate, and a capacitor is usually parallel connected at the dc side which makes the dc voltage stable, the converter consists of IGBTs is normally known as Voltage-Source Converters(VSC).
The VSC discussed in this dissertation normally consists of six IGBTs, which form a three-phase ac to dc converter. Fig. 1.1 presents a common three-three-phase ac/dc converter using IGBTs. Since each IGBT has a reverse parallel diode, the current has the capability to flow back and forth between ac and dc side. Therefore, the VSC could either operate as a rectifier or an inverter without any topology change. Proper control algorithms are needed to be designed to make it possible.
Renewable energies such as wind, solar and fuel cell require advanced integration technologies. Unlike traditional energy resources such as gas, coal and oil, the output of renewable energies depends on various factors including wind speed, sunlight irradiance and temperature. Hence, power generated from renewable energies is not constant and varies from time to time, which is a big challenge from a power system operator’s view. Moreover, the output of solar and fuel cell energies are normally dc power, which is not compatible with an ac power system. However, thanks to the development of power electronics technology, it is now a preferred solution to utilize VSC to
dc
V
C
ai
bi
ci
+
−
Figure 1.1. Configuration of a three-phase ac/dc converter.
integrate those renewable energies into power system. Due to high freedom control capabilities of VSC, wind, solar and fuel cell energies could be integrated into power system via proper back to back, or dc/ac converters.
In order to coordinate with time variant renewable energies and make power supply reliable, energy storage devices need to be installed along with renewable energies. Traditional energy storage technology including water pumping which requires high investment and is limited by geographic conditions. Battery and super capacitor are two growing solutions to store energy for power grids. Both need VSC to interface with power system. Since the output of a battery and a super capacitor are both dc power, a dc/ac inverter is required to connect them with ac grids.
Another benefit from VSC is the passive network supply capability, which is critical for microgrid applications. Microgrid is usually supplied by several distributed generations whose power capacity is relative low. A tie between a microgrid and the main ac grid is the major support for voltage and frequency. In case the tie is cut off due to any severe fault, the microgrid may loss voltage and frequency stability. However, if the VSC has proper controller designed, it will be able to switch from power control to voltage and frequency control. The microgrid can still operate stably.
The full controllability of VSC is also valuable for long distance high power transmission. For the integration of offshore wind farms, the loss on ac transmission is very high and the onshore terminal voltage may drop dramatically, which makes the integration with grid impossible. The
the power transmission from wind farm and compensate reactive power, which secures the power system.
The dissertation will focus on the various applications of VSC on renewable energies, en-ergy storage and power transmissions. The proper control algorithms for each application will
be analyzed and designed. Computer simulations conducting in PSCAD/EMTDC and
MAT-LAB/SimPowerSystems will be implemented and verify the proposed controllers.
In order to identify power transfer capability, detailed analysis including impedance modeling of VSC will be conducted and the stability and resonance issues will be addressed.
1.2 Statement of the Problem
The dissertation focuses on the applications of VSC for renewable energies including microgrid and VSC-HVDC. The following challenges are studied.
First, renewable energies such as wind, solar can be integrated into the system via VSC, which can also form a microgrid. Due to the intermittence of renewable energies, a storage device like battery has to be installed to improve the microgrid operation. The respective control strategy is designed. Additionally, a control algorithm is needed to optimally coordinate the battery and renewable energy in order to improve the reliability of microgrid. The islanding operation mode of microgrid is also studied.
Second, the power quality of microgrid is a critical issue for the customers since the system usually has unbalanced load and uncontrolled power electronics devices. To improve the power quality such as mitigate the negative sequence and low order harmonic currents with lowest cost is an urgent need of the customer and utilities companies.
Third, another application of VSC, VSC-HVDC, is more complicated and more critical for grid security since it is dealing with high voltage system. The controller design and parameters tuning is complicated and time consuming. Finding an efficient approach to determine the controller parameters with desired system performance is valuable for the system designer.
Fourth, offshore wind farms integration is a big challenge for the utility. Multi-terminal VSC-HVDC topology is a suitable solution, however, the power flow between each station and the fault ride through capability have to be addressed.
Fifth, the inherent cause of stability and resonance issues of VSC-HVDC is a key point which can help engineers understand the inside of the system. Since the system is hybrid which includes both ac and dc part, the analysis has to be take both side into account.
1.3 Approach
The controller design and analysis of system needs the application of control theory. The
models designed within this dissertation are built in details which means the dynamics of the power electronics devices are included.
Two time-domain Electro-Magnetic Transients programs are adopted to build and verify the
models, which are PSCAD/EMTDC and MATLAB/SimPowerSystem. Both tools are able to
simulate the transients of power electronics devices during switching so the model is more accurate and more closer to the actual system than average models. PSCAD/EMTDC is a standard tool in power engineering industry and is widely used in utility companies and academia. The results tested with this tool is widely accepted and can be considered consistent with the real system. MATLAB/SimPowerSystem not only has detailed power electronics models but also has more specific toolboxes for controller design, such as the system identification toolbox. The controller design with MATLAB environment is friendly and is more powerful. Therefore, the combination of those two tools can facilitate the research in this dissertation.
Depending on the system complexity, the simulations conducted in PSCAD/EMTDC and MAT-LAB/SimPowerSystem can take very long time and sometimes may exceed the system capability due to the limit of memory. A Real-Time Digital Simulator (RT-LAB) is used to overcome the limitations. RT-LAB is a powerful super computer with fast processors and large memories, so it can handle very large power system and detailed power electronics models. FPGA is utilized in the system to manage the I/O between RT-LAB and other equipments, so that the simulation can
run in real-time. This feature is very favorable for large system simulation such as the studies in this dissertation.
1.4 Outline of the Dissertation
The structure of the dissertation is organized as follows.
Chapter 1 gives a brief introduction of the research issues including background information, statement of problem, and approach adopted in this dissertation.
Chapter 2 presents a detailed literature survey on the applications of VSC in renewable energies integration, which includes microgrid and VSC-HVDC. The various controllers for VSC are intro-duced, and the technical challenges in microgrid and VSC-HVDC’s applications are also presented. The dissertation can be divided into two parts. Chapter 3 to 5 is the first part which investigates the applications in microgrid.
Chapter 3 develops a control strategies for a battery system to improve operation of a microgrid. The control strategies will not only provide system requirements but also take safe operation of a battery into consideration. A comprehensive model for a microgrid without synchronous generators, with a battery system, an induction machine and passive loads will be built in PSCAD/EMTDC. Control strategies will be developed and verified through simulation studies.
Chapter 4 studies the control strategies for a microgrid with both a battery group and a PV array. The study approach is detailed model based simulation. The focus of this chapter is control strategies at the autonomous mode. In this chapter, the research is expanded to include a PV array in the microgrid. Coordination among different DERs will be taken into consideration.
Chapter 5 develops a control strategy for the inverter of a battery to compensate unbalanced and harmonic currents under various grid voltage conditions for a microgrid. A PR controller and HC controllers for specific order of harmonic currents are designed and tested under different cases, in which the grid voltage has different level of unbalanced component. The case studied in RT-LAB shows the battery inverter can successfully compensate unbalanced and odd harmonic currents when the grid voltage has 0.5% and 2% negative sequence component.
The second part of this dissertation is Chapter 6 to 9, which presents the research in HVDC’s applications.
Chapter 6 proposes to use MATLAB system identification toolbox to identify the open-loop
system model for dc-link voltage control design for VSC-HVDC system. Thed-axis current reference
is treated as the input while the dc-link voltage is treated as the output. With the simplified linear model determined from the toolbox, a dc-link voltage controller’s parameters can be determined accurately. Simulation results indicate that the identified model is accurate and the controller could meet the performance requirements.
Chapter 7 investigates the modeling and simulation of a four terminal VSC-HVDC system under both normal and fault scenarios. The Multi-terminal HVDC (MHVDC) system includes two DFIG wind farms. The control strategies of both wind farm side converter (WFVSC) and grid side converter (GSVSC) are described. Simulations of the system are carried out in a Real-Time digital simulator RT-LAB. The system response under grid side ground fault is also studied, and an approach to mitigate the over-voltage during fault is proposed and tested.
Chapter 8 investigates the resonance stability of VSC-HVDC system at ac side (the rectifier side ac grid and the inverter side ac grid). Typical VSC-HVDC is adopted and impedance models of the systems is developed with the inner and outer converter control loops included. Nyquist stability criterion and impedance frequency responses is then be applied to detect resonances. Impacting factors on stability such as feed-forward filter structure, line length and power transfer levels are identified.
Chapter 9 investigates the dc resonance issues for a two-terminal VSC-HVDC system. Typical VSC-HVDC controls and a practical dc transmission line is adopted. Frequency domain analysis is applied to examine the characteristics of the derived dc impedance models. The models are verified by comparing with the frequency responses obtained from detailed VSC-HVDC system simulations in a real-time digital simulator. Real-time digital simulations are also used to validate the dc resonance analysis on the impact of dc capacitor and power transfer levels.
sugges-CHAPTER 2
REVIEW OF RELEVANT LITERATURE AND RESEARCH
2.1 VSC Control
The VSC controls have been extensively studied in the literature, the most popular and mature
control methodology is call nested loop dq current control [1, 2]. There are some other control
schemes including Direct Power Control [3] and Sliding Mode Control [4]. The various control algorithms will be described briefly as follows:
1. ConventionaldqControl. The classical control algorithm for VSC is based on the nested loop
dq control scheme, which normally includes a outer control loop, either power control or dc
voltage control, and an inner current control loop [1]. Fig. 2.1 demonstrates the conventional
dqcontrol algorithm. In which, the outer loop controls the active power and ac voltage while
the inner loop controls the dq currents. A frame of reference transformation is required for
this control. The ac voltages and currents are first transformed into dq quantities via Park’s
transformation, and the outer control loop generates the respective dq current references
depending on the control objectives. The inner current control loop regulates thedqcurrents
and generate the appropriate switching pulses for converters.
2. Direct Power Control. The Direct Power Control(DPC) eliminates the current control loop and regulates the active and reactive power directly [3, 5, 6, 7, 8]. Fig. 2.2 depicts the configuration of a Direct Power Controller, where the active power command is provided by a dc-bus voltage control block and the reactive power command is directly given. The errors between commands and feedback powers are input to the hysteresis comparators and
digitized to the signals Sp and Sq. The phase of the power source voltage is also digitized
3/2 3/2 PWM Voltage angle calculation 2/3 PI , , a b c
v
, , a b ci
,v
α β ,i
α β eθ
dv
+ * 1 dv
* 1 qv
* 1v
α * 1v
β * 1, 1, 1 a b cv
dv
′
qv
′
* di
* qi
di
qi
R L C L ω − + + PI − − + − + − L ω e je
−θ e je
−θ e je
−θ PI * acV
+ − acV
refP
÷
dv
Figure 2.1. Conventionaldq control for a VSC.
switching signals to converters. The advantage of DPC is its simple structure and direct control capability of powers. The controller is easy to be implemented.
3. Sliding Mode Control. Comparing to conventionalP Icontrol, the Sliding Mode Control(SMC)
does not need an accurate mathematical model of the objective to be controlled, but offers better stability regardless the plant parameters and load variations [9, 10, 4, 11]. Fig. 2.3 demonstrates a Sliding Mode Controller for a boost inverter. The SMC first needs to select
appropriate state variables, and the input currentiL1 and output voltage V1 are selected. 1
and 2 are the state variable errors ofiL1 and V1, which forms a sliding surface equation
S(iL1, V1) =K1ε1+K2ε2 = 0 (2.1)
The value is input to a hysteresis block H1 and generate the switching signals S1 and S2.
2.2 VSC Applications
Figure 2.2. Configuration of Direct Power Controller [3].
2.2.1 Microgrid Applications 2.2.1.1 VSC Interfaced Battery
Microgrid is an important technology to integrate distributed energy resources, including wind turbines, solar photovoltaic panels and energy storage devices such as battery [12, 13, 14, 15, 16]. A microgrid can either operate at the grid connected or autonomous modes [17, 18].
At autonomous modes, voltage and frequency should be supported by a microgrid itself, usually
through synchronous generators. For a microgrid without synchronous generators, the system
voltage and frequency would be difficult to maintain without the support of the ac grid. One solution is to use a VSC controlled by a pulse width modulation (PWM) scheme to provide voltage and frequency control [19]. A battery is interconnected to a grid through a VSC and hence batteries can improve the operation of microgrids through VSC control. In [19, 20, 21], battery systems are applied to restore system voltage and frequency quickly (several cycles). In practice, applications of battery storage system for grid frequency regulation have been deployed in [22], the maximum capacity has reached 20MW.
For microgrids operating at grid-connected modes, VSCs of battery systems can work at power control mode. Depending on the state of charge (SOC) of battery and active power requirement by the microgrid, a battery may operate at either charging or discharging condition. The VSC connected between the battery and the microgrid regulates power flow only and does not participate in system frequency control. In [23] and [24], applications of battery energy storage systems in grid power balance at grid-connected modes are demonstrated.
Research work has been conducted on development of control strategies for batteries in micro-grids [17, 18, 19]. An ideal dc voltage source is assumed for a battery. In reality, a battery has operation limits. For example, the SOC cannot be lower than a threshold; the Depth of Discharge (DOD) may affect the life time of a battery [22]. Therefore, there is a need to model a battery adequately and develop control strategies based on the adequate battery model with battery status information collected.
Detailed battery models have been developed in the literature. In [25], a battery model is described by partial differential equations. [13] adopted the same model to simulate a wind farm with a Lead-acid battery system. From [22], a Li-ion battery has been a suitable choice for high power application due to breakthroughs on materials. Reference [26] describes a detailed Li-ion battery model with parameters and has verified the validity through experiments. Though the battery studied in [26] is for a low voltage level, serial and parallel connections could make a high voltage and high power battery matrix possible, which could be used in power system [27].
2.2.1.2 VSC Interfaced PV Station
PV model has been investigated thoroughly in the literature. The current source and anti-parallel diode model has been proved to be able to simulate the V-I characteristics of a solar cell accurately. For the PV and battery combined systems, [28] proposed a power management mechanism that could optimize the power flow. [29] utilizes batteries to reduce the fluctuations of PV output. [30] presents the power scheduling within PV and battery system from the power system’s point of view. Besides the PV and battery combined system, PV and capacitor combined system is also examined by [31, 32, 33]. Capacitors are also could be used to reduce the power fluctuation of PV, or participate in frequency control.
2.2.1.3 Harmonics Reduction with VSC
Harmonic currents due to power electronics switching have been widely investigated in the literature. Active filter is a mature solution to mitigate the harmonic currents [34, 35, 36, 37]. The current control strategies are discussed and compared in [38], which include linear current
control, digital deadbeat control and hysteresis control. The linear current control utilizing dq
synchronous frame control has been proposed and tested [34, 35, 39, 40]. Another control method developed in [40, 41] is called Proportional-Resonant (PR) controller. With PR control theory, the complexity of harmonic current control system can be effectively reduced for both positive and negative sequences. Uncontrolled power electronics devices with load can produce non-negligible low orders harmonic currents to microgrid. In [42], even small percentage of grid voltage unbalance
would lead to additional high 3rd order harmonic currents from rectifiers. In order to eliminate the harmonic currents, a appropriate control strategy has to be developed.
2.2.2 VSC-HVDC Applications
2.2.2.1 LCC-HVDC vs VSC-HVDC
The first modern commercial HVDC transmission project was built between Gotland and main-land Sweden in 1954 [43]. The power capacity was 10-20 MW, and was constructed based on Thyristor-based line-commutated converters (LCC), which require external circuit to force the cur-rent to zero and turn them off. The technology is mature and widely used nowadays. LCC-HVDC is suitable for long distance bulk power transmission since the major LCC valves, thyristors, are reliable and with high power capability. The longest HVDC project reported is the Xiangjiaba-Shanghai 2,071 km (1,287 mi) 6400 MW link connecting the Xiangjiaba Dam to Xiangjiaba-Shanghai, in China [44].
The VSC-HVDC was introduced when high power IGBTs were available for use. The advantage of a VSC-HVDC comparing to LCC-HVDC include: much less harmonics thus large size filters are not required; reactive power supply capability; and multi-terminal applications. The IGBT could turn on or off depends on the voltage signal applied on the gate port, thus the PWM is utilized to control the converters. Therefore, the magnitude and phase of the output voltage are both fully controllable. Therefore, VSC could compensate reactive power to the grid, to support ac voltage stability. Due to the fully controllability of output voltage, the power flow within VSC-HVDC is fully controllable as well, which enables flexible power flows between grids. Since there is no ac voltage source required to operate like the LCC HVDC does, the VSC-HVDC could support passive network, which is ideal for remote loads and renewable energies integration. An undergoing
VSC-HVDC project is the 165 km, ±320 kV and 800 MW connection between DolWin Alpha and
D¨orpen/West in Germany [45].
Table 2.1. Comparison of LCC-HVDC and VSC-HVDC
LCC-HVDC VSC-HVDC
Converter Technology Thyristor based IGBT based
Voltage Polarity Both Does not change
Current Direction Does not change Both
Turn On Controllable Controllable
Turn Off Rely on external circuit Controllable
Power Capacity Higher Lower
ac System Requirement Strong Strong and weak
Reactive Power Requirement Yes No
Station Losses Lower Higher
Cost Lower Higher
Reliability Higher Lower
Technology More mature Less mature
2.2.2.2 Multi-terminal VSC-HVDC
One of the advantages of VSC-HVDC transmission is the multi-terminal topology, which is easy to be implemented. This feature could benefit the grid integration of offshore wind farms, since the physical distance of each wind farm could be far and the grid integration station may have only few choices. The multi-terminal VSC-HVDC system could integrate several wind farms to one or multiple grid side converter stations, which provides high flexibility for power planning and construction [46, 47].
Depending on the topology of multi-terminal VSC-HVDC, the control objective of each con-verter station varies. When the multi-terminal VSC-HVDC is used to integrate offshore wind farms to grid, the rectifier stations usually operates in passive network support mode, i.e., the magnitude and frequency of ac output voltage of the converters will be controlled. Regarding the inverter sta-tion that connecting to the ac grid, the major control objective is to regulate the dc voltage, which ensures the active power generated from wind farms could be delivered to the grid to maintain power balance. In the case of multiple inverter stations, power droop control strategy should be implemented to dispatch the active power to each station.
In the case of connecting between grids instead of integrating wind farms, the rectifier stations usually operate in power control mode, which regulate active and reactive power transfer. However, the inverter stations work in the same mode: dc voltage control mode.
Operation of multi-terminal VSC-HVDC (MHVDC) has appeared in the literature. E.g., [48] described the operation of a MHVDCs operation when one of the inverters is lost. The dc voltage will have a spike which can cause damage to power electronic devices. Fast blocking rectifiers and following up with a power balancing scheme among the rest of the converters will solve the problem. MHVDC has also been proposed to deliver wind power. In [49], a multi-terminal VSC-HVDC system is proposed to integrate synchronous generator based offshore wind farms. The generator side converter control keeps the ac voltage constant and regulates the dc current based on wind speed. In [50], a four terminal MHVDC with two rectifier converters and two inverters is modeled in MATLAB/SimPowersystems. The control modes of the converters are described and tested for wind speed change in the paper. [51] presents two three-terminal MHVDC topology, control and normal system operation. System responses under fault scenarios have not been investigated.
2.2.2.3 VSC-HVDC Modeling
Several methods to derive the VSC model have been developed including averaging circuit analysis, small signal analysis and computer aid system identification. [52, 53, 54, 55] derived the VSC models based on averaging methods. The nonlinear IGBT switches are modeled as averaged
voltage source, which are applied in the KV L andKCL equations while plugging in other system
parameters. [56, 57] obtained the VSC-HVDC model via small signal analysis. A set of linearized fundamental converter equations was developed and combined with other system components, an eigenvalue analysis was conducted to determine the stability limitations. [58] obtained a trans-fer function representation of a fuel cell with its converter. The authors applied a step change on load and recorded the response on output voltage of fuel cell. The results were imported to MATLAB/Simulink System Identification Toolbox and a transfer function between load current and fuel cell voltage was estimated via various estimation algorithms. [59, 60, 61] proposed similar
ac V ( ) g Z s ( ) i Z s + -c
i
Converter model Grid model
Figure 2.4. Impedance model of VSC and grid.
In order to study the stability issues of VSC, [62] developed an impedance model of VSC between wind turbines and the grid, which also included the detail modeling of Phase Lock Loop (PLL). An active damping controller was proposed to eliminate the resonance at 3rd and 4th harmonics. The approach Sun used [62] was to derive an impedance model of VSC with its respectively controller,
which is called Zp(s) and Zn(s) corresponding to the positive and negative components. The grid
is represented by a combination of voltage source and impedance called Zg(s). Fig. 2.4 shows the
impedance model representation of VSC and grid. Nyquist criterion was applied to examine the stability of system based on Zg(s)
Zi(s). [63] applied the similar technique to derive an impedance model
and analyzed the stability issues.
Instead of using PLL, [64] proposed a power synchronization control to replace PLL, which avoids the instability caused by PLL especially in weak ac system condition. [65] investigated the models of VSC-HVDC connecting two very weak ac systems in detail. The model obtained which is called Jacobian transfer matrix has a Right-Half-Plane (RHP) zero that moves closer to the origin with larger load angles. Consequently, stability analysis was performed with the obtained model, and concluded that the RHP zero limits the bandwidth of VSC, which implies the converter stations shall not operate with too large load angles, and a higher dc capacitance is necessary to keep the dc voltage stable.
2.3 Summary
The dissertation has an opportunity to conduct research on the following issues since they have not been investigated in the literature.
1. Battery inverter control during microgrid transients
2. How to use battery inverter for power quality improvement in microgrids at distribution level 3. Comprehensive modeling of entire VSC-HVDC system (ac + dc modeling) to identify stability
CHAPTER 3
MODELING OF A MICROGRID WITH BATTERY CONNECTED
3.1 Introduction
In this chapter, the modeling of a microgrid with battery connected will be introduced [66].1
Microgrid is an important technology to integrate distributed energy resources, including wind turbines, solar photovoltaic panels and energy storage devices such as battery [12, 13, 14, 15, 16]. A microgrid can either operate at the grid connected or autonomous modes [17, 18].
At autonomous modes, voltage and frequency should be supported by a microgrid itself, usually
through synchronous generators. For a microgrid without synchronous generators, the system
voltage and frequency would be difficult to maintain without the support of the ac grid. One solution is to use a VSC controlled by a PWM scheme to provide voltage and frequency control [19]. A battery is interconnected to a grid through a VSC and hence batteries can improve the operation of microgrids through VSC control. In [19, 20, 21], battery systems are applied to restore system voltage and frequency quickly (several cycles). In practice, applications of battery storage system for grid frequency regulation have been deployed in [22], the maximum capacity has reached 20MW.
For microgrids operating at grid-connected modes, VSCs of battery systems can work at power control mode. Depending on the SOC of battery and active power requirement by the microgrid, a battery may operate at either charging or discharging condition. The VSC connected between the battery and the microgrid regulates power flow only and does not participate in system frequency control. In [23] and [24], applications of battery energy storage systems in grid power balance at grid-connected modes are demonstrated.
1This chapter was published in Power and Energy Society General Meeting, 2012 IEEE, vol., no., pp.1,8, 22-26
Research work has been conducted on development of control strategies for batteries in micro-grids [17, 18, 19]. An ideal dc voltage source is assumed for a battery. In reality, a battery has operation limits. For example, the SOC cannot be lower than a threshold; the DOD may affect the life time of a battery [22]. Therefore, there is a need to model a battery adequately and develop control strategies based on the adequate battery model with battery status information collected.
Detailed battery models have been developed in the literature. In [25], a battery model is described by partial differential equations. [13] adopted the same model to simulate a wind farm with a Lead-acid battery system. From [22], a Li-ion battery has been a suitable choice for high power application due to breakthroughs on materials. Reference [26] describes a detailed Li-ion battery model with parameters and has verified the validity through experiments. Though the battery studied in [26] is for a low voltage level, serial and parallel connections could make a high voltage and high power battery matrix possible, which could be used in power system [27].
The objective of this chapter is to develop control strategies for a battery system to improve operation of a microgrid. The control strategies will not only provide system requirements but also take safe operation of a battery into consideration. A comprehensive model for a microgrid without synchronous generators, with a battery system, an induction machine and passive loads will be built in PSCAD/EMTDC. Control strategies will be developed and verified through simulation studies.
3.2 A Microgrid With a Battery and an Induction Generator
3.2.1 System Topology
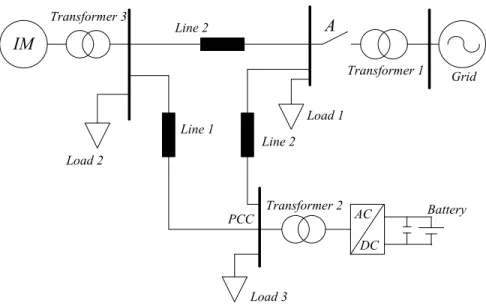
This chapter investigates a microgrid consisting of two distributed energy resources (DERs). One is an induction generator driven by a bio-diesel machine (12 MW) and the other one is a battery (2 MWh). A strong ac grid is feeding the microgrid via a 69/13.8 kV transformer.
Three passive RLC loads are put into the microgrid to simulate the customer power consump-tion. Load 1 is located at Bus A close to the grid-connected transformer. Load 2 is located at the site of a diesel engine induction generator. Load 3 is connected at the output terminal of the
Line 1 Load 1 IM Load 2 Line 2 Load 3 AC DC Grid Transformer 1 Transformer 2 A PCC Battery Line 2 Transformer 3
Figure 3.1. A microgrid with a battery system.
The study system is built in PSCAD/EMTDC. The battery system is modeled in detail. It consists of two battery groups in series, and each group has an open circuit dc voltage at 4.1kV. The peak active power output is 2MW for each group, and the capacity is 240Ahr, which implies that each battery group could inject a maximum 2 MW into the microgrid for 30 minutes.
The system parameters are listed in Table 3.1. At the grid-connected mode, the induction machine generates 8.9 MW active power, while the active power output command of the bat-tery system is 0 MW. The microgrid absorbs 0.8MW active power from the main grid. At the autonomous mode, the battery system is expected to deliver 0.8MW to the microgrid since the supply from the main grid now is lost. The adjustment of active and reactive power generation from the battery will be achieved through inverter control.
3.2.2 Battery Model
The battery model includes two parts based on [26]. One part is the energy model and the other part is the circuit model as shown in Fig. 3.2.
The resistors and capacitors in the circuit model are used to emulate the dynamic responses of a battery. The parameters of the battery model have been verified through experimental results [26]. However, the battery model of [26] has a low voltage (4.1V) and small capacity (850mAhr).
Table 3.1. Simulation system parameters
Quantity Value
ac grid voltage 69kV (L-L RMS)
Transformer 1 13.8kV/69kV, 20MVA, leakage 8%pu
Transformer 2 13.8kV/3.3kV, 10MVA, leakage 10%pu
Load 1 2.521MW+0.831MVar at 13.8kV
Load 2 4.994MW+1.029MVar at 13.8kV
Load 3 2.5MW+0.822MVar at 13.8kV
Distribution line 1 980ft, (0.044+j0.0359)ohm
Distribution line 2 1187ft, (0.052+j0.0436)ohm
Distribution line 3 1187ft, (0.052+j0.0436)ohm
Table 3.2. Induction machine parameters
Quantity Value
Rated RMS phase voltage 8kV
Rated RMS phase current 0.5kA
Base angular frequency 60Hz
Stator resistance 0.066pu
First cage resistance 0.298pu
Second cage resistance 0.018pu
Stator unsaturated leakage reactance 0.046pu
Unsaturated magnetizing reactance 3.86pu
Rotor unsaturated mutual reactance 0.122pu
Second cage unsaturated reactance 0.105pu
Polar moment of inertia 1.0s
For the battery used in the study system, we assume each battery group is constructed by 1000 individual pieces connected in series, and 70 in parallel. The voltage and current balance problems are neglected for the battery matrix. The total dc voltage from one battery group is 4.1kV and the total capacity is 240Ahr.
Fig. 3.2 shows the battery model [26].
R self _dis c h arge C capacity Ibatt Vsoc V oc( S OC) Rseries Rtrasient_s Ctrasient_s Rtrasient_l Ctrasient_l Vbatt Ibatt
Figure 3.2. A detailed battery model [26].
Equation 3.1 gives the current and voltage relationship for the battery life time model, which is the left part in Fig. 3.2.
Ccapacity dVsoc dt + Vsoc Rself discharge +Ibatt= 0 (3.1)
Normally, the self-discharge resistor is very large and could be neglected. Hence, equation (3.2) could be derived to express the relationship between the battery output current and the SOC.
Vsoc=−
1 Ccapacity
Z
Ibattdt+Vsoc(0) (3.2)
By setting the initial value ofVsoc(0) equal to 1V or 0V, the battery is initialized to fully charged
or fully discharged. And the output current of battery will then either charge or discharge the
bat-tery by varying the value ofVsoc depending on the external conditions. The full-capacity capacitor
Ccapacity is a function of the battery capacity, charging and discharging cycles, and temperature.
The expression ofCcapacity is shown in equation 3.3.
Ccapacity will decrease in a considerable long time range comparing to the simulation period in
this chapter. Therefore, Ccapacity is assumed to be constant in this chapter.
The circuit in the right part of Fig. 3.2 describes the output voltage and current characteristics
of the battery. The open circuit voltageVocis a function of SOC as follows [26]:
Voc=−1.031·e−35·Vsoc+ 3.685 + 0.2156·Vsoc
−0.1178·Vsoc2 + 0.3201·Vsoc3
(3.4)
Fig. 3.3 is the graphic representation of the relationship between the open-circuit voltage and
the SOC. It is observed that the voltage would rise at charging mode and would decrease in
discharging mode. 0 0.1 0.2 0.3 0.4 0.5 0.6 0.7 0.8 0.9 1 2.6 2.8 3 3.2 3.4 3.6 3.8 4 4.2 SOC Voltage (kV)
Figure 3.3. The relationship between open-circuit voltage and SOC [26].
η = dischargeendtime R 0 vb·ibdt chargeendtime R 0 vb·ibdt (3.5)
efficiency can be calculated by equation (3.5), wherevb andib are the voltage and current measured
at the battery dc terminal. Based on the curve in Fig. 3.4, the round trip efficiency is 98.14%.
In Fig. 3.4, the charger dc voltage is 4.1kV, the source resistant Rs is 0.2ohm. Switch S1 is kept
closed until SOC reaches 1. Once theSOC of the battery reaches 1, switch S2 will be closed, the
load resistance is 8ohm.
500 1000 1500 2000 2500 3000 3500 0 0.2 0.4 0.6 0.8 1 Time (s) (b) SOC of battery S O C 500 1000 1500 2000 2500 3000 3500 3.2 3.4 3.6 3.8 4 4.2 Time (s) (c) Terminal voltage of battery
V o lt ag e (k V ) 500 1000 1500 2000 2500 3000 3500 -1 -0.5 0 0.5 1 1.5 Time (s) (d) Battery current C u rr en t (k A )
(a) Battery system for round-trip efficiency test
Battery Rs Rload Vdc S1 S2
Figure 3.4. Part I: Round trip efficiency test of battery.
3.3 VSC Controls
Three control modes are considered for the battery: Power control, dc-link voltage control and voltage/frequency control. The former two modes can be used when the microgrid is grid-connected. The third control mode is applied when the microgrid is at its autonomous mode and there is no synchronous generator.
The control system of a VSC consists of two loops: inner current control loop and outer control loop. The outer control loop can be either active power control loop or dc-link voltage control loop when the microgrid is grid-connected. When the battery is supplying a standalone microgrid, the outer control loop will be switched to ac voltage and frequency control. The control loop diagram is presented in Fig. 3.6 and Fig. 3.8.
3.3.1 PQ Control and dc-link Voltage Control
Two charging or discharging strategies could be applied. One is constant dc-link voltage charg-ing and the other is constant power chargcharg-ing. A decoupled d-q direct current control strategy has been developed in [2, 68]. Fig. 3.5 shows an equivalent model of a VSC inverter connected with ac sources. dc a c b a1 b1 c1 a b c dc dc2
Figure 3.5. Equivalent model of a battery connected with ac sources.
Variables in the abc system in the above circuits can be transformed into a synchronous reference
frame. The voltage and current relationship is shown in (3.6) and (3.7), where ωs is the angular
frequency of ac system, vd, vq, vd1, and vq1 represent the d and q components of the point of
common coupling (PCC) voltage (Va, Vb,Vc)and VSC output voltage(Va1, Vb1, Vc1), respectively,
and idand iq represent the dand q components of the current flowing between the ac system and
the VSC. vd1 =−(Rid+L did dt ) +ωsLiq+vd (3.6) vq1 =−(Riq+L diq dt )−ωsLid (3.7)
The decoupled current control is shown in Fig. 3.6.
vdc(C dvdc dt +idc2) =vdid→ vdc dt = vdid vdcC −idc2 C (3.8)
dc voltage control is based on the balance of active power flow between the battery and the main grid as shown in (3.8). Apparently, the dc voltage can be regulated by the d axis current through a PI controller.
It is obvious from the relationship of the open-circuit voltage Voc and SOC that the dc-link
voltage tends to fall while the battery is discharging.
For constant power mode, the outer control loop will regulate the power. The only difference between a normal charging mode and a normal discharging mode is the power order is in different polarity.
In addition to the control strategy presented in Fig. 3.6, an upper level control scheme should
be included to monitor SOC and protect the batteries. Fig. 3.7 shows the upper level control
scheme, as long as the SOC is greater than minimal allowable value, the battery would continue
operating at PQ mode. Otherwise, it should be disconnected, and more active power should be delivered from the main grid in order to keep power balance.
3/2 3/2 PWM Voltage angle calculation 2/3 PI , , a b c
v
, , a b ci
,v
α β ,i
α β e θ d v + * 1 d v * 1 q v * 1 vα * 1 vβ * 1, 1, 1 a b c v d v′ q v′ * di
* qi
* dc V dc V di
q i R L C dc V L ω − + + PI − − PI + − + − + − L ω e je
−θ e je
−θ e je
−θ PI * ac V AC Voltage Magnitude Calculation + − ac V * dc P dc P PI + − * ac Q ac Q PI + −Table 3.3. PI controller parameters of Fig. 3.6
Kp Ki
P control loop 2 10
Q control loop 2 10
dc voltage control loop 1 20
ac voltage control loop 1 20
Id control loop 1.5 100 Iq control loop 1.5 100
SOC >
SOCmin
Disconnect
battery
Require more
power from
main grid
Continue at
PQ mode
End
No
Yes
3.3.2 Voltage and Frequency Control
At autonomous modes, the microgrid is disconnected from the main ac grid and there is no synchronous generator to support system voltage and frequency. One advantage of VSC is its
passive network supplying capability. In this study system, the VSC interfaced battery could
support the microgrid’s voltage and frequency by switching to ac voltage and frequency control. The basic control principles are based on decoupled current control [18, 69]. However, under steady-state and neglecting resistance R, (3.6) and (3.7) can be rewritten as (3.9) and (3.10) [20, 21]:
Vd1 =ωsLIq+Vd (3.9)
Vq1=−ωsLId (3.10)
PI controllers can be used to control the d and q axis components of the PCC voltage
respec-tively. Fig. 3.8 depicts the ac voltage control strategy. The PCC three-phase voltages are measured
and transformed into a d−q reference frame, which is vd and vq in Fig. 3.8 respectively.
Three-phase currents flowing between the loads and the inverter are measured and transformed to id and
iqrespectively. With the comparisons of thedqvoltages to their respective references, the resulting
errors are sent to the PI controllers to generate the required output voltage of the VSC.
PI
v
d_refv
dPI
0
v
q -sL
sL
i
qi
d-dq
abc
oscillator 60Hzv
abcFigure 3.8. ac voltage control strategy of inverter.
The frequency of the ac voltage which supplies passive loads is also controlled by the VSC.
Table 3.4. PI controller parameters of Fig. 3.8
Kp Ki
Vd control loop 3 2
Vq control loop 3 10
transformation and ensures the frequency of output voltage is kept at 60Hz if PWM scheme applied [70].
A similar upper level SOCmonitoring and battery protection scheme should be available when
the batteries are working at islanding control mode. Fig. 3.9 shows the upper level control strategy
at islanding modes. If theSOCis greater than the set point, the battery should operate at islanding
mode and provide active power to the microgrid. Once the SOC reaches the pre-set point, the
battery should be disconnected at the dc side to protect itself and the microgrid. The interfacing inverter can still work along with the dc link capacitor to provide a constant voltage with constant frequency. Once the battery is disconnected, there is no more active power could be injected into the microgrid. Therefore, in order to maintain stable frequency, load shedding is used to keep the active power balance.
3.4 System Evaluation in PSCAD/EMTDC
Simulation studies on the system in Fig. 3.1 are carried out in PSCAD/EMTDC. Two experi-ments are conducted to investigate not only the behaviors of batteries but also the overall system performance. The first experiment is to examine the power support capabilities of the battery with an ac grid connected. The second experiment investigates the system performance without any ac grid support. System voltage and frequency behaviors are analyzed.
One battery matrix consists of 7000 pieces of 4.1V small batteries, which form an equivalent battery of 4.1kV, 240Ah. Since the nominal voltage at ac side of inverter is 3.3kV, two battery matrixes in series are applied, which could supply 8.2kV at dc side.
SOC >
SOCmin
Disconnect
battery
Load
shedding
Continue at
islanding
mode
End
No
Yes
3.4.1 Power Support to the Microgrid from the Battery
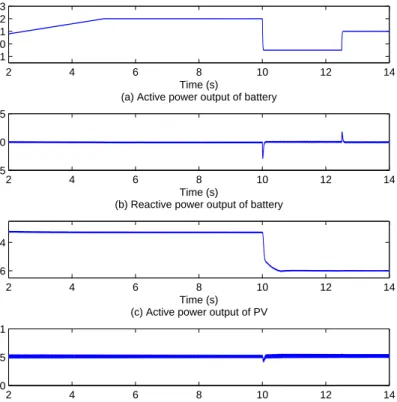
In the first experiment, the study system in Fig. 3.1 is simulated at the grid-connected mode. The active power command of the battery system is to absorb 2MW before 10s, and then to send 0.5MW after 10s. At 15s, the active power command changes to absorbing 1MW.
Fig. 3.10 shows the active and reactive power delivered from the battery. The active power output is smooth and stable. The transition is fast and smooth. The reactive power reference is kept at 0 MVar. Variation in the reactive power is shown in Fig. 3.10(b). Fig. 3.10(c) shows the dynamic response of the battery current. Fig. 3.10(d) shows that the battery voltage decreases from 10s to 15s since the battery is sending out active power, while it is rising after 15s because of charging. 10 11 12 13 14 15 16 −1 0 1 2 3 Time (s) (a) Active power output of battery
Active power (MW) 10 11 12 13 14 15 16 −0.4 −0.2 0 0.2 0.4 Time (s) (b) Reactive power output of battery
Reactive power (MVar)
10 11 12 13 14 15 16 −0.2 −0.1 0 0.1 0.2 Time (s) (c) Current of battery Current (kA) 10 11 12 13 14 15 16 4.0186 4.0188 4.019 4.0192 4.0194 Time (s) (d) Terminal voltage of battery
Currnt (kA)
Figure 3.10. Performance of the battery at PQ mode. 14.50 15 15.5 16 16.5 17 2 4 6 8 10 12 14 16 18 Time (s) (a) PCC RMS voltage Voltage (kV) 14.5 15 15.5 16 16.5 17 35 40 45 50 55 60 65 Time (s) (b) Microgrid frequency Frequency (Hz)
Figure 3.11. System behavior after islanding without control mode switching.
3.4.2 Voltage and Frequency Support to an Islanding Microgrid
When the microgrid loses its connection to an ac grid, the battery and its inverter system should switch to the ac voltage and frequency control mode as shown in Fig. 3.11. Without control mode switching, the frequency and the voltage of the microgrid will oscillate and lose stability. Fig. 3.11 illustrates the frequency and voltage responses following the grid disconnection at 15s without control scheme switch. The inverter still works at PQ control mode. The frequency and voltage oscillate dramatically and drop to a very low level. The microgrid can no longer operate.
Therefore, it is necessary for the inverter to transit to ac voltage and frequency control mode after an islanding event. Furthermore, since the battery is not an ideal dc voltage, the upper level control scheme in Fig. 3.9 should also be implemented.
3.4.2.1 During Islanding Transient Response
At 14.97s, the ac grid is disconnected by a switch to emulate the beginning of an islanding event of the microgrid. The islanding event is detected after 30ms, the required detection time is selected based on [71, 72], in which the range of detection time is from 20ms to 40ms. Subsequently the control system of inverter transits to ac voltage and frequency control mode at 15s.
Fig. 3.12(a) shows the PCC RMS voltage during the islanding process. Significant voltage sag occurs when the main grid is disconnected. However, after the control scheme transits to islanding mode, the voltage returns to the nominal value. Fig. 3.12(b) shows the frequency response at PCC. Similar to the PCC voltage, a deviation is followed by the disconnection of main grid. However, the frequency returns to 60Hz as desired after the islanding control mode triggered. The maximum frequency deviation is less than 1Hz.
These dynamic responses confirm the ac voltage and frequency support capabilities introduced by the inverter and battery. Fig. 3.12(c) shows that the terminal voltage of one battery group is dropping since it is responsible for the active power support after islanding. The battery current is shown in Fig. 3.12(d). The system frequency is fully controlled by the battery. Fast current
regulation is expected as Fig. 3.12(d) shows. Meanwhile, theSOCkeeps dropping since the battery
Figure 3.12. System behavior during island-ing.
Figure 3.13. Performance of induction ma-chine during islanding.
Fig. 3.13 shows the dynamic responses of the induction machine during islanding. Oscillations occurred both on induction machine speed and torque. However, with the help of the battery system, they return to pre-fault value and remain stable.
49.5 50 50.5 51 51.5 52 52.5 53 53.5 54 54.5 55 −1.5
−1 −0.5
Time (s)
(a) Active power of battery with an increase in loads
Active power (MW) 49.5 50 50.5 51 51.5 52 52.5 53 53.5 54 54.5 55 59.92 59.94 59.96 59.9860 60.02 Time (s)
(b) Microgrid frequency with an increase in loads
Frequency (Hz) 49.5 50 50.5 51 51.5 52 52.5 53 53.5 54 54.5 55 0.89998 0.899985 0.89999 Time (s)
(c) SOC of a battery group with an increase in loads
SOC 69.5 70 70.5 71 71.5 72 72.5 73 73.5 74 74.5 75 −2 −1 0 1 Time (s)
(d) Active power of battery with load shedding
Active power (MW) 69.5 70 70.5 71 71.5 72 72.5 73 73.5 74 74.5 75 60 60.05 60.1 Time (s) (e) Microgrid freqency with load sheddin
Frequency (Hz) 69.5 70 70.5 71 71.5 72 72.5 73 73.5 74 74.5 75 0.899965 0.899966 0.899967 Time (s)
(f) SOC of a battery group with load shedding
SOC
Figure 3.14. Performance of the microgrid with load changing after islanding.
50 51 52 53 54 55 56 57 58 59 60 1.011 1.012 1.013 1.014 Time (s)
(a) Induction machine speed with an increase in load
Speed (pu) 50 51 52 53 54 55 56 57 58 59 60 0.772 0.774 0.776 0.778 0.78 0.782 Time (s)
(b) Induction machine torque with an increase in load
Torque (pu) 70 71 72 73 74 75 76 77 78 1.01 1.012 1.014 1.016 Time (s)
(c) Induction machine speed with load shedding
Speed (pu) 70 71 72 73 74 75 76 77 78 0.76 0.77 0.78 0.79 Time (s)
(d) Induction machine torque with load shedding
Torque (pu)
Figure 3.15. Performance of the IM with load changing after islanding.
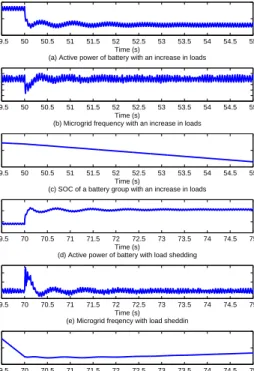
3.4.2.2 Increase and Decrease in Loads
In order to validate the voltage and frequency regulation capabilities of the inverter and batteries after an islanding event, two load change scenarios are implemented.
At 30s, one load at the rating of 0.5MW and 0.164MVar is switched on. Fig. 3.14 shows the responses of battery output power and the microgrid frequency. The active power output of the battery increases 0.5MW instantaneously while there are transients in frequency. The microgrid frequency has a transient decrease (0.04 Hz) due to the increase of loads.
Load shedding is applied to evaluate the control system, which is shown in Fig. 3.14(d) and (e). At 40s, one load at the rating of 1.292MW and 0.356MVar is switched off, which simulates a load shedding. The batteries switch from a discharging state to a charging state. The frequency has a transient increase (0.12 Hz maximum) due to load shedding.
An induction generator driven by a bio-diesel machine is included in the microgrid. Fig. 3.15 demonstrates the performance of induction machine in the autonomous microgrid. A damped oscillation is occurred both on induction machine speed and torque. However, with the help of the battery system, they return to pre-fault value and remain stable. From Fig. 3.15, it is clear that the battery system could take the responsibility to regulate the power balance without adjustment on induction machine.
CHAPTER 4
COORDINATED CONTROL OF A SOLAR AND BATTERY SYSTEM IN A MICROGRID
4.1 Introduction
The objective of this chapter1 is to study the control strategies for a microgrid with both a
battery group and a PV array [73]. The study approach is detailed model based simulation. Detailed battery models have been described in Chapter 3. PV model has been investigated thoroughly in the literature. The current source and anti-parallel diode model has been proved to be able to simulate the V-I characteristics of a solar cell accurately. For the PV and battery combined systems, [28] proposed a power management mechanism that could optimize the power flow. [29] utilizes batteries to reduce the fluctuations of PV output. [30] presents the power scheduling within PV and battery system from the power system’s point of view. Besides the PV and battery combined system, PV and capacitor combined system is also examined by [31, 32, 33]. Capacitors are also could be used to reduce the power fluctuation of PV, or participate in frequency control.
The above mentioned research work have focus on the grid-connected mode operation. The