Revista de Sistemas de Informação da Faculdade Salesiana Maria Auxiliadora
Fonte:
http://wwwfsma.feu.fr//m//m/mtea.mfhta.
f Acemmo ea: 25 j.nf 2018f
REFERÊNCIA
TELLES, G./.he/ae Pf et ..f A aethou to fnu /o.pm os o/tho o.m enem .c/omm a..tp.e enoaemf
Revista de Sistemas de Informação da Faculdade Salesiana Maria Auxiliadora
, nf 12, pf 2-7, 2013f
D/mponíve. ea: <http://wwwfsma.feu.fr//m//m/mtea.mfhta.>f Acemmo ea: 25 j.nf 2018f
A method to find groups of orthogous genes across
multiple genomes
Guilherme P. Telles, Institute of Computing, University of Campinas,
Nalvo F. Almeida, School of Computing, Federal University of Mato Grosso do Sul,
Paulo, A. Alvarez, Department of Computer Science, University of Bras´ılia,
Marcelo M. Brigido, Institute of Biology, University of Bras´ılia, and
Maria Emilia M. T. Walter, Department of Computer Science, University of Bras´ılia
A method to find groups of orthogous genes
across multiple genomes
Abstract—In this work we propose a simple method to obtain groups of homologous genes across multiple (k) organisms, calledkGC. Our method takes as input all-against-all Blastp comparisons and produces groups of homologous sequences. First, homologies among groups of paralogs of all the k compared genomes are found, followed by homologies of groups among k−1 genomes and so on, until groups belonging exclusively to only one genome, that is, groups of one genome not presenting strong similarities with any group of any other genome, are identified. We have used our method to determine homologous groups across six Actinobacterial complete genomes. To validate kGC, we first investigate the Pfam classification of the ho-mologous groups, and after compare our results with those produced by OrthoMCL. AlthoughkGC is much simpler than OrthoMCL it presented similar results with respect to Pfam classification.
Index Terms—orthologous genes, multiple genomes, comparative genomics, bioinformatics.
I. Introduction
T
HE large amount of genomic information being continuously generated by hundreds of sequencing genome projects around the world have been creating new challenges for large-scale bioinformatics analysis.Comparative genomics allows researchers to infer func-tions of biological sequences based on similarity to se-quences of other genomes whose function have already been discovered. The rationale is that strong similarities among genes of different genomes indicate that they could perform the same activity in their cellular mechanisms. These common features can be used for different applica-tions, such as phylogeny reconstruction or finding genes involved in inherited diseases.
To infer related functions, researchers develop methods to find homologous genes. Some methods identify orthol-ogy relationships by building or analyzing phylogenetic
Corresponding author: Almeida, [email protected]
trees. These methods require a great volume of computa-tional resources [1–5]. Other ones are based on all-against-all sequence comparisons among two genomes, that are easier to implement and present good results [6–11].
Some methods to identify orthology relationships across multiple genomes are known. OrthoMCL [12] is a broadly used method for constructing groups of orthologous genes across multiple eukaryotic genomes using a Markov cluster algorithm to group orthologs and paralogs. COG [13] is a manually curated database in which groups of orthologs are formed by merging “triangles” from bidirectional best hits, followed by heuristics designed to include more se-quences in a group. TribeMCL [14] also uses a Markov clustering algorithm to form groups from a graph defined by pairwise sequence similarity scores. MultiParanoid [15] employs a single linkage clustering on InParanoid [5] re-sults from all comparisons between two species, in order to group proteins across multiple species. It was designed to be used for closely related species, so that out-paralogs are not included in a group of true orthologs. Some methods combine phylogeny and comparative genomics [16]. Re-cently, new methods based on different techniques were introduced, e.g., based on graphs [17], based on the subtree hidden Markov model [18], or integrating distinct ortholog detection methods [19]. Besides, there are databases in-cluding orthologs, like OMA (Orthologous MAtrix) [20] and references to many ortholog databases [21].
Chen and co-authors [22] used the statistical method Latent Class Analysis (LCA) to infer sensitivity and speci-ficity of various methods to identify orthology relation-ships. They observed a trade-off between sensitivity and specificity in the detection of orthology, with Blast-based methods characterized by high sensitivity, and tree-based methods by high specificity. Among the seven analyzed methods, inParanoid and OrthoMCL have shown the best overall balance for both sensitivity and specificity, more than 80%.
The goal of this work is to present kGC, a method to construct groups of homologous genes among multiple genomes simultaneously.kGC generalizes a previous strat-egy [23, 24].
TELLES, G.P., ALMEIDA, N.F., ALVAREZ,P. et al./ Revista de Sistemas de Informa¸c˜ao da FSMA n. 12 (2013) pp. 2-7
Our method takes as input the Blastp all-against-all comparisons for the sequences inkgenomes and produces groups of similar sequences by searching for maximal cliques on ak-partite graph. Each group may contain se-quences from the same genome (potentially paralogs) and sequences from different genomes (potentially orthologs).
A comparison of our method to OrthoMCL on bacterial genomes, based on the hits against Pfam families, has shown that the kGC approach produces results whose quality is comparable to those found by the OrthoMCL method. The method is simple, with a small number of parameters and has reasonable running time.
In Section II, we briefly describe the method that was used to produce the groups of similar sequences inside a genome. After, we devise the kGC method to identify groups of similar sequences among multiple genomes. In Section III, we describe some details of our implementation and we show a case study of our method on six Acti-nobacteria. We investigated the Pfam [25] classification of the groups, and also compare our results with OrthoMCL. Finally, in Section IV we conclude and suggest future work.
II. The method
A. Searching for groups in a genome
We search for groups in a genome using part of EGG method [26]. EGG uses two simple graphs. In graph G= (V, E), each vertex v represents a gene gv, and an edge
(u, v)∈Eif there is a Blast alignment ofguandgvwhose
e-value is less than or equal to some threshold Iev and
covers at leastIcov% ofgu andgv. A graphG0= (V, E0) is
defined similarly, having different thresholdsIev0 andIcov0 . The algorithm proceeds in three steps. In the first step, it finds the maximal cliques in G. A maximal clique in
G represents a set of similar sequences. In the second step, the algorithm tries to aggregate other sequences to the cliques in order to avoid loosing strongly connected subgraphs that are not maximal cliques, but still represent groups of highly similar sequences.
Formally, a sequencegv will be an aggregate to a clique
Cif it does not belong toCand there exists a vertexu∈C
such that (v, u)∈E0. Although the condition to belong to a group is relaxed, the thresholdsIev0 andIcov0 may be even more stringent, allowing to keep the consistency of groups. In the third step, the method removes the redundancy generated in the second step (one vertex can be in several groups). This is done by choosing, among all groups containing an aggregated vertexv, the one with the highest average Blast score. Then v is removed from all groups except that one.
The resulting groups are used by kGC, which is detailed in the next section.
B. kGC
In a previous work [23], a method that relies on maximal cliques was proposed to compare three genomes. kGC generalizes that method allowing the comparison of any number of genomes, thus making the comparison strategy
more useful and comparable to others described in the literature.
Given a collection of k genomes, each genome itself comprising a set of gene sequences, the input for kGC is the result of all-against-all Blastp. The output is a collection of groups of similar sequences. We call such groups by families.
In a brief, the algorithm works as follows. The first step of kGC finds groups of similar sequences in each genome using the method described in Section II-A. The second step builds two k-partite graphsS (of sequences) and G
(of groups) and iterates from k to 2 (see Figure 1 for an intuition wherek= 3). In thei-th iteration, the algorithm searches fori-cliques inSand then searches fori-cliques in
G in a proper order. i-cliques in both graphs are reported by the algorithm as families.
(b)
(d) (a)
(c)
Fig. 1. Representation of kGC graphs withk= 3. (a) ak-clique inS, (b) ak-clique inG, (c) ak−1-clique inSand (d) an isolated group in one genome.
Formally, the k-partite graph of sequences S is a sim-ple graph where the vertices are the sequences of the
k genomes and there is an edge (su, sv) between two
sequences if they belong to different genomes and there is a Blastp alignment of su and sv whose e-value is less
than or equal to some threshold Aev and covers at least
Acov% ofsu andsv. It is clear that S is k-partite.
Thek-partite graph of groupsGis a simple graph where the vertices are the groups of similar sequences in one genome and there is an edge (gu, gv) between two groups
if they belong to different genomes and there is at least one edge (su, sv) inS such thatsu∈gu andsv∈gv.
As previously said, the algorithm performs k−1 iter-ations, ranging from k to 2. The i-th iteration has two major steps.
1) (search in graph S)All cliques of size i in S are found and added to a list Li initially empty, sorted
by non-increasing order of average coverage. Li is
processed sequentially as follows. For position j in
Li, let C = {s1, s2, . . . , si} be the clique vertices.
Each vertex in C belongs to a group gsi (possibly
unitary) of similar sequence in a genome. A familyf
is built as the union ofgs1, gs2, . . . , gsi and reported.
Any element of f is not further considered by the algorithm.
2) (search in graph G) All cliques of size i in G are found and added to a list Li initially empty, sorted
by non-increasing order of average coverage. Li is
Li, let C={g1, g2, . . . , gi} be the clique vertices. A
family f is built as the union of g1, g2, . . . , gi and
reported. Any element off is not further considered by the algorithm.
III. Results and Discussion
W
E have implemented the algorithms in Java and performed experiments to assess the behavior ofkGC.
Graphs were implemented using adjacency lists in arrays for both vertex and edge sets. Vertices and edges are removed from the graphs as families are reported. Cliques are found using the Bron-Kerbosch branch-and-bound algorithm [27]. Some small changes were made in order to speed-up the search, such as demanding that a vertex from the smallest genome is always in a clique and bounding the clique size by the number of partitions.
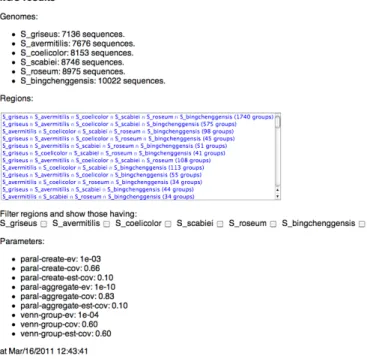
The results are presented in html, through a page that allows selecting the desired genomes presenting homolo-gous families (Figures 2 and 3).
Fig. 2. Reports of the experiments on genomes of Actinobacteria. Genomes presenting homologous families.
Fig. 3. A homologous family among three genomes.
In order to test our method, we have chosen the follow-ing six complete genomes of Actinobacteria, as available in January 2011 in GenBank.
• Streptomyces avermitilisMA 4680 (7676 protein genes) • Streptomyces bingchenggensis BCW 1 (10022 protein
genes)
• Streptomyces coelicolorA3 2 (8153 protein genes) • Streptomyces griseusNBRC 13350 (7136 protein genes) • Streptomyces scabiei87 22 (8746 protein genes)
• Streptosporangium roseum DSM 43021 (8975 protein
genes)
To validatekGC, we first computed the Pfam [25] model for each protein. Pfam is a database of multiple alignments of proteic domains groups. A proteic domain is a region of a protein having a specific biological function. Pfam database was chosen because it classifies a gene according to its biological functions. Among the total of 50,708 protein genes of our dataset, 37,093 (73.15%) had a Pfam model assigned.
Given a family f identified by kGC, let pf be the
most frequent Pfam model present in f (note that not necessarily all proteins in f have a Pfam model). Let nf
be the number of proteins in f with Pfam modelpf and
mf be the number of proteins inf with any Pfam model.
To each family found, a score is given by
score(f) = nf
mf
.
Thus, if all proteins (with Pfam) in a family have the same Pfam model (this is the best case), then this family score is equal to 1. The final score for the method is given by the summation of all family scores, considering only families with at lea1st one protein with Pfam model, divided by this number of families.
Table I shows the results of kGC for varying e-values and fixed coverages. The reference values are in column
Aevsince 10−5 and 10−20 are suitable ones for comparing
closely related genomes. Iev and Iev0 have been chosen to
avoid the bias that can be caused by homologs inside a genome.
Table II shows the results ofkGC for varying coverages and fixed e-values.
The same criterion were used to evaluate OrthoMCL, that identified 9,793 families (7,694 with at least one pro-tein with Pfam model, 78.46% of the total). The final score of OrthoMCL was 0.939. The running time for OrthoMCL was slightly less than 2 hours, on the same machine that executedkGC.
We can see from the tables that kGC produced fewer groups than OrthoMCL. As was expected, as the number of edges allowed in the graphs decreases, the cohesion of remaining groups with respect to Pfam families increases and so the score.
IV. Conclusion
I
N this work, we presented the kGC method to find groups of homologous genes among multiple (k) genomes. Although our method is very simple, it has in-teresting theoretical features, as strongly connected groups of sequences are likely to be gathered into a family.A drawback of kGC is the search for maximal cliques. Although the graph is bipartite, the algorithm may not
TELLES, G.P., ALMEIDA, N.F., ALVAREZ,P. et al./ Revista de Sistemas de Informa¸c˜ao da FSMA n. 12 (2013) pp. 2-7
scale very well. Our experiments on 6 genomes totaling 50,000 sequences run in reasonable time. Real improve-ments may came from switching from branch-and-bound to heuristics, at the price of sacrificing precision.
We developed experiments with six complete genomes of Actinobacteria, and validate the method using Pfam and comparing it to OrthoMCL. The estimate provided by Pfam is preliminary, in the sense that strongly related genes with no Pfam model may be formed without con-tributing to the score. Further analysis may reveal other features of the approach.
Acknowledgment
This work is partially supported by CNPq (grants 305503/2010-3 and 306731/2009-6), Finep (grant 01.08.0166.00) and Fundect (grant TO0096/2012).
References
[1] Y. Lee, R. Sultana,et al., “Cross-referencing eukary-otic genomes: TIGR orthologous gene alignments,”
Genome Res., vol. 12, no. 3, pp. 493–502, 2002. [2] C. M. Zmasek and S. R. Eddy, “Rio: analyzing
proteomes by automated phylogenomics using re-sampled inference of orthologs,” BMC Bioinform., vol. 3:14, no. 1, 2002.
[3] C. E. V. Storm and E. Sonnhammer, “Automated ortholog inference from phylogenetic trees and cal-culation of orthology reliability,”Bioinform., vol. 18, pp. 92–99, 2002.
[4] ——, “Comprehensive analysis of orthologous pro-tein domains using the hops database,” Genome Res., vol. 13, pp. 2353–2362, 2003.
[5] M. Remm, C. E. Storm, and E. Sonnhammer, “Au-tomatic clustering of orthologs and in-paralogs from pairwise species comparisons,”Journal of Molecular Biology, vol. 314, pp. 1041–1052, 2001.
[6] E. L. Braun, A. L. Halpern, M. A. Nelson, and D. O. Natvig, “Large-scale comparison of fungal sequence information: mechanisms of innovation in Neurospora crassa and gene loss in Saccharomyces cerevisiae,”Genome Res., vol. 10, pp. 416–430, 2000. [7] Y. Liu, X. S. Liu, L. Wei, R. B. Altman, and S. Batxoglou, “Eukariotic regulatory element conserva-tion analysis and identificaconserva-tion using comparative genomics,”Genome Res., vol. 14, pp. 451–458, 2004. [8] A. L. Delcher, S. Kasif, et al., “Alignments of whole genome,”NAR, vol. 27, no. 11, pp. 2369–2376, 1999. [9] M. Kellis, N. Patterson, and et al., “Methods in comparative genomics: genome correspondence, gene identification and motif discovery,”Bioinform., vol. 11, no. 2-3, pp. 319–355, 2004.
[10] B. Birren and I. F. Genome, “A white paper for fungal comparative genomics,”Whitehead Institute MIT Center for Genome, 2003.
[11] R. L. Tatusov, D. A. Natale, et al., “The COG database: new developments in phylogenic classifi-cation of proteins from complete genomes,”Nucleic Acids Res., vol. 29, pp. 22–28, 2001.
[12] L. Li, C. J. S. Jr, and D. S. Roos, “OrthoMCL: iden-tification of ortholog groups for eukaryotic genomes,”
Genome Res., vol. 13, no. 9, pp. 2178–2189, 2003. [13] R. L. Tatusov, N. D. Fedorova, et al., “The COG
database: an updated version includes eukaryotes,”
BMC Bioinform., vol. 4:41, 2003.
[14] A. Enright, S. V. Dongen, and C. Ouzounis, “An efficient algorithm for large-scale detection of protein families,”NAR, vol. 30, no. 7, pp. 1575–1584, 2002. [15] A. Alexeyenko, I. Tamas,et al., “Automatic cluster-ing of orthologs and inparalogs shared by multiple proteomes,”Bioinform., vol. 22, e9–e15, 2006. [16] S. B. Cannon and N. B. Young, “Orthoparamap:
distinguishing orthologs from paralogs by integrat-ing comparative genome data and gene phylogenies,”
BioMed Central Bioinform., vol. 4:35, 2003.
[17] D. S. Curtis, A. R. Phillips,et al., “SPOCS: software for predicting and visualizing orthology/paralogy re-lationships among genomes,”Bioinformatics, 2013. eprint: BioinformaticsfirstpublishedonlineAugust16, 2013doi:10.1093/bioinformatics/btt454.
[18] C. Afrasiabi, B. Samad,et al., “The Phylofacts FAT-CAT web server: ortholog identification and function prediction using fast approximate tree classifica-tion,”NAR, vol. 41, no. W1, W242–W248, 2013. [19] M. C. Maher and R. D. Hernandez, “A MOSAIC of
methods: improving ortholog detection through the integration of algorithmic diversity,” Quantitative Biology, 2013.
[20] A. M. Altenhoff, A. Schneider, G. H. Gonnet, and C. Dessimoz, “OMA 2011: orthology inference among 1000 complete genomes,” Nucleic Acids Research, vol. 39, pp. D289–D294, 2011.
[21] C. Dessimoz. (Oct. 2013). Quest for orthologs, [On-line]. Available: http : / / questfororthologs . org / orthology databases.
[22] F. Chen, A. Mackey,et al., “Assessing performance of orthology detection strategies applied to eukary-otic genomes,”PLoS ONE, vol. 2, no. 4, e383, 2007. [23] D. Anjos, G. Zerlotini,et al., “A method for inferring biological functions using homologous genes among three genomes,” inProc. of Brazilian Symposium on Bioinform., ser. LNBI, vol. 4643, Springer, 2007, pp. 69–80.
[24] G. P. Telles, N. F. Almeida, M. M. Brigido, P. A. Al-varez, and M. E. M. T. Walter, “kGC: finding groups of homologous genes across multiple genomes,” in
Proc. of Brazilian Symposium on Bioinformatics 2011, ser. LNBI, vol. 6832, Springer, 2011, pp. 79–82. [25] A. Bateman, L. Coin, R. Durbin, R. Finn, et al., “The Pfam protein families database,”Nucleic Acids
Res., vol. 32, pp. D138–D141, 2004.
[26] N. F. Almeida, “Tools for genome comparison,” In Portuguese, PhD thesis, Instituto de Computa¸c˜ao– Unicamp, 2002.
[27] C. Bron and J. Kerbosch, “Algorithm 457: finding all cliques of an undirected graph,”Comm. of the ACM, vol. 16, pp. 575–577, 1973.
TABLE I
Results ofkGC for 6 Actinobacterial genomes for varying e-values.
Iev Icov Iev0 I
0
cov Aev Acov families families % of families final time
with Pfam with Pfam score min. ev-5 10−7 0.60 10−12 0.80 10−5 0.60 6,908 5,011 72.54 0.910 71 ev-6 10−8 0.60 10−13 0.80 10−6 0.60 6,941 5,044 72.67 0.912 66 ev-7 10−9 0.60 10−14 0.80 10−7 0.60 6,945 5,063 72.90 0.913 149 ev-8 10−10 0.60 10−15 0.80 10−8 0.60 7,025 5,142 73.20 0.914 323 ev-9 10−11 0.60 10−16 0.80 10−9 0.60 7,058 5,190 73.53 0.916 350 ev-10 10−12 0.60 10−17 0.80 10−10 0.60 7,073 5,215 73.73 0.918 118 ev-11 10−13 0.60 10−18 0.80 10−11 0.60 7,102 5,266 74.15 0.920 33 ev-12 10−14 0.60 10−19 0.80 10−12 0.60 7,122 5,307 74.52 0.921 16 ev-13 10−15 0.60 10−20 0.80 10−13 0.60 7,141 5,321 74.51 0.924 10 ev-14 10−16 0.60 10−21 0.80 10−14 0.60 7,160 5,369 74.99 0.925 9 ev-15 10−17 0.60 10−22 0.80 10−15 0.60 7,210 5,438 75.42 0.927 8 ev-16 10−18 0.60 10−23 0.80 10−16 0.60 7,218 5,468 75.76 0.927 8 ev-17 10−19 0.60 10−24 0.80 10−17 0.60 7,242 5,504 76.00 0.928 7 ev-18 10−20 0.60 10−25 0.80 10−18 0.60 7,271 5,551 76.34 0.930 7 ev-19 10−21 0.60 10−26 0.80 10−19 0.60 7,260 5,575 76.79 0.931 7 ev-20 10−22 0.60 10−27 0.80 10−20 0.60 7,275 5,605 77.04 0.933 6 TABLE II
Results ofkGC for 6 Actinobacterial genomes for varying coverages.
Iev Icov Iev0 I
0
cov Aev Acov families families % of families final time
with Pfam with Pfam score min. cov-50 10−9 0.50 10−14 0.70 10−7 0.50 6,734 4,854 72.08 0.900 514
cov-55 10−9 0.55 10−14 0.75 10−7 0.55 6,815 4,938 72.46 0.907 207 cov-60 10−9 0.60 10−14 0.80 10−7 0.60 6,945 5,063 72.90 0.913 149 cov-65 10−9 0.65 10−14 0.85 10−7 0.65 7,124 5,241 73.57 0.922 50
TELLES, G.P., ALMEIDA, N.F., ALVAREZ,P. et al./ Revista de Sistemas de Informa¸c˜ao da FSMA n. 12 (2013) pp. 2-7
Guilherme P. Telles Guilherme P. Telles received his Doctoral degree in Computer Science in 2002 and currently is an assistante professor at the Institute of Computing of the University of Camp-inas.
Nalvo F. Almeida (corresponding author) Nalvo F. Almeida received his Ph.D. in Computer Science at Institute of Computing, State University of Campinas, in 2002 and currently is Associate Professor at School of Computing, Federal University of Mato Grosso do Sul.
Paulo A. AlvarezPaulo A. Alvarez received his Ms.C. in Informat-ics at the Department of Computer Science, University of Brasilia, in 2013 and currently is analyst at a private company.
Marcelo Macedo BrigidoMarcelo M Brigido received his Ph.D. in Biochemistry at Institute of Chemistry, University of S˜ao Paulo, in 1992 and currently is Full Professor at Biological Science Institute, University of Brasilia.
Maria Emilia M. T. WalterMaria Emilia M. T. Walter received his Ph.D. in Computer Science at the Institute of Computing, State University of Campinas, in 1999, and currently is Adjoint Professor at the Department of Computer Science, University of Brasilia