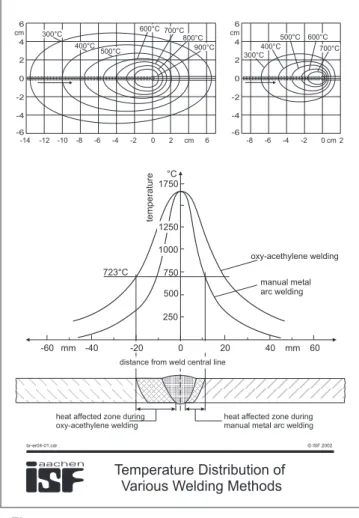
When welding a workpiece, not only the weld itself, but also the surrounding base material (HAZ) is influenced by the supplied heat quantity. The temperature-field, which ap-pears around the weld when different welding procedures are used, is shown in Figure 8.1.
Figure 8.2 shows the influence of the material properties on the welding process. The de-termining factors on the process presented in this Figure, like melting temperature and -interval, heat capacity, heat extension etc, depend greatly on the chemical composition of the material. Metallurgical properties are here characterized by e.g. homogeneity, structure and texture, physical properties like heat extension, shear strength, ductility. Structural changes, caused by the heat input (process 1, 2, 7, and 8), influence directly the mechanical properties of the weld. In addition, the chemical composition of the weld metal and adjacent base material are also influenced by the processes 3 to 6.
Based on the binary system, the formation of the different structure zones is shown in Figure 8.3. So the coarse grain zone occurs in areas
of intensely elevated
austenitising temperature for example. At the same time, hardness peaks appear in these areas because of
greatly reduced critical
cooling rate and the coarse
Temperature Distribution of Various Welding Methods
6 4 2 0 -2 -4 -6 -14 -12 -10 -8 -6 -4 -2 0 2 cm 6 cm cm 6 4 2 0 -2 -4 -6 -8 -6 -4 -2 0cm2 -60 mm -40 40 mm 60 250 500 750 °C 1750 oxy-acethylene welding manual metal arc welding temperature 723°C
distance from weld central line
heat affected zone during oxy-acethylene welding
heat affected zone during manual metal arc welding 300°C 400°C 500°C 600°C 700°C 800°C 900°C 300°C 400°C 500°C 600°C 700°C 1250 1000 20 -20 0 © ISF 2002 br-er04-01.cdr Figure 8.1
Classification of Welding Process Into Individual Mechanisms 4 7 5 8 9 10 2 1 3 6
Heating and melting the welding consumable
1
Melting parts of base material 2
Reaction of passing welding consumable with arc atmosphere
Reaction of passed welding consumable with molten base material
Interaction between weld pool and solid base material (possibly weld passes)
3
4
5
Reaction of metal and flux with atmosphere 6
Solidification of weld pool and slag 7
Cooling of welded joint in solid condition 8
Post-weld heat treatment if necessary Sustainable alteration of material properties
Specific heat, melting temperature and interval, melt heat, boiling temperature (metal, coating) Specific heat, melt temperature and interval, heat conductivity, heat expansion coefficient, homogeneity, time Compositionof atmosphere, affinity, pressure, temperature, dissotiation, ionisation, reaction speed Solubility relations, temperature and pressure under influence of heat source, specific weight, weld pool flux
Diffusion and position change processes, time, boundary formation, ordered - unordered structure Affinity, temperature, pressure, time Melt heat, cooling conditions, density and porosity of slag, solidification interval Phase diagrams (time dependent), heat conductivity, heat coefficient, shear strength, ductility Phase diagrams (time dependent), texture by warm deformation, ductility, module of elasticity Phase diagrams, operating temperature, mechanical and chemical strain, time
9 10
© ISF 2002 br-eI-04-02.cdr
austenite grains. This zone of the weld is the area, where the worst toughness values are found.
In Figure 8.4 you can see how much the forma-tion of the individual structure zones and the zones of unfavourable mechanical properties can be influenced.
Applying an electroslag one pass weld of a 200 mm thick plate, a HAZ of approximately 30 mm width is achieved. Using a three pass tech-nique, the HAZ is reduced to only 8 mm.
With the use of different procedures, the differ-ences in the formation of heat affected zones become even clearer as shown in Figure 8.5. These effects can actively be used to the ad-vantage of the material, for example to adjust calculated mechanical properties to one's choice or to remove negative effects of a
weld-ing. Particularly with high-strength fine grained steels and high-alloyed materials, which are specifically optimised to achieve special quality, e.g. corrosion resistance against a certain
attacking medium, this
post-weld heat treatment is of great importance.
Figure 8.6 shows areas in the Fe-C diagram of differ-ent heat treatmdiffer-ent meth-ods. It is clearly visible that the carbon content (and also the content of other alloying elements) has a distinct influence on the level of annealing temperaMicrostructure Zones of a Weld
-Relation to Binary System heat affected zone
(visible in macro section)
4 1 2 3 4 5 6 5 6 3 2 1 100 1500 1300 °C 1200 1000 G 800 P 600 400 300 S 723 1147 1 2 % 3 carbon content T emperature Hardness ageing bluebrittleness weld bead incomplete melt coarse grain standard transformation incomplete crystallisation recrystallisation hardness peak hardness sink 0,8 2,06 0,2 © ISF 2002 br-er04-03.cdr Figure 8.3 Figure 8.4
tures like e.g. coarse-grain heat treatment or normalising.
It can also be seen that the start of martensite formation (MS-line) is shifted to continuously decreasing temperatures with increasing C-content. This is important e.g. for hardening processes (to be explained later).
As this diagram does not cover the time influence, only constant stop-tempera-tures can be read, predic-tions about heating-up and cooling-down rates are not possible. Thus the individual heat treatment methods will be explained by their
tem-perature-time-behaviour in
the following.
Development of Heat Affected Zone of EB, Sub-Arc, and MIG-MAG Welding
gas metal arc welding electron beam welding
100
submerged arc welding pass / capped pass
40 12 © ISF 2002 br-er04-05.cdr Figure 8.5 Metallurgical Survey of Heat Treatment Methods 1600
°C 1536
metastable system iron-carbon (partially)
1392 1300 1200 1100 1000 911 800 700 600 500 400 300 200 100 20 °C 1400 1300 1200 1100 1000 900 800 700 600 500 400 300 200 100 20 1600 0 0,5 0,8 1 1,5 2
Carbon content in weight %
30 25 20 15 10 5 0 Fe A H1493°C B d- solid solution + austenite d- solid solution cbc atomic lattice melt melt + austenite
diffusion heat treatment
coarse grain heat treatment E 2,06 cfc atomic lattice A4 heat colors yellow white light yellow yellow yellow red light red cherry-red dark red brown red dark brown 1147 A3 austenite ( - Mischkristalle)g Acm austenite + secondary cementite (Fe C)3 K S austenite + ferrite A2 M A1 P 723°C O
recrystallisation heat treatment
recrystallisation heat treatment Q ferrite ( -solid solution)a soft annealing stress relieving cbc atomic lattice hardening tempering MS eutektoidic steel
Cementite content in weight %
© ISF 2002 br-er04-06.cdr melt + - solid solution d N normalising + hardening G 769°C
hypoeutectoidic steel hypereutectoidic steel
Figure 8.6
Coarse Grain Heat Treatment
T emperature Time 900 700 500 300 °C austenite A3 A1 austenite + ferrite ferrite + perlite T emperature C-Content long time several hours intense heating 0,4 0,8 % © ISF 2002 br-eI-04-07.cdr Figure 8.7
Figure 8.7 shows in the detail to the right a T-t course of coarse grain heat treatment of an alloy containing 0,4 % C. A coarse grain heat treatment is applied to create a grain size as large as possible to improve machining properties. In the case of welding, a coarse grain is unwelcome, although unavoidable as a consequence of the welding cycle. You can learn from Figure 8.7 that there are two methods of coarse grain heat treatment. The first way is to
austenite at a temperature close above A3 for a couple of hours followed by a slow cooling
process. The second method is very important to the welding process. Here a coarse grain is
formed at a temperature far above A3 with relatively short periods.
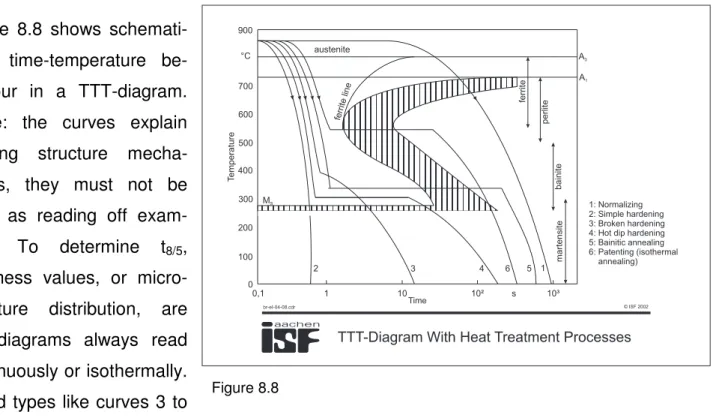
Figure 8.8 shows schemati-cally time-temperature be-haviour in a TTT-diagram. (Note: the curves explain running structure mecha-nisms, they must not be used as reading off
exam-ples. To determine t8/5,
hardness values, or micro-structure distribution, are TTT-diagrams always read continuously or isothermally. Mixed types like curves 3 to
6 are not allowed for this purpose!).
The most important heat treatment methods can be divided into sections of annealing, hard-ening and tempering, and these single processes can be used individually or combined. The normalising process is shown in Figure 8.9. It is used to achieve a homogeneous
ferrite-perlite structure. For this purpose, the steel is heat treated approximately 30°C above Ac3
until homogeneous austenite evolves. This condition is the starting point for the following hardening and/or quenching and tempering treatment. In the case of hypereutectoid steels,
austenisation takes place above the A1 temperature. Heating-up should be fast to keep the
austenite grain as fine as possible (see TTA-diagram, chapter 2). Then air cooling follows, leading normally to a transformation in the ferrite condition (see Figure 8.8, line 1; formation of ferrite and perlite, normalised micro-structure).
1: Normalizing 2: Simple hardening 3: Broken hardening 4: Hot dip hardening 5: Bainitic annealing 6: Patenting (isothermal annealing) 0,1 900 0 100 200 300 400 500 600 700 °C austenite ferrite lin e T emperature MS 2 3 4 6 5 1 1 10 10² s 10³ A3 A1 ferrite perlite bainite martensite Time
TTT-Diagram With Heat Treatment Processes © ISF 2002 br-eI-04-08.cdr
To harden a material, aus-tenisation and homogeni-sation is carried out also at
30°C above AC3. Also in
this case one must watch that the austenite grains remain as small as possi-ble. To ensure a complete transformation to marten-site, a subsequent
quench-ing follows until the
temperature is far below the Ms-temperature, Figure 8.10. The cooling rate dur-ing quenchdur-ing must be high enough to cool down from the austenite zone directly into the martensite zone without any further phase transitions (curve 2 in Figure 8.8). Such quenching processes build-up very high thermal stresses which may destroy the workpiece during hard-ening. Thus there are variations of this process, where perlite formation is suppressed, but due to a smaller temperature gradient thermal stresses remain on an uncritical level (curves 3 and 4 in Figure 8.8). This
can be achieved in practice –for example- through stop-ping a water quenching process at a certain tem-perature and continuing the cooling with a milder cooling medium (oil). With longer holding on at elevated tem-perature level, transforma-tions can also be carried through in the bainite area (curves 5 and 6). Normalizing T emperature Time 900 700 500 300 °C austenite A3 A1 austenite + ferrite ferrite + perlite T emperature C-Content 0,4 0,8 %
transformation and homogenizing of -solid solution (30-60 min) at 30°C above A g 3 quick heating air cooling © ISF 2002 br-eI-04-09.cdr Figure 8.9 Hardening T emperature Time 900 700 500 300 °C austenite A3 A1 austenite + ferrite ferrite + perlite T emperature C-Content 0,4 0,8 % start of martensite formation quenching in water about 30°C above A3 start of martensite formation © ISF 2002 br-eI-04-10.cdr Figure 8.10
Figure 8.11 shows the quenching and tempering procedure. A hardening is followed by
an-other heat treatment below Ac1. During this tempering process, a break down of martensite
takes place. Ferrite and cementite are formed. As this change causes a very fine micro-structure, this heat treat-ment leads to very good mechanical properties like e.g. strength and tough-ness.
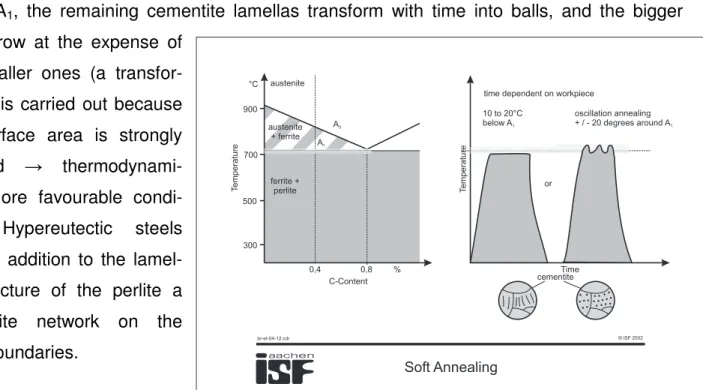
Figure 8.12 shows the pro-cedure of soft-annealing. Here we aim to adjust a soft and suitable micro-structure for machining. Such a structure is charac-terised by mostly globular formed cementite particles, while the lamellar structure of the perlite is resolved (in Figure 8.12 marked by the circles, to the left: before, to the right: after soft-annealing). For
hypoeu-tectic steels, this spheroidizing of cementite is achieved by a heat treatment close below A1.
With these steels, a part of the cementite bonded carbon dissolves during heat treating close
below A1, the remaining cementite lamellas transform with time into balls, and the bigger
ones grow at the expense of the smaller ones (a transfor-mation is carried out because the surface area is strongly
reduced →
thermodynami-cally more favourable
condi-tion). Hypereutectic steels
have in addition to the lamel-lar structure of the perlite a cementite network on the grain boundaries.
Hardening and Tempering
T emperature Time 900 700 500 300 °C austenite A3 A1 austenite + ferrite ferrite + perlite T emperature C-Content 0,4 0,8 % quenching about 30°C above A3
hardening and tempering
slow cooling © ISF 2002 br-eI-04-11.cdr Figure 8.11 Soft Annealing T emperature Time 900 700 500 300 °C austenite A3 A1 austenite + ferrite ferrite + perlite T emperature C-Content 0,4 0,8 %
time dependent on workpiece 10 to 20°C below A1 oscillation annealing + / - 20 degrees around A1 or cementite © ISF 2002 br-eI-04-12.cdr Figure 8.12
Spheroidizing of cementite is achieved by making use of the transformation processes during
oscillating around A1. When exceeding A1 a transformation of ferrite to austenite takes place
with a simultaneous solution of a certain amount of carbon according to the binary system Fe
C. When the temperature drops below A1 again and is kept about 20°C below until the
trans-formation is completed, a re-precipitation of cemen-tite on existing nuclei takes place. The repetition of this process leads to a step-wise spheroidizing of ce-mentite and the frequent transformation avoids a grain coarsening. A
soft-annealed microstructure
represents frequently the delivery condition of a ma-terial.
Figure 8.13 shows the principle of a stress-relieve heat treatment. This heat treatment is used to eliminate dislocations which were caused by welding, deforming, transformation etc. to improve the toughness of a workpiece. Stress-relieving works only if present dislocations are able to move, i.e. plastic structure deformations must be executable in the micro-range. A temperature increase is the
commonly used method to make such deformations possible because the yield strength limit decreases with increasing temperature. A stress-relieve heat treatment should not cause any other change to properties, so that tempering steels are heat
treated below tempering
temperature. Stress Relieving T emperature Time 900 700 500 300 °C austenite A3 A1 austenite + ferrite T emperature C-Content 0,4 0,8 %
time dependent on workpiece
between 450 and 650 °C ferrite + perlite © ISF 2002 br-eI-04-13.cdr Figure 8.13 Stress releaving
Heat treatment at a temperature below the lower transition point A1, mostly between 600 and 650°C, with subsequent slow cooling for relief of internal
stresses; there is no substantial change of present properties.
Normalising
Heating to a temperature slightly above the upper transition point A3 (hypereutectoidic steels above the lower transition point A1), followed by
cooling in tranquil atmosphere. Hardening (quench
hardening)
Acooling from a temperature above the transition point A3or A1with such a
speed that an clear increase of hardness occurs at the surface or across the complete cross-section, normally due to martensite development. Quenching and
tempering
Heat treatment to achieve a high ductility with defined tensile stress by hardening and subsequent tempering (mostly at a higher temperature. Solution or
quenching heat treatment
Fast cooling of a workpiece. Also fast cooling of austenitic steels from high temperature (mostly above 1000°C) to develop an almost homogenuous
micro-structure with high ductility is called 'quenching heat treatment'.
Tempering
Heating after previous hardening, cold working or welding to a temperature between room temperature and the lower transformation point A1; stopping
at this temperature and subsequent purposeful cooling.
Type and Purpose of Heat Treatment © ISF 2002 br-eI-04-14.cdr
Figure 8.14 shows a survey of heat treatments which are important to welding as well as their purposes.
Figure 8.15 shows princi-pally the heat treatments in connection with welding. Heat treatment processes are divided into: before, during, and after welding. Normally a stress-relieving or normalizing heat treat-ment is applied before welding to adjust a proper material condition which for welding. After welding, al-most any possible heat treatment can be carried out. This is only limited by workpiece
dimen-sions/shapes or arising costs. The most impor-tant section of the diagram is the kind of heat treatment which accom-panies the welding. The most important processes are explained in the following.
Figure 8.16 represents the influence of differ-ent accompanying heat treatmdiffer-ents during welding, given within a TTT-diagram. The fast-est cooling is achieved with welding without preheating, with addition of a small share of bainite, mainly martensite is formed (curve 1, analogous to Figure 8.8, hardening). A simple heating before welding without additional stop-ping time lowers the cooling rate according to curve 2. The proportion of martensite is re-duced in the forming structure, as well as the
Heat Treatment in Connection With Welding
combination preheating simple preheating increase of working temperature constant working temperature local preheating preheating of the complete workpiece isothermal welding postheating (”post weld heat
treatment”) heat treatment of the complete workpiece local heat treatment annealing stress releaving stress
releaving annealing hardening quenchingand tempering solution heat treatment tempering simple step-hardening welding pure step hardening welding modified step hardening welding Types of heat treatments
related to welding heat treatment before welding combi-nation accompanying heat treatment combi-nation heat treatment after welding (”post-weld heat treatment”) © ISF 2002 br-eI-04-15.cdr Figure 8.15 TTT-Diagram for Different Welding Conditions 800 700 600 500 400 300 200 100 0 0 1 10 102 103 104 105 s °C T emperature T Time t MS TA (1) (2) (3) tH
(1): Welding without preheating,
(2): Welding with preheating up to 380°C, without stoppage time (3): Welding with preheating up to 380°C and about 10 min. stoppage time
T : Stoppage temperature, t : Dwell timeA H
© ISF 2002 br-er04-16.cdr
level of hardening. If the material is hold at a temperature above MS during welding (curve 3),
then the martensite formation will be completely suppressed (see Figure 8.8, curve 4 and 5).
To explain the temperature-time-behaviours used in the following, Figure 8.17 shows a su-perposition of all individual influences on the materials as well as the resulting T-T-course in the HAZ. As an example, welding with simple
preheating is selected.
The plate is preheated in a period tV. After
re-moval of the heat source, the cooling of the
workpiece starts. When tS is reached, welding
starts, and its temperature peak overlays the cooling curve of the base material. When the
welding is completed, cooling period tA starts.
The full line represents the resulting tempera-ture-time-behaviour of the HAZ.
The temperature time course during welding with simple preheating is shown in Figure 8.18.
During a welding time tS a
drop of the working
tem-perature TA occurs. A
fur-ther air cooling is usually carried out, however, the cooling rate can also be reduced by covering with heat insulating materials.
Another variant of welding with preheating is welding
at constant working
temperature. This is
Temperature-Time-Distribution During Welding With Preheating
tV tS tA
start seam end
transformation range Time t T emperature T TS A3 A1 TV T : Preheat temperature, T : Melting temperature of material, t : Preheat time,
t : Welding time,
t : Cooling time (room temperature), M : Martensite start temperature A : Upper transformation temperature, A : Lower V S V S A S 3 1 transformation temperature Course of resulting temperature in the area of the heat affected zone of the base material. Temperature distribution by preheating, Course of temperature during welding. © ISF 2002 br-er04-17.cdr Figure 8.17
Welding With Simple Preheating
A3 A1 T emperature T Time t tV tS tA TA TV T : Preheat temperature, T : Working temperature, t : Preheat time, t : Welding time,
t : Cooling time (room temperature) V A V S A Temperature of workpiece, Temperature of weld point
© ISF 2002 br-eI-04-18.cdr
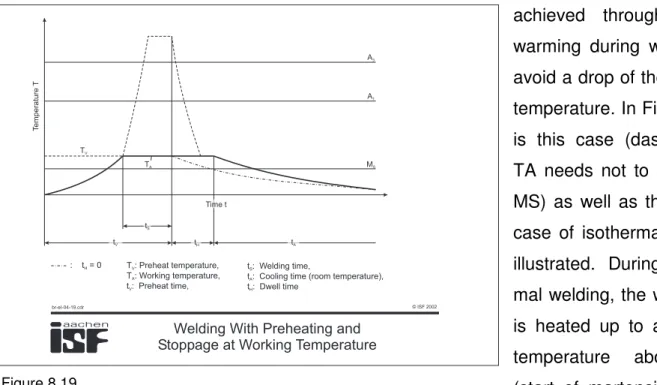
achieved through further warming during welding to avoid a drop of the working temperature. In Figure 8.19 is this case (dashed line, TA needs not to be above MS) as well as the special case of isothermal welding illustrated. During isother-mal welding, the workpiece is heated up to a working
temperature above MS
(start of martensite forma-tion) and is also held there after welding until a transformation of the austenitised areas has been completed. The aim of isothermal welding is to cool down in accordance with curve 3 in Figure 8.16 and in this way, to suppress martensite formation.
Figure 8.20 shows the T-T course during welding with post-warming (subsequent heat treatment, see Figure 8.15). Such a treatment can be carried out very easy, a gas welding torch is normally used for a local preheating. In this way, the toughness properties of some steels can be greatly improved. The lower sketch shows a combination of pre- and post-heat treatment. Such a treatment is applied to steels which have such a strong tendency to hardening that a cracking in spite of a simple preheating before welding cannot be avoided, if they cool down directly from working tem-perature. Such materials are heat treated immediately after welding at a temperature between 600 and 700°C, so that a formation Welding With Preheating and Stoppage at Working Temperature
T emperature T Time t tS tV tH tA A3 A1 MS TV TA : t = 0H T : Preheat temperature, T : Working temperature, t : Preheat time, V A V t : Welding time,
t : Cooling time (room temperature), t : Dwell time S A H © ISF 2002 br-eI-04-19.cdr Figure 8.19 Welding With Pre- and Post-Heating
T emperature T Time t TN tS tN tA A3 A1 A3 A1 T emperature T TN TV TA Time t tV tS tR tN tA
2. Pre- and post-heating 1. Post-heating T : Preheat temperature, T : Working temperature, T : Postheat temperature, t : Preheating time, V A N V t : Welding time,
t : Cooling time (room temperature), t : Postheat time t : Stoppage time S A N R © ISF 2002 br-er04-20.cdr Figure 8.20
of martensite is avoided and welding residual stresses are eliminated simultaneously.
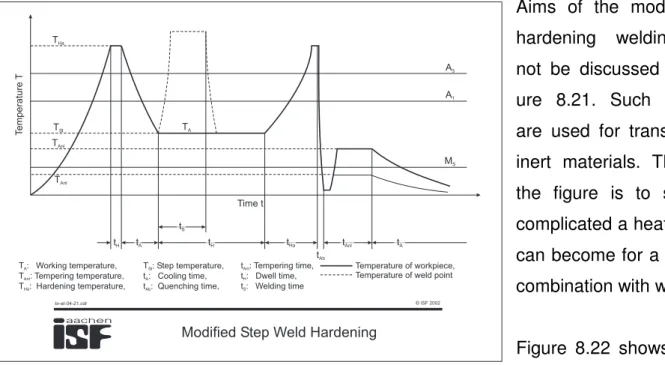
Aims of the modified step-hardening welding should not be discussed here, Fig-ure 8.21. Such treatments are used for transformation-inert materials. The aim of the figure is to show how complicated a heat treatment can become for a material in combination with welding.
Figure 8.22 shows tempera-ture distribution during multi-pass welding. The solid line represents the T-T course of a point in the HAZ
in the first pass. The root pass was welded without preheating. Subsequent passes were welded without cooling down to a certain tem-perature. As a result, working temperature in-creases with the number of passes. The second pass is welded under a preheat tem-perature which is already above martensite start temperature. The heat which remains in the workpiece preheats the upper layers of the weld, the root pass is post-heat treated through the same effect. During welding of the last pass, the preheat temperature has reached such a high level that the critical cooling rate will not be surpassed. A favourable effect of multi-pass welding is the warming of the HAZ of each previous pass above recrystallisation temperature with the corresponding
crystallisa-Modified Step Weld Hardening
A3 A1 MS TA THa TSt TAnl TAnl tA tAnl tAb tHa tS tH tA tH Time t T emperature T T : Working temperature, T : Tempering temperature, T : Hardening temperature, A Anl Hä T : Step temperature, t : Cooling time, t : Quenching time, St A Ab t : Tempering time, t : Dwell time, t : Welding time Anl H S Temperature of workpiece, Temperature of weld point
© ISF 2002 br-eI-04-21.cdr
Figure 8.21
Temperature-Time Distribution During Multi-Pass Welding T : Preheat temperature,
T : Melting temperature of material, t : Preheat time,
t : Welding time
t : Cooling time (room temperature), A : Upper transformation temperature, M : Martensite start temperature
V S V S A 3 S
heat affected zone
1 4 3 2
}
weld pass observed point 1 2 3 4 weld pass T emperature T A3 MS TS TV Time t tS tV tA © ISF 2004 br-er04-22.cdr Figure 8.22tion effects in the HAZ. The coarse grain zone with its unfavourable mechanical properties is only present in the HAZ of the last layer. To achieve optimum mechanical values, welding is not carried out to Figure 8.22. As a rule, the same welding conditions should be applied for all
passes and prescribed t8/5 – times must be kept, welding of the next pass will not be carried
out before the previous pass has cooled down to a certain temperature (keeping the inter-pass temperature). In addition, the workpiece will not heat up to excessively high tempera-tures.
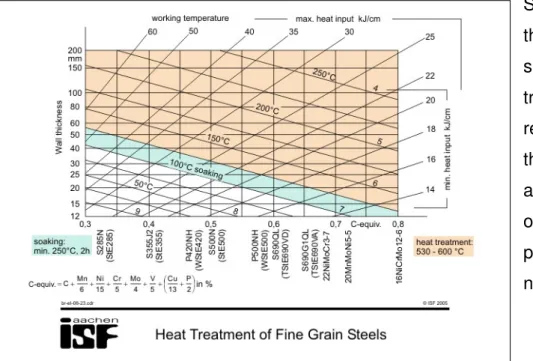
Figure 8.23 shows a nomogram where working temperature and minimum and maximum heat input for some steels can be interpreted, depending on carbon equivalent and wall thick-ness.
If e.g. the water quenched and tempered fine grain structural steel S690QL of 40 mm wall thickness is welded, the following data can be found:
- minimum heat input between 5.5 and 6 kJ/cm - maximum heat input about 22 kJ/cm
- preheating to about 160°C
- after welding, residual stress relieving between 530 and 600°C.
Steels which are placed in the hatched area called soaking area, must be treated with a hydrogen relieve annealing. Above this area, a stress relieve annealing must be carried out. Below this area, a post-weld heat treatment is not required.