Ageing and Capital Flows
Financial System Inquiry
Table of Contents
1. Executive Summary ...2
2. Scope of Work ...6
3. Overview of Australian Superannuation market ...7
4. Basis of projections ... 13
5. Projected size of superannuation market ... 18
6. Shift from Accumulation to pension phase... 22
7. Savings outside superannuation ... 25
8. Asset allocation of superannuation funds ... 30
9. Impact of change ... 33
Appendix A Superannuation – detailed tables ... 35
Report commissioned by:
Level 2
50 Carrington Street
Sydney NSW 2000, Australia
t +61 (0) 2 9233 3466 | f +61 (0) 2 9233 3446
1.
Executive Summary
1.1
Brief
The Financial System Inquiry (FSI) approached the Actuaries Institute to provide some modelling on the impact of demographic changes on external capital flows as a result of our ageing population.
The Actuaries Institute has asked Rice Warner to conduct the modelling based on the model developed to produce the results for our annual Superannuation Market Projections1.
1.2
Size of superannuation sector
The superannuation market has grown sharply in recent years. As at 30 June 2013, funds under management sat at $1.6 trillion up from only $530 billion 10 years ago.
The sector is projected to grow at a compound rate of 14.5% p.a. (nominal) in the 30 years to 2043. Assets will then be more than $5 trillion. This continued rapid growth is likely to see superannuation growing in importance in the economy. Superannuation assets represent close to 108% of GDP in 2013 and are projected to plateau at 160% of GDP by the end of the projection period.
Note that our model is deterministic and provides a central estimate of market projections. Stochastic projections have not been undertaken.
1.3
Shift from Accumulation to pension phase
As the population ages, not only is the superannuation industry expected to grow, but the composition of the industry will also change. Currently, members in the pension phase (that is, those who have retired) account for 30.4% of total superannuation assets as at 30 June 2013. This percentage is expected to grow to 43.7% of assets in 30 years.
The relative growth in importance for this sector reflects the ageing of Australia’s population and the maturation of the industry. Assets in respect of retired members will grow as the baby boomers retire and, following that, the next generation of members will retire having had superannuation for their entire working career.
1.4
Savings outside superannuation
Savings outside superannuation account for $2.3 trillion in assets. This market is larger than the superannuation market, however, most of it is directly held by investors:
46.7% of personal investments are in the form of directly held investment properties.
Directly held cash and term deposits account for 33.8% of personal investments.
Directly held investments in equities account for 11.1% of personal investments.
Investment master trusts and wrap platforms account for 4.8% of personal investments, but if directly held investment property is excluded, investment master trusts and wrap platforms account for 9.0% of the remaining market.
The market is projected to grow to $4.6 trillion in assets by 30 June 2028, which is a compound growth rate of 4.8% a year. The rate of growth varies by the type of asset (see Table 18) in section 7.4
1.5
Asset allocation of superannuation funds
The typical default option for an APRA regulated superannuation fund follows a 70/30 growth to defensive asset allocation. With the introduction of MySuper, many funds have had the opportunity to rethink their asset allocation. In particular, many commercial providers have introduced lifecycle options which reduce the member’s exposure to growth assets as they age.
Industry Funds with their positions as default funds under awards have more security of cash flow and are less exposed to member and employer switching. They can therefore hold higher proportions of Direct Property and infrastructure (included in Other assets in Table 22).
The SMSF sector has a vastly different asset allocation to the rest of the industry, with close to half of the assets in Australian equities and almost a third of assets in cash (and term deposits). This reflects the preference of many SMSF members for domestic listed investments – largely to benefit from franking credits. Retired SMSF members hold about half of all SMSF assets and many members of this cohort have a preference for the stable income and supporting guarantees of term deposits.
1.6
Impact of change
The ageing of the population, the concurrent maturation of the superannuation market and the structural changes within that market will produce significant systemic changes in the volume of capital and its allocation.
The key changes that can be expected over the next thirty years are:
The assets within the superannuation industry will grow significantly in real terms from about $1.6 trillion at June 2013 to more than $5 trillion in 30 years.
This asset base will also grow as a proportion of GDP from 108% in 2013 and will stabilise at around 160% of GDP in 30 years.
This stabilisation will reflect the maturation of the market with some 44% of assets being held in the pension phase at that stage.
The average age of pensioners will rise.
There will be a small number of large funds. It is difficult to predict the exact number, but if 10 funds had 60% of the assets, they would average $300 billion each (in present value).
The SMSF sector will lose its share of the overall market as it moves increasingly to supporting members in the pension phase.
These changes can be expected to have the following impacts:
The gradual maturation of the market in the mid 2030s will see net real cash flows move towards neutrality as pension drawdowns compensate for contribution inflows. Asset growth will trend to reflect population and economic growth and inflation.
The much larger proportion of assets held in the pension phase due to this maturation will also be reflected in aggregate asset allocations across the market because of the need by pensioners for greater capital value security.
This need for stability will also impact the choices of products by pensioners which will in turn impact aggregate asset allocations. Changes that can be expected include:
- An increase in the proportion of total assets held in defensive asset categories like government and corporate bonds.
- This move to defensive assets will be driven firstly by the increasing numbers of members moving into the pension phase, but will be driven further as these members age and become even less risk tolerant.
- There will be greater and increasing use made of defensive overlays to protect members against significant asset value falls. These will include the growing use of sophisticated derivative strategies which will in turn require greater depth in derivative markets. They will also include the use of balance sheet guarantees (by insurers and banks) that will require the expansion of the capital bases of the providers.
- The growing and ageing pensioner base will also see an increasing interest in products that protect against longevity risk (i.e. outliving one’s assets). Annuities are currently the only products providing this protection by pooling the longevity risk – with earlier deaths subsidising later deaths. There will therefore be an increasing interest in lifetime annuities which will in turn increase the demand for and use of fixed interest assets like government and corporate bonds.
- The demand for annuities may also see a demand for innovative structures around other stable cash flow investments like infrastructure.
The growth in the size of the market as a proportion of GDP will require greater allocations to overseas assets in general. The allocation profiles of these assets will be similar to existing
With the consolidation of the market, there will be a shift to more illiquid investments as the very large funds will have significant, stable and predictable cash flows. Investments in infrastructure and property will grow. Over the next decade, this may be directed within Australia due to past under-investment and new opportunities. Recent sales of ports and freeway infrastructure have demonstrated both the superannuation market’s capacity and appetite for these assets. This will undoubtedly continue and could strengthen over this period. As domestic demand is met, investment in these and other categories will need to expand overseas.
It may well also be possible to open other public infrastructure assets to investment by superannuation funds. Public Private Partnerships should also be suitable for developing the extra health and aged care facilities that will be required by the ageing population.
1.7
Impact of Choice
The asset allocation of SMSFs is different from that of pooled funds. Over time, they might converge as online trading platforms open up to easier access for direct investments such as international equities and listed infrastructure trusts (which might mirror the structure of listed property trusts).
Already, the ASX has set up an online facility for managed funds which will be available to retail investors including SMSFs. We expect this will be broadened to other asset classes in time.
We believe SMSFs will have an appetite for illiquid investments as they invest long term and are not concerned about short-term asset volatility. There has been recent growth in property assets within this segment.
This report was prepared and peer reviewed for the Financial Services Inquiry (FSI) by the following consultants.
Prepared by Peer Reviewed by
_________________ ___________________
Michael Rice Alun Stevens
CEO Senior Consultant
Telephone: (02) 9293 3704 Telephone: (03) 8621 4105
2.
Scope of Work
2.1
Background
The FSI is charged with examining how the financial system could be positioned to best meet Australia’s evolving needs and support Australia’s economic growth. As the population ages, the superannuation sector will shift from the accumulation phase it is in presently to the retirement phase as a large part of the population retires. This process will likely have a significant bearing on asset allocation and the flow of funds within the economy – and, in particular, on capital flows with the rest of the world.
2.2
Objective
The Committee would like to explore how Australia’s demographic trends will affect Australia’s external capital flows, from changes to the behaviour and influence of the superannuation sector as it shifts from the accumulation phase to the retirement phase. The work would address the following questions:
How will Australia’s demographic trends and the associated shift in superannuation fund activity (from accumulation to retirement) affect broader sectoral saving trends in the Australian economy?
How will these changes be reflected in the pattern of asset allocation of Australian savings (particularly by superannuation funds)?
How will the changes above be reflected in the type/amount of funding that is available to the Australian economy, and what will be the implications for the size and nature of cross-border capital flows?
2.3
Scope
The work should identify the major shifts in sectoral saving trends in the Australian economy, and how this will change patterns of asset allocation, the flow of funds and external funding.
3.
Overview of Australian Superannuation market
3.1
Segmentation of superannuation
Section 3.1 of this report has been taken from a report prepared for the Australian Bankers Association and included as an appendix to its submission to the FSI. The text is included here for completeness. There are three homogenous groups which together comprise the superannuation industry. While all are governed by the same legislation, the different characteristics of these groups mean that each has a different profile in some critical areas.
The groups are:
not for profit employer-sponsored funds ($643 billion)
commercial funds ($465 billion)
self-managed superannuation funds ($507 billion).
The current and projected size of the three generic segments is set out below, including the major product types within each. Assets include defined benefit and defined contribution structures. Rice Warner estimates the market will grow at a compound annual growth rate of 8.1% over the next 15 years and 14.1% over the next 30 years.
3.1.1
Corporate funds
Corporate funds were once the main channel for superannuation in Australia. However, the growth of mandatory employer superannuation contributions and the shift from defined benefits has led to most employers closing their corporate funds.
According to APRA, there were 108 corporate funds as at 30 June 2013, a reduction from the 1,862 that existed a decade earlier. Rice Warner expects all remaining corporate funds to be wound up over the next 15 years.
As corporate funds close, members and assets have been transferred to funds which cater for multiple employers, such as industry funds (in the Not for Profit segment) or master trusts (in the Commercial segment). Sunsuper is an industry fund that caters for corporate sub-plans. Plum and Mercer are the two best examples of corporate master funds. Further, many large companies (typically with fund assets exceeding $20m) became a quarantined sub-plan often with their own investment and insurance arrangements – but without any trustee representation.
The recent legislation requiring all funds to hold a MySuper licence also led to many corporations closing down their fund. In addition, many of the corporate sub-plans have converted their arrangements to a standard MySuper offer where the trustees manage the default investments. There are only about 30 tailored MySuper products where the companies decided to maintain their existing structure (as a sub-plan) and still control the investment strategy. These funds all have assets exceeding $100 million.
Corporate funds are characterised by high average balances and a higher percentage of members approaching retirement. Some employers pay more than the required mandatory contribution rate.
The consequences of these structural features are that:
Corporate funds represent a small and a declining share of the market.
The defined benefit component of this segment represents a declining share of the segment.
We anticipate all stand-alone corporate funds will close within 15 years.
Most have high average benefits and an older membership profile. Those with defined benefit pensions generally retain these older members as they move into retirement, but those with lump sum benefits generally lose the members and the assets causing negative cash flows.
Those with negative cash flows need to invest more conservatively with an emphasis on liquidity and a matching of assets to cash flow. These funds generally have high allocations to fixed interest and cash.
3.1.2
Public sector funds
The Federal and State governments (and their agencies) all have defined contribution funds. Some funds pay high contribution rates. For example, the Queensland government pays 13% of salaries and the Federal Government pays 15.4%
As a result of high contribution rates and long periods of employment, these funds tend to have higher than average balances. While all governments used to have defined benefit funds, all the major funds have been closed to new members. The results are similar to those described for Corporate funds. The defined benefit sections of many of these funds are not growing and some are declining as older members leave. This decline, and the desire to match assets with liabilities, however, forces the funds to invest for liquidity.
3.1.3
Industry funds
Most industry funds were created after a 1985 centralised wage decision to grant employees a 3% superannuation contribution. At that time, 60% of the population had no superannuation so many workers started with nothing. As a result, this segment has the lowest average balances.
These funds receive mandatory employer contributions under industrial awards. This provides a guaranteed strong cash flow which allows the funds to invest in illiquid assets and have a long-term investment perspective.
3.1.4
Commercial funds
This segment is described as ‘retail’ by APRA but it contains a mixture of retail and wholesale funds. These products are offered by organisations which manage superannuation as a business for profit. AMP and the four wealth management subsidiaries of the large banks hold a significant share of the assets in this segment.
As well as employer-sponsored superannuation, this segment manages money for individuals (including self-employed persons). It also provides separate pension products for individuals whereas pensions tend to be held in the same fund in other segments.
3.2
Past growth
Superannuation growth has been rapid in Australia over the last decade. The growth has been underpinned by the mandatory employer contributions as well as the shift of assets into self-managed superannuation funds which have become the preferred savings vehicle of many wealthier Australians. Superannuation assets are growing twice as fast as GDP. We believe assets will peak at about 160% of GDP in the mid-2030s (see section 5).
The composition of the industry is changing too. Industry funds and SMSFs have grown strongly at the expense of the commercial sector and corporate funds. Table 1 shows the change in size of the market between 1998and 2013 and the Compound Annual Growth Rate (CAGR) over that period.
Table 1. Changes in industry assets over last 15 years
Assets June 1998* June 2013 CAGR
Superannuation assets ($b) 360.3 1,617.0 10.5%
GDP ($b) 703.3 1,493.2# 5.1%
Superannuation assets as percentage of GDP 51.2% 108.3%
Industry funds ($b) 32.7 329.7 16.7%
Corporate funds ($b) 63.8 67.8 0.4%
*Sourced from APRA ‘Insights Celebrating 10 years of Superannuation Data Collection Issue 2 2007’. #
ABS Cat. 5206.0 Chain Volume GDP and related measures.
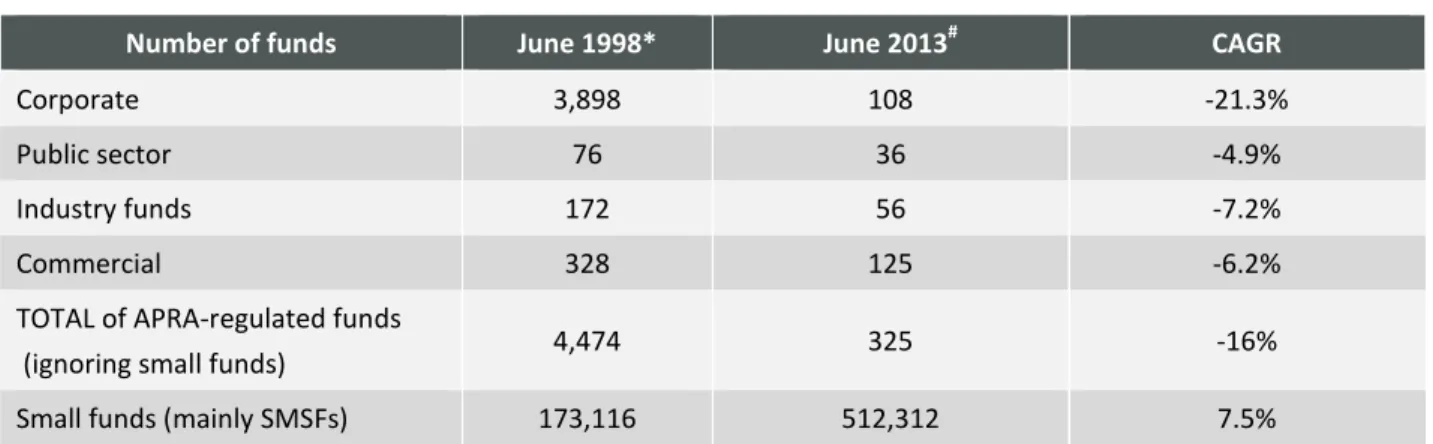
There has been a reduction in the number of superannuation funds in all segments. The trend is particularly apparent in the corporate sector where all but 108 companies have ceased managing their own superannuation arrangements. We expect this trend will continue in future. The current number of funds (apart from APRA small funds) is 325 and we expect this to fall to about 180 in five years. It is conceivable that the number of funds in 30 years will be no more than 20 which implies much larger funds with significantly higher concentrations of risk, assets and membership.
Table 2. Changes in number of funds over last 15 years
Number of funds June 1998* June 2013# CAGR
Corporate 3,898 108 -21.3%
Public sector 76 36 -4.9%
Industry funds 172 56 -7.2%
Commercial 328 125 -6.2%
TOTAL of APRA-regulated funds
(ignoring small funds) 4,474 325 -16%
Small funds (mainly SMSFs) 173,116 512,312 7.5%
*Sourced from APRA ‘Insights Celebrating 10 years of Superannuation Data Collection Issue 2 2007’. #
APRA Quarterly Statistics June 2013 and ATO SMSF Statistics June 2013.
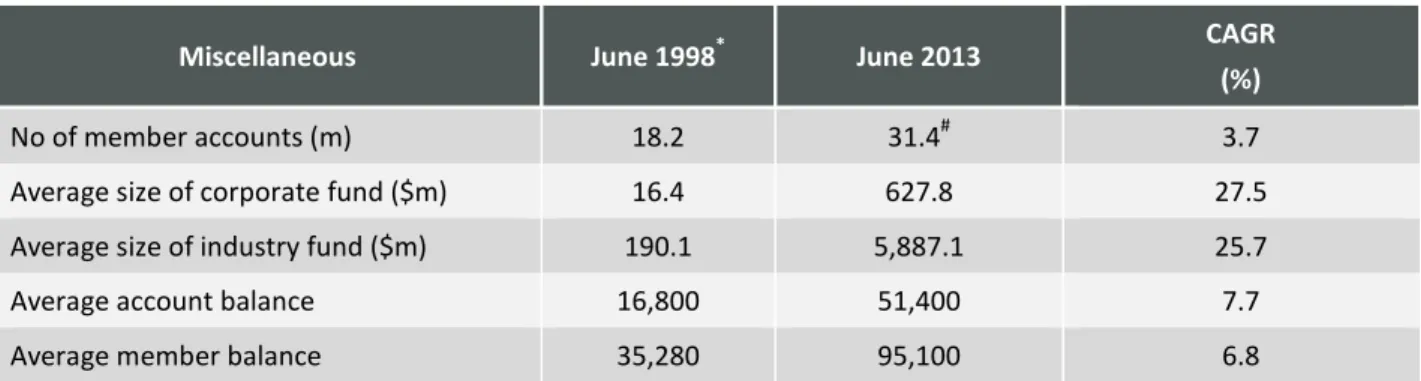
The industry is relatively inefficient with too many accounts – more than two per member. There is much industry commentary on the ‘average account balances’ but this usually ignores the difference
between account balances and member balances (combining all accounts for a member). The size of member accounts is heavily skewed so the median balance is much lower than the mean.
Table 3. Changes in industry assets over 15 years
Miscellaneous June 1998* June 2013 CAGR
(%)
No of member accounts (m) 18.2 31.4# 3.7
Average size of corporate fund ($m) 16.4 627.8 27.5
Average size of industry fund ($m) 190.1 5,887.1 25.7
Average account balance 16,800 51,400 7.7
Average member balance 35,280 95,100 6.8
*Sourced from APRA ‘Insights Celebrating 10 years of Superannuation Data Collection Issue 2 2007’. #
See Appendix D.2 (Demographic Assumptions).
Table 4. Superannuation assets 2003, 2013 (nominal dollars)
Market segment 10 years ago 30 June 2003 Today 30 June 2013 ($M) (%) ($M) (%) Not-for-Profit Funds Corporate Funds 57,539 10.8 67,804 4.2 Industry Funds 56,015 10.5 329,678 20.4
Public Sector Funds 106,769 20.0 245,576 15.2
Not-for-Profit Funds 220,324 41.3 643,058 39.8
Commercial Funds
Employer Master Trusts 45,000 8.4 116,771 7.2
Personal Superannuation 96,836 18.1 182,731 11.3 Commercial Retirement Products* 45,838 8.6 158,632 9.8 Retirement Savings Accounts 3,575 0.7 1,900 0.1
Eligible Rollover Funds 3,721 0.7 5,468 0.3
Unallocated Reserves^ 9,500 1.8 1,407 0.1
Commercial Funds 204,470 38.3 466,910 28.9
Self-Managed Super Funds 109,086 20.4 507,200 31.4
Total superannuation market 533,880 - 1,617,169 -
^ This amount is held within the statutory funds of life insurance companies to back annuities and capital guaranteed business.
3.3
Superannuation products
3.3.1
Accumulation funds
The majority of Australians are in accumulation funds (also called defined contribution funds as the contributions are set as a fixed amount). The retirement outcome is uncertain for these members under these arrangements as they do not receive any guarantees relating to the benefit.
All industry funds and commercial (retail) were set up as accumulation funds, though some are able to manage defined benefit arrangements.
3.3.2
MySuper products
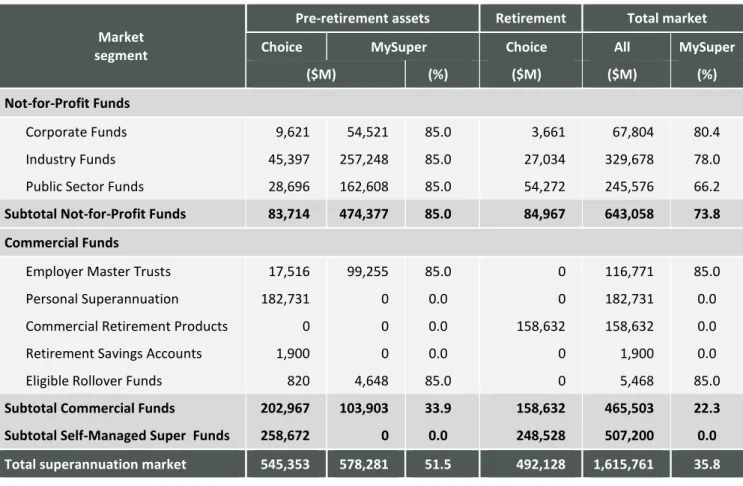
Most member accounts are held in MySuper products which have a standard investment strategy. All these funds offer a choice of investment strategies for members who want to select and option suited to their personal circumstances. We have estimated the assets held in MySuper accounts to be as follows:
Table 5. Estimated MySuper assets at 30 June 2013
Market segment
Pre-retirement assets Retirement Total market
Choice MySuper Choice All MySuper
($M) (%) ($M) ($M) (%)
Not-for-Profit Funds
Corporate Funds 9,621 54,521 85.0 3,661 67,804 80.4
Industry Funds 45,397 257,248 85.0 27,034 329,678 78.0
Public Sector Funds 28,696 162,608 85.0 54,272 245,576 66.2
Subtotal Not-for-Profit Funds 83,714 474,377 85.0 84,967 643,058 73.8
Commercial Funds
Employer Master Trusts 17,516 99,255 85.0 0 116,771 85.0
Personal Superannuation 182,731 0 0.0 0 182,731 0.0
Commercial Retirement Products 0 0 0.0 158,632 158,632 0.0
Retirement Savings Accounts 1,900 0 0.0 0 1,900 0.0
Eligible Rollover Funds 820 4,648 85.0 0 5,468 85.0
Subtotal Commercial Funds 202,967 103,903 33.9 158,632 465,503 22.3
Subtotal Self-Managed Super Funds 258,672 0 0.0 248,528 507,200 0.0
Total superannuation market 545,353 578,281 51.5 492,128 1,615,761 35.8
3.3.3
Defined benefit funds
Defined benefit funds provide a retirement benefit based on a formula, usually linked to salary in the last three to five years of work. These funds can provide a lump sum at retirement or a pension. Both types exist in Australia and some funds offer a choice between a lump sum and a pension.
Most companies and all governments have closed their defined benefits to new members. Only a few remain open, including the Military fund (for defence personnel) which is sponsored by the Federal government and ESSS, the fund for emergency services workers in Victoria.
Whilst they are not a separate segment of the market, legacy defined benefit funds represent a significant amount of superannuation assets. These funds were set up by governments or larger employers so are placed in the Corporate and Public Sector segments.
These funds exist in the Not for Profit and Commercial segments but not in the SMSF segment. Usually they are managed by governments or large corporations.
All the State governments and several large companies (such as Australia Post) have closed defined benefit funds. Most of these will experience negative cash flow now or in the next few years.
As the guarantees are borne by the employer, the members are not concerned about the assets matching the liabilities.
3.3.4
Pension phase
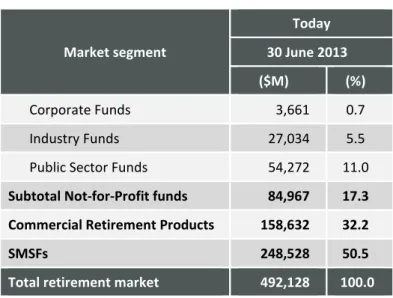
Retirement assets currently account for 30.4% of the superannuation market and we expect this proportion to grow as the baby-boomer generation retires.
Table 6. Total retirement market (2013 dollars)
Note the Public Sector assets would be larger if the PSS, CSS and Military Funds retained their pension accounts within these funds. However, pensions for these funds are paid out of consolidated revenue and are not regulated (or counted) by APRA. Market segment Today 30 June 2013 ($M) (%) Corporate Funds 3,661 0.7 Industry Funds 27,034 5.5
Public Sector Funds 54,272 11.0
Subtotal Not-for-Profit funds 84,967 17.3 Commercial Retirement Products 158,632 32.2
SMSFs 248,528 50.5
4.
Basis of projections
4.1
Background
Every year, Rice Warner analyses the size and composition of the superannuation industry and projects forward assets and membership annually for the next 15 years.
The report focuses on the aggregate level of superannuation assets broken down into:
Assets held on behalf of the pre-retirement population and the retired population. The latter includes Transition to Retirement pensions.
The various market segments where the funds are held, the flow of funds by destination (type of fund) and by source (type of contribution).
Account balances by age and gender for both the pre-retirement and retirement population. All detailed results are expressed in present values (deflated to 2013 dollars) as they provide a more realistic and sensible assessment of future growth. The present values are determined by discounting the future nominal values by 3% per year, the assumed underlying inflation rate.
4.2
Model structure
The projection is based on a demographic model of the Australian population (the Population Model). A Membership Model builds on the Population Model to project the number of accounts into the future, by industry sector, age, gender, account function (primary, secondary and unneeded) and
membership status (active, inactive and retired).
The projected assets are generated by an Assets Model, which projects account balances into the future. The Assets Model relies on the output from the Membership Model and thus, allows for the demographic change within each market segment.
Within each model, the year-to-year changes (e.g. change in membership) are analysed into components (e.g. new entrants and retirements), which are projected separately into the future based on the assumptions. These projections take into account:
past trends and how these are likely to continue in future
interrelationships between components, for example, linking total benefits paid to the number of retirees in the model.
4.2.1
Source of data
The starting point for the projections presented in this report is the superannuation market as at 30 June 2013. The major distribution of assets by market segment was sourced from two reports prepared by APRA (Australian Prudential Regulation Authority):
Annual Superannuation Bulletin, June 2012
Quarterly Superannuation Performance, June 2013.
The APRA statistics are segmented as follows:
small funds (mainly Self-Managed Superannuation Funds)
Employer-Sponsored Superannuation, namely Corporate, Industry and Public Sector Funds, which Rice Warner has collectively named ‘Not-for-Profit Funds’.
The commercial segment (APRA’s Retail category) can be broken into several subcomponents, which has been done based on published data and Rice Warner research. Also, some adjustments have been made to APRA’s breakdown:
Several funds have been reclassified that display characteristics that are more suited to other segments (see Appendix D.1 Classification of funds). The totals have been adjusted for the respective sectors accordingly.
Retirement Savings Account assets and assets managed under the Life Insurance Act (mainly annuity products) in the total for the superannuation industry have been included.
A description of each segment is set out in Appendix A (Glossary).
4.2.2
Population model
The Population Model produces a projection of the Australian population by age and sex, for the following items:
Stock items:
− size of the population
− number employed. Flow items: − deaths − immigrants − emigrants − new labour − retirements
− transfers from employed to unemployed.
The model is based on a projection2 of the Australian population undertaken by the Australian Bureau of Statistics (ABS). The projections have been built as follows:
Estimation of the number of emigrants and immigrants in each year from statistics published by the
Australian Government Department of Immigration and Citizenship.
Projected labour force participation rates published in a report3 by the Australian Government Productivity Commission to derive a projection of the labour force have been used.
The age-by-age pattern in participation rates to estimate and project transfers into and out of the labour force have been considered.
4.2.3
Membership Model
The Membership Model projects the demographic profile of each market segment into the future, segmenting accounts by age, gender, membership status and account function.
Membership status can be active, inactive or retired (as detailed in Table 7) and all accounts are allocated to one of these categories for the purposes of these projections. The allocation of accounts is based on a market survey that Rice Warner conducts each year. The survey covers detailed membership, assets and cash flow information.
Table 7. Membership status
Status Description
Active (A) Active accounts, i.e. accounts which receive regular contributions Inactive (I) Inactive accounts, i.e. accounts which are neither active nor retired Retired (R) Retired members, i.e. fund pensioners
All accounts are also allocated to an account function category, which can be primary, secondary or unneeded (as detailed in Table 8).
Table 8. Account function
Function Description
Primary Primary accounts, i.e. the main superannuation account of each individual
Secondary Secondary accounts, i.e. accounts held in addition to primary accounts, for legitimate reasons Unneeded Unneeded accounts, i.e. accounts held in addition to primary accounts, but which are not needed
and can be consolidated - this includes ‘lost’ accounts
Clearly, all active accounts are primary accounts, but there are also some inactive primary accounts belonging to members who are not currently employed. It is assumed that each person in the employed labour force has an active account and each person of working age has one primary account. There is no differentiation between regular member accounts and spouse accounts.
All model equations operate at an ‘age-gender-function-status’ level. The basic model equation, at each age, gender, function and status, for a particular market segment, is:
Members(t+1) = Members(t) + New Entrants(t) – Deaths(t) + Migrants(t) – Retirements(t) + Transfers(t)4
4
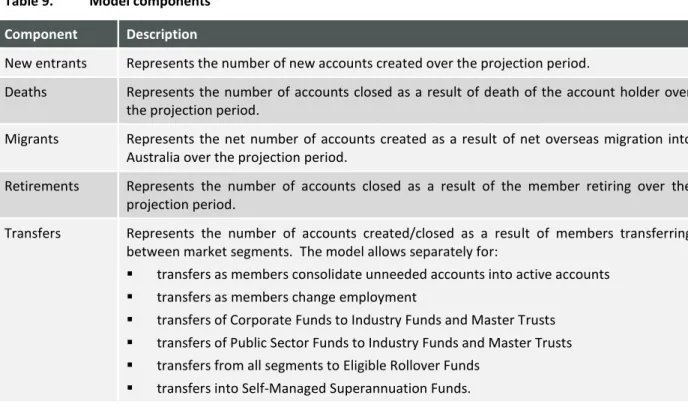
These components are described in Table 9.
Table 9. Model components
Component Description
New entrants Represents the number of new accounts created over the projection period.
Deaths Represents the number of accounts closed as a result of death of the account holder over the projection period.
Migrants Represents the net number of accounts created as a result of net overseas migration into Australia over the projection period.
Retirements Represents the number of accounts closed as a result of the member retiring over the projection period.
Transfers Represents the number of accounts created/closed as a result of members transferring between market segments. The model allows separately for:
transfers as members consolidate unneeded accounts into active accounts transfers as members change employment
transfers of Corporate Funds to Industry Funds and Master Trusts transfers of Public Sector Funds to Industry Funds and Master Trusts transfers from all segments to Eligible Rollover Funds
transfers into Self-Managed Superannuation Funds.
4.2.4
Assets Model
The Assets Model projects the account balances for each market segment and relies on input from the Membership Model. The basic model, for a particular market segment, is:
Assets(t+1) = Assets(t) + Contributions(t) – Fees(t) – Premiums(t) – Benefits(t) + Earnings(t) – Tax(t) + Transfers(t)
These components are described in Table 10.
Table 10. Assets model components
Component Description
Contributions Represents all superannuation contributions (gross of fees and tax) received over the projection period. The projection allows separately for:
pre-tax contributions (such as employer and salary sacrifice contributions) member contributions
Government co-contributions.
Fees Represents all fees/expenses paid over the projection period, including fees deducted from investment earnings.
Premiums Represents life insurance premiums paid over the projection period.
Benefits Represents all benefits paid over the projection period. The model projects separately:
death benefits retirement lump sums
rollovers to retail pension/annuity products at retirement pension benefits.
Earnings Represents the amount of investment income earned over the projection period, gross of fees and tax.
Tax Represents tax paid on contributions received and investment income earned over the projection period.
Transfers Represents transfers of accounts to/from other segments. The model allows separately for:
transfers as members consolidate unneeded accounts into active accounts transfers as members change employment
transfers of Corporate Funds to Industry Funds and Employer Master Trusts transfers of Public Sector Funds to Industry Funds and Employer Master Trusts transfers from all segments to Eligible Rollover Funds
5.
Projected size of superannuation market
5.1
Superannuation relative to GDP
Rice Warner produces an annual report (Superannuation Market Projections) projecting forward assets and membership for 15 years. The latest report used 1 July 2013 as its starting point.
We have extended these projections for an additional 15 years so that they now finish on 30 June 2043. We have then compared our projections with Treasury projections of GDP from the 2010 Intergenerational Report. The results show that superannuation assets are currently over 100% of gross domestic product (GDP); this is projected to grow to over 160% of GDP as the industry matures. In about 2038-39, the industry will mature and drawdowns will begin to outstrip new contributions. We predict that the industry will begin to decline in size relative to GDP.
In Graph 2, Projected GDP has been estimated using smoothed growth rates from Treasury’s 2010 Intergenerational Report and applying these to GDP as at 30 June 2013 as published by the ABS.
Graph 2. 30 year projected superannuation assets as a percentage of GDP (2013 dollars)*
5.2
Projected assets
In Table 11, assets are projected by segment. In practice, the environment will change rapidly over the next decade and we expect the subdivision between funds will also be impacted by new forces. It is likely that we will end up with three key types of fund, namely default funds (MySuper), choice (SMSF’s will be the main type of choice product) and pensions.
Table 11. Summary of projections results (2013 dollars) – 30 years
Market segment
Today In 15 years In 30 years
CAGR^
30 June 2013 30 June 2028 30 June 2043
($M) (%) ($M) (%) ($M) (%) (%
p.a.)
Corporate Funds 67,804 4.2 0 0.0 0 0.0 -100.0
Industry Funds 329,678 20.4 830,713 24.8 1,293,614 25.5 16.2
Public Sector Funds 245,576 15.2 429,842 12.8 632,131 12.5 13.0
Not-for-Profit Funds 643,058 39.8 1,260,555 37.6 1,925,745 38.0 14.1
Commercial Funds 466,910 28.9 1,092,446 32.6 1,886,806 37.3 16.4
Self-Managed Super Funds 507,200 31.4 1,000,177 29.8 1,251,149 24.7 12.7 Total superannuation
market 1,617,169
#
3,353,178 5,063,700 14.5
The total of $1,617,169 at 30 June 2013 comprises $1,123,634 pre-retirement assets and $492,128 of retirement assets. Table 14 shows the progression of assets in pension phase. The detailed year-by-year tables are set out in Appendix A
5.3
Projected number of members
The projected number of pre-retirement accounts is expected to increase marginally over the 30 year period. This is the net effect of school leavers and migrants entering the superannuation system and the baby boomers moving into the retirement phase.
Table 12 and Table 13 summarise the projected number of preretirement members by age and gender. These numbers are based on ABS population forecasts, together with forecasts of population workforce participation. Growth for females is projected to be higher than males (off a lower base).
Table 12. Projected number of pre-retirement members by age – males (’000)
Age group Males 2013 2018 2028 2033 2038 2043 15-19 483 493 533 583 626 656 20-24 825 825 835 898 971 1,034 25-29 926 955 951 961 1,028 1,103 30-34 909 1,008 1,033 1,026 1,036 1,103 35-39 848 969 1,065 1,087 1,079 1,089 40-44 886 891 1,010 1,104 1,125 1,116 45-49 796 908 913 1,031 1,123 1,143 50-54 804 801 911 916 1,033 1,124 55-59 706 728 772 899 904 1,018 60-64 528 487 508 592 695 698 65-69 293 259 252 273 312 361 70-74 66 64 62 66 73 78
Total 8,070 8,388 8,845 9,436 10,005 10,523 Table 13. Projected number of pre-retirement members by age – females (’000)
Age group Females 2013 2018 2028 2033 2038 2043 15-19 484 498 535 586 0 659 20-24 753 797 813 870 941 1,003 25-29 794 880 927 944 1,004 1,077 30-34 746 878 964 1,013 1,031 1,090 35-39 706 798 930 1,018 1,068 1,086 40-44 778 742 834 966 1,055 1,106 45-49 734 798 761 852 985 1,074 50-54 744 741 804 768 859 990 55-59 630 663 657 714 682 766 60-64 415 406 429 425 463 443 65-69 172 161 164 179 178 195 70-74 27 27 29 32 36 36 Total 6,984 7,391 7,848 8,367 8,301 9,526
There are about 31 million superannuation accounts held by the 15 million pre-retirement members and the 2 million pensioners.
5.4
Sensitivity of results
The sensitivity of our 15 year projections results is given in Table 14. Note it is difficult to separate the impact of the SG and voluntary contributions given that mandatory Superannuation Guarantee, salary sacrifice and additional employer contributions are all reported as ‘employer contributions’.
Table 14. Variation in assumptions in 2013 dollars Assumption set Projected assets 30 June 2028 Difference from base projection Difference from base projection ($B) (%) Base projection 3,353 - -
Gross investment return +1% 3,661 308 9.2
Gross investment return -1% 3,076 -278 -8.3
Gross investment return +1% and salary inflation +1% 3,831 478 14.3 Gross investment return -1% and salary inflation -1% 2,931 -422 -12.6
Expense rates +0.25% 3,283 -71 -2.1
Expense rates -0.25% 3,426 72 2.2
Contribution levels + 20% 3,791 438 13.1
6.
Shift from Accumulation to pension phase
6.1
Retirement assets
The retirement assets at 30 June 2013 are $492,128 billion which is about 30.4% of all superannuation assets.
We predict retirement assets will increase to $2,215 billion at 30 June 2043. This would result in the retirement market share of total superannuation fund assets increasing to 43.7% at 30 June 2043. The relative growth in importance for this sector reflects the ageing of Australia’s population and the maturation of the industry. Assets in respect of retired members will grow as the baby boomers retire (and shift to pensions) and following that, most members will retire having had superannuation for their entire working career.
Retirement funds in the Public Sector segment will remain relatively flat in terms of market share. Industry Funds will gain market share as they further develop their pension product offerings.
We expect SMSFs to lose a small amount of market share. This is a reflection of the proportion of SMSF assets that is already in the retirement phase (greater than for any other sector), the significant growth in retirement assets in other segments over the projection period and the deaths of existing SMSF pensioners (who may have large balances).
Further, pension payments and the growth in payments from the SMSF sector are proportionally greater than for other sectors which impacts on the overall market share of assets.
Table 15. Retirement projections results (2013 dollars) – 30 years
^ CAGR – Compound annual growth rate (based on nominal dollars).
Graph 3 shows the projected ratio of accumulation to pension assets over 30 years.
Market segment
Today In 15 years In 30 years
CAGR^
30 June 2013 30 June 2028 30 June 2043
($M) (%) ($M) (%) ($M) (%) (% p.a.)
Corporate Funds 3,661 0.7 0 0.0 0 0.0 -100.0
Industry Funds 27,034 5.5 232,923 17.8 445,215 20.1 27.9
Public Sector Funds 54,272 11.0 139,104 10.6 243,599 11.0 17.3
Not-for-Profit Funds 84,967 17.3 372,027 28.5 688,814 31.1 22.0
Commercial Retirement Products 158,632 32.2 349,373 26.7 707,591 31.9 17.2
Self-Managed Super Funds 248,528 50.5 586,168 44.8 818,596 37.0 9.1
Total retirement market 492,128 1,307,567 2,215,001 14.9
Retirement assets as percentage of all
Graph 3. Ratio of accumulation to pension members over time
6.2
Retirement members
Table 16 and Table 17 show the projected number of retirement members by age and gender. These are members in the pension divisions of funds who have rolled their superannuation benefits into a pension product or annuity. This also includes some members who have transition to retirement accounts (and who may also be shown as pre-retirement members for their accumulation accounts). There is strong growth expected in the number of retirement accounts. It is estimated that the number of accounts will almost double over the coming decade as the baby boomers continue to move into the retirement years.
However, the growth in the number of accounts will not be uniform across all age groups. By 1 July 2024, the preservation age will have increased to 60 and the 55 to 59 age group will comprise a smaller percentage of all retirement members (not everyone in this age group will have a transition to retirement account).
Contrary to population numbers, the current number of female pensioners above age 75 is lower than the number of males. This reflects past superannuation savings practices. Women retiring with small balances tend to take lump sums or spend their pensions in the early years of retirement.
0% 50% 100% 150% 200% 250%
Table 16. Projected number of retirement members by age – males (’000) Age group Males 2013 2018 2028 2033 2038 2043 55 - 59 19 89 58 52 51 59 60 - 64 110 230 318 255 275 270 65 - 69 252 242 350 438 403 448 70 - 74 267 336 348 429 515 501 75 - 79 158 264 347 360 428 510 80 - 84 82 126 215 286 300 360 85 - 89 44 53 85 148 199 211 90+ 18 26 34 53 92 133 Total 950 1,367 1,754 2,021 2,263 2,492
Table 17. Projected number of retirement members by age – females (’000)
Age group Females 2013 2018 2028 2033 2038 2043 55 - 59 38 88 99 114 113 129 60 - 64 188 230 316 331 375 367 65 - 69 344 315 366 455 472 523 70 - 74 254 395 387 429 518 536 75 - 79 105 248 390 386 424 511 80 - 84 29 91 218 345 343 379 85 - 89 14 22 70 168 267 266 90+ 8 10 16 46 116 199 Total 981 1,400 1,862 2,274 2,628 2,909
6.3
Drawdowns
APRA statistics show that drawdowns averaged 7.7% of pension assets at 30 June 2013 (these statistics are unavailable by age). Minimum pension payments vary from 4% - 14% depending on age suggesting that the average pensioner does not draw down significantly more than the minimum required.
7.
Savings outside superannuation
7.1
Background
Rice Warner also analyses the personal investments market in Australia and provides projections of the market for the next 15 years.5 We have not prepared 30 year figures for this report
In its broadest sense, the personal investments market includes all investment assets held by individuals, either directly or through trust or company arrangements. It excludes assets held in superannuation or pension funds. It also excludes assets such as the family home and personal effects. Section 2 (Introduction) provides details of the scope of investments captured within this report.
7.2
The current personal investments market
Table 18 provides a breakdown of the personal investments market at 30 June 2013.
Table 18. Personal investments at 30 June 2013 – look through basis
Cash Term Deposits Australian Equities International Equities Fixed interest and Loans Investment
Property Others Total ($million)
Wrap platforms*
Directly held assets 4,329 4,728 18,283 1,547 0 1,566 0 30,454
Managed Investments 806 264 5,538 3,892 2,737 1,088 1,324 15,649
Sub-total wrap platforms 5,135 4,992 23,821 5,439 2,737 2,654 1,324 46,103
Non-superannuation master trusts# 16,598 2,713 23,327 7,856 8,368 2,671 1,374 62,908
Life investment products 2,092 1,540 3,812 1,966 12,965 936 20 23,332
Directly held by households 769,771 253,040^ 58,300 1,061,564 0 2,142,675
Total Personal Investments 802,842 319,262 82,370 1,067,825 2,718 2,275,017
* Excluding wrap platform business held by SMSFs. #
Including managed investments held on master trust platforms or directly.
^ The amount of directly held equities excludes $292 billion of holdings in private non-financial corporations.
Table 18 demonstrates some key characteristics of the current personal investments market:
46.7% of personal investments are in the form of directly held investment properties.
Directly held cash and term deposits account for 33.8% of personal investments.
Direct investment in equities account for 11.1% of personal investments.
Investment master trusts and wrap platforms account for 4.8% of personal investments, but if directly held investment property is excluded, investment master trusts and wrap platforms account for 9.0% of the remaining market.
Personal investments held on wrap platforms are approximately 42% of total investments within wrap and investment master trusts (up from 38% last year) and 2.0% of overall personal investments (up from 1.4% last year), reflecting its significant growth potential.
5
We have not prepared 30 year projections as it requires a fair amount of work. We could do so within a few weeks if it were required.
Cash and term deposits constitute approximately 22.0% of the assets on wrap platforms, while Australian and international equities constitute approximately 63.5%.
7.3
Market trends and developments
The personal investments market is extremely dynamic with a number of forces interacting to drive its development both in the short and long term. These include:
Short term:
- Investor sentiment is recovering from the focus on investment risk in the aftermath of the GFC, and the United States and European debt crises.
- The Future of Financial Advice (FoFA) changes.
- The impact of reduced concessional contributions caps on superannuation contributions and the expected increase in the superannuation guarantee from 9% to 12%.
- Stimulus measures applied by various central banks holding interest rates at close to zero.
Longer term:
- Demographic changes including the shift of the ageing baby boomers into retirement followed by large generational transfers of wealth on their death.
- Increasing financial knowledge and sophistication of investors that has supported the development of more sophisticated investment products.
- Changes in the distribution of investment products, including accountants moving into financial planning and direct distribution leveraging online advice and associated planning tools.
- Technological developments and platform evolution, improving accessability and lowering costs, also leading to the development of tax optimisation services.
- The growth of Exchange Traded Funds (ETFs) and Managed Discretionary Accounts (MDAs) and innovative new investment products in the area of infrastructure bonds, corporate debt and hedge funds.
- Changes to international tax treaties affecting issues such as overseas withholding tax and the development of the ‘Asian Region Funds Passport’.
7.4
Market projections
Table 19 shows the projected breakdown of personal investments by platform at five yearly intervals to 30 June 2028.
Table 19. Personal investments by platform over the 15 years to 30June 2028 – in 2013 dollars
2013 2018 2023 2028 Annual
growth rate ($million)
Wrap platforms*
Wrap platform directly held assets 30,454 81,862 156,650 259,374 15.4% Wrap platform managed investments 15,649 32,126 55,423 86,840 12.1%
Sub-total wrap platforms 46,103 113,988 212,073 346,214 14.4%
Non-superannuation master trusts# 62,908 71,770 78,052 80,978 1.7%
Life investment products 23,332 27,333 30,752 33,375 2.4%
Directly held by households 2,142,675 2,740,099 3,404,165 4,139,363 4.5%
Total personal investments 2,275,017 2,953,190 3,725,042 4,599,930 4.8%
* Excluding wrap platform business held by SMSFs.
#
Including managed investments held on master trust platforms or directly.
Table 20 shows a breakdown of the projected personal investment market at 30 June 2028 by type of platform (including direct investment) and asset class.
Table 20. Personal investments at 30 June 2028 – look through basis, in 2013 dollars
Cash Term Deposits Australian Equities International Equities Fixed interest and Loans Investment
Property Others Total ($million)
Wrap platforms*
Directly held assets 30,994 33,848 80,038 89,271 13,800 11,423 0 259,374
Managed Investments 2,710 889 19,748 24,968 21,342 3,804 13,379 86,840
Sub-total wrap platforms 33,704 34,737 99,786 114,239 35,142 15,226 13,379 346,214
Non-superannuation master trusts#
5,170 845 40,271 12,437 11,589 1,188 9,477 80,978
Life investment products 1,007 742 7,085 3,664 20,158 576 143 33,375
Directly held by households 1,303,774 711,502 163,108 1,960,979 0 4,139,363
Total Personal Investments 1,379,979 988,984 229,996 1,977,970 23,000 4,599,930
* Excluding wrap platform business held by SMSFs. #
Graph 4 shows the projected breakdown of personal investments by platform, excluding investments held by households directly6.
Graph 4. Personal investments by platform over the 15 years to 30 June 2028 – in 2013 dollars
7.5
Commentary on personal investments
The projections of the personal investments market assume growth in line with projected net household savings, reflecting our views on the impact of the forces driving change as discussed previously. Specifically, we make the following assumptions:
A decrease in cash and term deposits directly held by households, reflecting the anticipated reversion of investor sentiment, while cash and term deposits held on wrap platforms will increase due to the expansion of wrap platforms. The net effect is that by 30 June 2028, total cash and term deposits will reduce from 35% to 30%, as a proportion of overall personal investments.
The market share of assets held on wrap and similar platforms at 30 June 2028 will be 5.5% higher compared to its current level. Of this, 4.3% will be due to higher volumes of directly held assets (including ETFs) and 1.2% due to higher volumes of managed investments, driven by innovative new products and the improvements of transaction and settlement services.
Of the overall 5.5% higher market share, 3.4% will be due to increased equity holdings, 1.0% will be due to increased cash and term deposit holdings and 1.0% due to increased holdings in fixed interest, property security and other investments.
Equities directly held by households and on wrap platforms will increase as the cost of trading and administering such investments reduces, while products such as ETFs continue to increase in popularity. As a result, by 30 June 2028, total equity holdings (including ETFs) will increase from 14.0% to 21.5% of overall personal investments.
We have assumed that two-thirds of this increase will be related to an increase in international equity holdings, due to better accessibility and lower costs.
The level of fixed interest security holdings will return to its historical average, increasing from 3.6% to 5.0% of personal investments. Fixed interest securities held on wrap platforms will increase by 0.6% of personal investments. These changes will be driven by deregulation of the
capital for Australian banks under the Basel III changes7 and a growing appetite for debt finance amongst Australian corporations more broadly.
Non-superannuation master trusts and life investment products will decline as wrap platforms take over. As a result, by 30 June 2028, the market share of these products will be 1.0% and 0.3% lower respectively compared to their current levels.
Directly held property as a proportion of overall personal investments will reduce by 4.0%. Growth will occur due to superannuation becoming relatively less attractive for high income earners and lower interest rates in the short to medium term. However, this will be somewhat offset by investors gearing property less and yields being under pressure due to property prices and costs rising faster than rents.
We estimate the share of alternative investments will grow from 0.1% to 0.5% of the market. All growth is expected to occur within managed portfolios.
Whilst any set of projections can only reflect the veracity of the inputs, these assumptions represent Rice Warner’s considered view regarding the potential development of the personal investments market.
7.6
Note on investment properties
ABS Household Wealth Distribution 2009/20108, showing the net9 value for investment properties of $99,700 averaged across all Australian households10. While the total value of properties is $136,400, the outstanding mortgage on these properties is 26.8% of the value of the property on average.
APRA monthly bank statistics report the value of current outstanding loans to households for investment properties to be $389,311 million as at June 2013.
Based on the data above, the estimated total net value of investment properties at 30 June 2013 is $1,061,564 (equal to 389,311 / 26.8% - 389,311).
7 Lower capital charge for retail deposits relative to wholesale deposits for banks. 8
65540DO001_200910 Household Wealth and Wealth Distribution, Australia, 2009–10. 9
Net of mortgage debt. 10
The ABS December 2011 release of Australian Social Trends (4102.0 - Australian Social Trends, Dec 2011) indicated that, in 2009-2010, 21.0% of households owned property other than their own home, when averaged across all Australian households.
8.
Asset allocation of superannuation funds
8.1
Expected earnings by segment
Australian superannuation funds, using the guidance of expert asset consultants, take into account a number of factors when building a portfolio of investments for the fund’s default strategy (MySuper). These include:
The expected returns of each asset class
The volatility of each asset class
Correlations between asset classes in market downturns
The reduced volatility from building a diversified portfolio
The value of franking credits on Australian listed equities
The cash flow of the fund (which impacts on the level of unlisted assets which are illiquid)
The desire to invest internationally to share in global growth
We have compiled the expected outcomes over ten years by combining the views of several fund managers and asset consultants. These results partly indicate why Australian funds have high levels of growth assets and little fixed interest investments.
Table 21. Average annual investment earnings assumptions (10 year period)
Asset Class (%)
Australian Shares
(gross of imputation credits) 8.8 International Shares 8.5
Listed Property 8.2
Direct Property 7.9
Australian Fixed Interest 5.4 International Fixed Interest 5.1
8.2
Allocation by segment
The asset allocation for the industry is given in Table 21. The figures were derived from allocations published in the APRA Superannuation Bulletin, June 2012 and the ATO Self-Managed Super Fund Statistics, June 2013.
Table 22. Asset allocation by sector – 30 June 2013
Sector Australian Equities International Equities Listed Property Direct Property Australian Fixed interest International Fixed Interest Cash Other (%) Corporate Funds 31.0 27.0 2.0 7.0 12.0 5.0 8.0 8.0 Industry Funds 30.0 22.0 1.0 10.0 7.0 5.0 5.0 19.0 Public Sector Funds 24.0 24.0 3.0 7.0 7.0 6.0 12.0 17.0 Self-Managed Super Funds 49.1 0.8 7.6 7.6 1.4 0.0 30.5 3.1 Employer Master Trusts 27.0 22.0 4.0 3.0 14.0 6.0 14.0 10.0 Personal Superannuation 27.0 22.0 4.0 3.0 14.0 6.0 14.0 10.0 Commercial Retirement Products 24.1 19.6 3.6 2.7 15.9 6.8 15.9 11.4 Retirement Savings Accounts 0.0 0.0 0.0 0.0 0.0 0.0 100.0 0.0 Eligible Rollover Funds 27.0 22.0 4.0 3.0 14.0 6.0 14.0 10.0
Note: ‘Cash’ includes bank term deposits; ‘Other’ includes infrastructure
The typical default option for an APRA regulated superannuation fund follows a 70/30 growth to defensive asset allocation. With the introduction of MySuper, many funds have had the opportunity to rethink their asset allocation. In particular, many commercial providers have introduced lifecycle options which reduce the member’s exposure to growth assets as they age.
The SMSF sector has a vastly different asset allocation to the rest of the industry, with close to half of the assets in Australian equities and almost a third of assets in cash (which is largely term deposits with banks). This reflects the fact that:
SMSF investors have a preference for domestic assets
SMSF investors have a preference for listed investments (with the exception of investment properties in a small number of funds)
As half of the SMSF market is in the pension phase, there is a high allocation to cash and term deposits. This reflects the conservatism of many retirees.
There is also a noticeable difference between Industry funds and Commercial funds in their allocations to illiquid assets. Industry Funds with their positions as default funds under awards have more security of cash flow and are less exposed to member and employer switching. They can therefore hold higher proportions of Direct Property and infrastructure (included in ‘Other’ assets in Table 22).
We can also observe that members receiving pensions in other sectors of the market tend to have a more conservative asset allocation than those building up their assets. This reflects the members’ need for liquidity and capital preservation. Portfolios tend to follow a more balanced (50/50) or capital stable (30/70) approach.
8.3
Allocation of pension assets
Rice Warner does not hold aggregate statistics on the asset allocation of pension assets across the entire industry. The approach to default investments varies for account based pensions and some funds do not offer a default but force members to choose an investment option on opening the product. For those funds that do operate a default, the default option is usually one of either:
The default accumulation option
A defensive 30/70 ‘capital stable’ option, or
100% cash.
Some Mysuper products have decreasing levels of growth assets over the later years of retirement. We expect that overall the asset allocation of pensions is likely to be a balanced 50/50 type portfolio. With the introduction of life-stage investment options by many funds, we expect that the allocation to growth assets will fall over time.
8.4
Overseas assets
APRA and ATO statistics show that roughly 25% of assets are currently invested overseas. Our projections assume that the current allocation does not change over time for each segment as given in Table 22. As the industry grows it is possible that allocations to overseas investments may be driven higher due to reduced capacity in the Australian market for funds to invest the assets.
9.
Impact of change
9.1
Key outcomes
The ageing of the population, the concurrent maturation of the superannuation market and the structural changes within that market will produce significant systemic changes in the volume of capital and its allocation. The key changes that can be expected over the next thirty years are:
The assets within the superannuation industry will grow significantly in real terms from about $1.6 trillion at June 2013 to more than $5 trillion in 30 years.
This asset base will also grow as a proportion of GDP from 108% in 2013 and will stabilise at around 160% of GDP in 30 years.
This stabilisation will reflect the maturation of the market with some 44% of assets being held in the pension phase at that stage.
The average age of pensioners will rise.
There will be a small number of large funds. It is difficult to predict the exact number, but if 10 funds had 60% of the assets, they would average $300 billion each.
The SMSF sector will lose its share of the overall market as it moves increasingly to supporting members in the pension phase.
9.2
Impacts
These changes can be expected to have the following impacts:
The maturation of the market will see net real cash flows move towards neutrality as pension drawdowns compensate for contribution inflows. Asset growth will trend to reflect population and economic growth and inflation.
The much larger proportion of assets held in the pension phase due to this maturation will also be reflected in aggregate asset allocations across the market because of the need by pensioners for greater capital value security. This need for stability will also impact the choices of products by pensioners which will in turn impact aggregate asset allocations. Changes that can be expected include:
- An increase in the proportion of total assets held in defensive asset categories like government and corporate bonds. The extent of this change will also be dependent on the depth of the markets in these assets.
The depth of these markets will depend on factors outside the superannuation market. The demand for government debt has historically been low because of low government borrowing requirements. With higher and more sustained deficits, there will be a larger and deeper market.
The corporate bond market has suffered from low overseas interest rates and relatively high deposit rates from banks to support their domestic lending. Borrowers have found overseas markets cheaper and deeper while lenders have found bank deposits more attractive. A rise in overseas interest rates relative to Australia would improve the local bond market and tap into ready demand.