Nikita Bourque
Anne Elise Parmentier CELT Research Paper
Active Well-Rounded Students and GPA
Students in a college community have a plethora of opportunities at their fingertips. Between clubs, sports, internships, college events and sorority/fraternity groups, students can be involved in almost anything and everything. It has become a new standard to be “well-rounded” expressing your interest and involvement in a variety of outlets. But when is being a well round high achieving individual just too much and when do the positive effects of this active life style turn to have negative effects?
As outlined by Astin (1984), student involvement “refers to the amount of physical and psychological energy that students devote to the academic experience.” Astin (1984) further defined that the Student Involvement Theory is student involvement in the form of academic work, participation in extracurricular activities and interaction with faculty and staff. This involvement can be measured quantitatively by asking students how much time they allocate to each section of involvement.
It’s when a student first enters college as a freshman that they must make the transition to the sometimes overwhelming and independent fast-paced life style of a college student. To feel anchored in the community students not only join classes, but also clubs, student
government, and sports teams. These social opportunities introduce the individual to other students from different class years and can also act as a way to reduce stress related to the rigors of college academics. As laid out by Clark (2005), obstacles that freshman college students have to overcome range from forming new social networks, changing study habits, and learning to be self-sufficient. All of these components affect the student’s ability in becoming acclimated to the
college community and achieving academic success.
In order to make good grades a student has to consider many factors. As explained by O’Hara (2005), a student must first plan for academic success by planning their class schedule wisely and allocating class preparation time and study time. When enrolled in a course, the students must understand the professor’s expectations and actively stay on top of course work. As explained by Humphreys and Davenport (2005), students understand the importance of holding a college degree and realize that this degree comes with hard work and dedication to their course load. College is a venue where students must learn to budget time, gain strong work habits, hone team work skills, and learn self-disciple (Humphreys and Davenport 2005). Along with these skills students can also improve their leadership skills, communication skills and develop as a person who is then ready to enter the working world.
Many studies have found that a student’s study time alone is not an accurate indicator of GPA. Rau and Durand (2002) found that students who were committed to studying, identified by a variable “Academic Ethic” was a better predictor of grades than simply hours spent studying. A study at Illinois State University found that only students who studied upwards of 14 hours a week saw a positive impact on GPA. At ISU the average student reported studying 8 hours a week. In comparison, Students at the University of Michigan study 25 hours per week. We hypothesize that the university of Rochester will be more similar to the University of Michigan in this way. Plant (2005) takes this argument of “academic ethic” a step further, researching a model of deliberate practice in studying. In this model studying is learned and should be practiced in the way a musical instrument or a sport is. If this model is correct, some extracurricular activates could provide the basis to learn these practice methods.
background characteristics such as socioeconomic background and prior educational success, structural characteristics of the institution, interaction with faculty staff and peer members, the learning environment, and student engagement. Student engagement is represented by the time and effort that students devote to educationally purposeful activities and was specifically measure by the three variables, time spent studying, time spent in co-curricular activities, and combined measure of engagement in educational practices such as study groups or workshops. Kuh used an ordinary least squares regression to analyze the effects of a student’s background, high school academic achievement and extra curricular involvement on the students’ first year GPA. Kuh found that the variables of student engagement in the model accounts for
approximately 13% of the variation in first year GPA, and when combined with variable of demographics and pre-college experiences, 42% of the variance in GPA is explained. They found that an increase of one-standard deviation in student engagement during the first year of college increased GPA by about .04 points. Since GPA is measured on a four point scale this is significant. In our research we hope to observe a correlation between GPA and being a “well-rounded student.”
Methods
We defined well-rounded, as a student who participates in a variety of extracurricular activities, is a campus leader or works during the school year- similar to Kuh’s definition of engagement. A student could exhibit any or all of these traits. After discussing a similar problem with the econometrics professor, Carol Catiano, we developed a survey to measure factors that could influence GPA. We surveyed a random sample of students by surveying our workshops, as well as distributing the survey to a variety of people on campus. An online survey method will allowed us to distribute our questionnaire though social-networking sites such as Facebook. This
ensured that the sample was not biased by either economics or chemistry majors, and allowed us to survey a large enough sample to adequately reduce the variance.
In our survey we measured the following variables, class-year, SAT scores, major, minor(s), average credit hours, sleep, study, work, and extra curricular activities, leadership, and GPA, our dependant variable. We are splitting up extra curricular activities into sub-variables of sports, clubs, and Greek organizations. Through our research we found that high-school success was one of the largest determinants of college success. We included the variable SAT score to control for this. We included class year because we believe that it is correlated with both extra curricular activities and GPA. Freshmen may be involved in different numbers of organizations than upperclassmen for example, first-semester freshmen will not be involved in Greek life. Seniors may hold more leadership roles or spend more time in their respective organizations. The effect of a student’s major and minor(s) is important to measure since it is correlated with the difficulty of the classes, how much students study and their final grades. A variable about the number of credit hours was included for a similar reason, we expected it to have a positive correlation with study hours and also have an effect on GPA. The variable sleep is one way to measure the health of a student, and therefore has an effect on GPA. Also a student who sleeps less is probably putting more time into studying or extra-curricular activities, however these are not the only things they could be doing with their time so we don’t have a problem with co-linearity. Work similarly effects GPA and extracurricular activities.
After measuring these variables through the survey we plan to run a robust ordinary least squares regression of the all the independent variables on GPA, and just extra-curricular
activities on GPA. In this way we hope to disentangle the effect of extra-curricular activities on GPA from the effect of the other measured variables on GPA. We have tried to control for a
broad spectrum of variables that influence GPA, however we can still expect error. Many
variables affecting GPA cannot be measured through a survey, and if we were to measure all the variables that can our survey would be so long that we would not get a random selection of participants.
We hope to observe a statistically significant impact of extracurricular activities on college GPA. Most students on campus are involved in at least one extracurricular, and many are leaders in their organizations. Being involved in extracurricular activities can build skills that can be applied to studying and coursework for example, time management skills and
communication skills. A student who participates in extra curricular activities and/or works in addition to course work is considered more “well-rounded.” Through our research we hope to find that a student who is more “well-rounded” is more successful and has a higher GPA.
Survey What is your class year?
What is your major? What is your overall GPA? What was your SAT score?
How many credit hours are you taking this semester? Average number of credit hours in past semesters? How many hours on average do you sleep per day? How many hours on average do you study per week? --
Do you work? y/n
Can you study while at work? y/n --
Do you play any sports? y/n How many?
How many hours on average do you spend practicing? --
Are you involved in extracurricular Activities? y/n How many?
Greek Life? y/n
How many hours do you spend on extracurriculars per week? How many nights a week do you party/drink?
Results
This pie chart depicts the percentage of students reporting GPA’s in the indicated ranges. From this chart we can see that no participants had a GPA below 2.0, and the majority of the students participants reported a GPA of between 3.6 and 3.8.
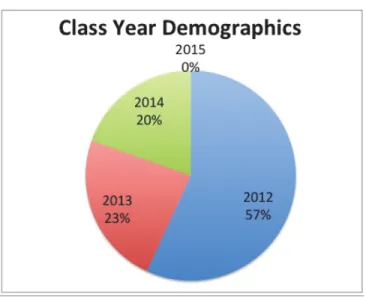
Figure 2: Class Year Demographics
This pie chart depicts the class year of our participants. Most participants were seniors, because we distributed our survey via Facebook and we are both seniors. No participants were freshmen, but they couldn’t have participated anyway as they have no official grades yet.
This pie chart illustrates how the four different major subject areas were divided among our sample population. Sixteen percent were engineering student, twenty-eight percent were social science, sixteen percent were humanities and the last 40 percent were representative of students studying the natural sciences. It is not at all surprising that the largest portion were natural science majors since the U of R is advertised and prides itself on being a research-based university.
Figure 4: Percentage of Participants Involved in Work, Sports, Extra-curricular Activities, and Greek Life
Out of the total population that we surveyed 61 percent hold a job position, 37 percent are athletes, 49 percent are involved with Greek life on campus, and 90 percent are involved in extracurricular activities. Extracurricular activities include clubs, campus groups, student government, and Greek organizations. Involvement in Greek life was assessed separately because we were curious as to how large of a percent of our population is associated with a sorority and fraternity. Although we have a relatively small school, many students become involved with sorority and fraternity affairs at some point in their college carrier.
Data Analysis
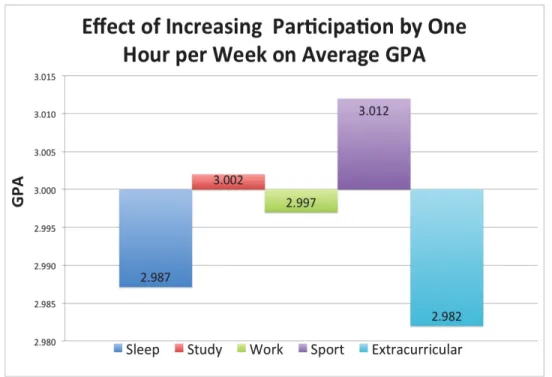
Figure 5: Effect of Increasing Participation By One Hour Per Week on Average GPA
Effect of increasing participation by one hour on average GPA: This chart illustrates the effect of increasing participation in the specified activity by one hour and the expected effect that would have on the average GPA of 3.00. Based on our multi-variant regression we found that the ceteris paribus effect of participating in extracurricular activities was -0.018, sports was +0.012, work was -0.003, study +0.002 and sleep was -0.013. We found participation in extracurricular activities to have the greatest negative effect on GPA.
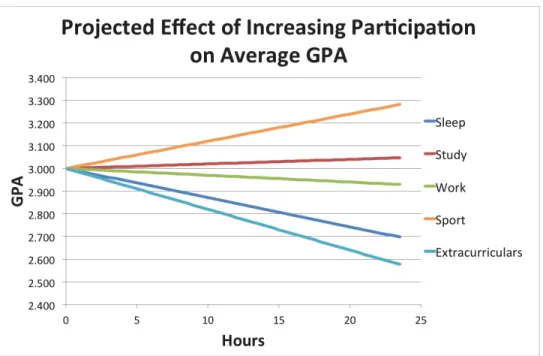
Figure 6: Projected Effect of Increasing Participation on Average GPA
This chart shows the projected effect of adding up to 25 hours of each activity per week. That is spending 25 hours more in a club organization would decrease GPA significantly if there was no change in time spent in other areas. This illustrates the how large the negative effect of extra curricular activities is.
Discussion
Multivariate regression techniques explained 40% of variation in GPA. Holding all other factors equal, Extracurricular has the largest effect on GPA. Increasing extracurricular activity by one hour causes GPA to decrease by .018. Since GPA is measured on a 4.00 scale, a change of .018 is a fairly significant difference. Holding all other factors equal, increasing sports by one hour causes GPA to increase by .012. We believe sports have a positive effect due to the GPA requirement for varsity players. Varsity track athletes also have to budget their time wisely and typically study with team members since they are on the same schedule. When on a varsity sport you are in contact with students from all four class years - this can promote academic success since it allows under classmen to ask upper classmen for help or suggestions about classes they
may have taken. Working has a negative effect; increasing work by one hour decreases GPA by .003. This effect is much less significant. None of our results were statistically significant, a larger sample pool, and a more random sample may lead to stronger conclusions. To improve upon this research, a larger population should be used. A larger pool of data may lead to stronger correlations and more conclusive data.
Although extracurricular involvement has a slight negative effect on GPA the effect is minimal and the other positive results of being involved must also be considered. Its through extracurricular activities that a student can meet and work with upper and lower classmen, be involved in larger group projects, or participate in something simply for the sake of enjoyment and building a hobby. At the U of R there is an incredible array of clubs, sports, and other student groups that students can become involved with. It is both the academic and the social aspects of being a college student that fulfill the true college experience prepping students to be leaders in the community after graduation.
Works Cited !"#$%&'!()*+%,)-'./'01#2,)%#'3%45(4)6)%#7'!'8)4)(596)%#+(':;)5-<'=5-'>$?;)-'@,2A+#$5%/0' !"#$%&'(")(*"''+,+(-.#/+%.(0+1+'"23+%.'BC'DEFFFG7'HEIJKF/'L-$%#/' ' ' M(+-N&'O+-A$+'P5)/'0Q)?5#$+#$%?'#;)'R-)";6+%'S)+-7'M;+(()%?)"'+%,'1#-+#)?$)"'''''''''!65%?' R$-"#JS)+-'M5(()?)'1#2,)%#"/0'!"#$%&'(")(*"''+,+(-.#/+%.(0+1+'"23+%.'BT/U'DKCCHG7' KFTJUET/'L-$%#/' ' V)5-?)'8/'W2;&':<'O/'M-2A)&'P$AN'1;529&'X$(($+%'W$%Y$)&'+%,'P5Z)-#'O/'V5%<)+/'0[%6+"N$%?' #;)'@==)A#"'5='1#2,)%#'@%?+?)6)%#'5%'R$-"#JS)+-'M5(()?)'V-+,)"'+%,'L)-"$"#)%A)/0' 45+(!"#$%&'(")(67,5+$(8/#9&.7"%'\F/H'DKCCIG7'HBCJTU/'L-$%#/' ' >269;-)<"&'8)Z-+&'+%,'!Z$?+$('8+4)%95-#/':7;+$&'(8/#9&.7"%(&%/(<3+$79&=>(?$"37>+/' !""5A$+#$5%'5='!6)-$A+%'M5(()?)"'+%,'[%$4)-"$#$)"&'KCCH7'UTJBU/'L-$%#/' ' ' L(+%#&'@/&'W/'@-$A""5%&']/'>$((&'+%,'W/'!"Z)-?/'0.;<'1#2,<':$6)'85)"'Q5#'L-),$A#'V-+,)'L5$%#' !4)-+?)'+A-5""'M5(()?)'1#2,)%#"7'369($A+#$5%"'5='8)($Z)-+#)'L-+A#$A)'=5-'!A+,)6$A' L)-=5-6+%A)/0'*"%.+32"$&$@(8/#9&.7"%&'(?>@95"'",@'UC/E'DKCCHG7'FTJEET/'L-$%#/' '