PUBLIC HEALTH RESEARCH UNIT
BED OCCUPANCY AND BED MANAGEMENT
Report of CSO Project K/OPR/2/2/D248
Heather Baillie, William Wright, Alice McLeod, Neil Craig
1,
Alastair Leyland, Neil Drummond, Andrew Boddy
October 1997
BED OCCUPANCY AND BED MANAGEMENT
Report of CSO Project K/OPR/2/2/D248
CONTENTS
Page
Executive Summary
i
I:
Introduction – the methods of the project
1
II:
Daily Variations in Bed Occupancy
5
III:
The Effects of Case-mix
22
IV:
Survival Analysis – influences on length of hospital stay
29
V:
An Econometric Analysis of Bed Occupancy and Costs
40
VI:
Procedures for Managing Beds
66
VII:
Synthesis: relationships between the parts of the project
91
VIII:
Conclusion
100
Appendices
A:
Multilevel Modelling in the Econometric Analysis
B:
Survival Analysis for Chronic Obstructive Airways
Disease
C:
Relative Risk Estimates and Confidence Intervals for the
Survival Analyses
D:
Interview Schedules
E:
List of Respondents
I: INTRODUCTION
Background to the project
1.1 This project was commissioned by the Chief Scientist’s Office on behalf of the Management Executive
as a part of a strategy to inform purchasing and provision for acute admissions. An observed increase in emergency admissions of over 42% in the 12 year period from 1981 to 1993 in Scottish hospitals was apparent in all age groups and was not explained by demographic change. Emergency admissions were not the only group of patients to experience such an increase in activity; elective admissions increased by approximately 11% between 1981 and 1988 but have remained more or less stable since, whilst day cases expanded fourfold. Patients aged 65 and over have accounted for nearly half of the increase in emergency admissions; however, it is also the case that elective admissions have been rising in this age group. Emergency admissions have remained the focus of research because of their lack of predictability and the way in which they affect the planning of elective admissions and complicate the contracting process.
1.2 A simple review of bed occupancy rates by specialty in Scottish hospitals suggests that those with high occupancies are “main-stream” specialties such as medicine or general surgery, which have a high proportion of emergency admissions in their case-mix. Specialties with a higher proportion of elective admissions (such as gynaecology, ophthalmology or ENT) tend to have lower occupancy rates. This is, of course, an over-simplification because the elective/emergency ratio is a rather crude reflection of other differences in the work of particular specialties. These differences include the numbers of available beds, the influence of relatively short lengths of stay (and their possible effect on turnover intervals), and other constraints including the availability of operating theatre resources. It is in particular noticeable that the three specialties mentioned with a high proportion of elective admissions tend to have relatively short lengths of stay (compared to general medicine) which may explain part of the differences in occupancy rates, both because of the higher proportional impact of the turnover interval and because of the increased difficulties in scheduling admissions to maintain high levels of bed occupancy. These are also specialties which have seen rapid growth in the proportion of day cases over recent years. It is therefore possible that the low occupancy rates currently being observed are, in part at least, a temporary problem since it may take time to reduce bed capacity in these specialties in line with the reduction in inpatient activity. However, the situation must be more complex than this, since the decreases in length of stay and inpatient numbers have not been accompanied by any real change in occupancy rates.
1.3 It is, however, reasonable to assume that patient scheduling and patient management may differ in response to the emergency/elective admission ratio of specialties. Table 1.1 indicates pronounced differences between the occupancy ratios and proportions of emergency admissions for different specialty groups, with an association between the two measures. The activities undertaken by hospitals may also influence these measures; table 1.2 suggests that the proportion of emergency admissions in medical specialties in the major teaching hospitals is lower than in other general hospitals, but their occupancy rates remain high.
Specialty Group % occupancy ratio % emergency ratio
Medical* 82.7% 60.3%
Low occupancy group** 57.1% 15.8%
*General Medicine, Cardiology, Metabolic Disease, Neurology, Gastroenterology **ENT Surgery, Ophthalmology, Gynaecology
Table 1.1: Average occupancy ratio and proportion of emergency admissions by specialty type, Scotland 1993.
Hospital Type Specialty Group % occupancy ratio % emergency ratio
Large general major teaching hospital
Medical*
Low occupancy group**
85.3% 61.3% 51.6% 17.4% General hospital (some teaching) Medical*
Low occupancy group**
83.4% 57.5%
66.4% 15.5% *General Medicine, Cardiology, Metabolic Disease, Neurology, Gastroenterology **ENT Surgery, Ophthalmology, Gynaecology
Table 1.2 Average occupancy ratio and proportion of emergency admissions by specialty and hospital type, Scotland 1993.
1.4 The average rate of bed occupancy for Scottish hospitals may compound several different influences:
bed occupancy is likely to vary according to the specialty-mix of a hospital’s beds and thus the activities it undertakes. Bed occupancy may also vary as a consequence of case-mix within specialties and may be influenced by different management practices and their application in different specialties. Variation may also derive from different social and demographic characteristics in the populations for whom individual hospitals provide care.
1.5 Specialty is important because the activities undertaken differ in ways which influence the use of beds
and the scheduling of other activities (such as surgical procedures). Diagnostic case-mix within specialties and, for example, the relative proportions of elective and emergency admissions are influential because of their effects on other measures of activity (such as length of stay and throughput) and constrain at least some of the available options for bed management. The management of hospital care raises important issues at different levels and in different ways. They include larger-scale issues such as the organisation and deployment of overall bed provision within a hospital, different ways of progressing patients between areas of the hospital which provide for differing levels of, for example, nursing dependency, and the effective integration of bed use with other aspects of hospital care such as the use of investigative facilities and the scheduling of operating theatres. The competence of hospital information systems for the ongoing monitoring of performance and feedback to operational policies forms part of this management environment. In a more local context (and depending on specialty) the effectiveness of bed use is influenced by waiting list management, forward planning for the discharge of patients, and the quality of collaboration between different specialties over such matters as the transfer of patients from one to another. The architecture of a hospital and the availability of options for deploying its resources in more flexible ways may be important constraints on the efficiency of its activities.
1.6 The social and demographic characteristics of the patients (and populations) for whom a hospital
provides care influence bed occupancy in both direct and indirect ways. Examples of direct influences are that older patients are likely to have longer lengths of stay and that patients from socio-economically deprived backgrounds may be more ill and require more care. Both are likely to influence throughput and thus bed occupancy. The social, demographic and geographic context of a hospital will influence its options for earlier discharge in terms of the availability of alternative care and the uses it makes of its beds. Finally,
there is some evidence that the practice of Scottish hospitals varies in a more diffuse way as a response to the needs of the populations they serve and that these effects will influence the ways in which beds are used. Aims
1.7 Estimates of future needs for acute beds and care provision assume the efficient use of beds for all acute
admissions. Although some of the variation in occupancy rates between acute specialties and between hospitals may be explained by, for example, differences in demand, the mix of emergency and elective cases, length of stay and hospital or specialty size, some of the variation may reflect differences in efficiency. This report was therefore commissioned to explore the extent of and reasons for differences in the efficiency of bed use. More specifically, the research sought to examine:
•who takes responsibility for efficient bed use
•whether and how hospital/specialty targets for bed use are set
•what in-hospital statistics are used to monitor and review bed use
•perception and evidence of day-to-day and seasonal stresses
•arrangements made for flexible use of beds (including the concept of “bed ownership”)
•whether discharge policies contribute to efficiency
•the degree and causes of variations in bed occupancy.
1.8 The intentions of the research team were to identify good management practices which support efficient
bed use and to use detailed statistical modelling to explore the feasibility and implications of increasing occupancy rates and document any constraints which must inform the evaluation of departures from a chosen ‘average’ target.
Methods
1.9 The research has three principal components: first, statistical analyses of the efficiency of bed use as it is
influenced by hospital characteristics after controlling for such variables as case-mix, diagnostic mix and the characteristics of catchment populations; second, a parallel study of organisational and management practices of the study hospitals, including arrangements for the clinical management of patients as they progress through a hospital stay; and third, an econometric analysis of the costs and benefits associated with different levels of bed occupancy. The objective of the first component was to compare the performance of hospitals in different circumstances and thus gain insight into the extent to which variation in performance may be explained by such differences and the workloads they engender. The purpose of the second component was to provide an account of differing management practices; its combination with the first provides a basis for assessing those which might improve efficiency and for identifying the benefits that might accrue from their wider adoption. The third component explored the possible costs and benefits associated with different levels of occupancy in terms of both the effects of differences in occupancy rates on unit costs and the effects on the quality of services for patients – for example, the likelihood that hospitals are unable to cope with peaks in demand without recourse to “sub-optimal” practices such as bed borrowing and the cancellation of elective admissions.
Study design
1.10 For the reasons set out in the background section – and with the constraint of time in mind – the study
focused on one major specialty with generally high occupancy rates and a grouping of smaller specialties with generally lower rates. Both were studied in the same types of hospitals in order to include broader information about the way in which the management practices of different specialties interrelate. Although this meant the study was not concentrating on how the total bed complement of a hospital might be managed, it still permitted examination of a fairly high proportion of the bed complement of the participating hospitals. It included consideration of beds used by the study specialties elsewhere in the hospitals and beds which may be made available to other specialties. Detailed analysis was carried out on the eight Trusts who participated
in the study and in which detailed interviewing was conducted; in addition, routine activity and economic data were analysed for all Trusts. This enabled the Trusts to be located within the wider framework of the whole of Scotland.
1.11 The statistical component of the study made use of routinely available linked SMR1 data to determine
levels of bed use for the two specialty groupings suggested above: a high occupancy, high emergency admission category and a lower occupancy, high elective admission category. Chapter 2 presents an analysis of the daily variation in bed occupancy for the Trusts participating in the study. This includes fluctuations by day of the week and by the time of year and details the times at which Trusts face extreme pressure in terms of the availability of beds. Chapter 3 considers the effects of case-mix – in terms of both demographic variables such as age and sex and the differences between Trusts in the diagnostic mix of their patients – with particular emphasis on how these affect length of stay (with consequent effects on occupancy rates). Chapter 5 then analyses the relationship between daily bed occupancy and the discharge of a patient from hospital, with an interest in seeing how the former affects the latter. It also provides some detail about the effect of the day of the week and case-mix for different diagnostic groups and the differences between hospitals.
1.12 The management component was designed to provide information relating to bed management at
different levels of hospital management. Chapter 6 provides an analysis of interviews with 113 individuals from the Trusts in the study, identifying the procedures and processes of bed management in place, together with their recommendations for its improvement. It also comprises an analysis of the respondents’ perceptions of the likely effects of increasing bed occupancy, either through increasing admissions or through further reducing bed numbers.
1.13 The economic component used data on Scottish Health Service costs to consider the possibility that
differences in occupancy rates reflect differences in the efficiency with which beds are managed, and that hospitals which achieve relatively high occupancy rates are in some sense using their beds more efficiently than those with lower rates. Chapter 4 considers how direct costs per case and total costs per case varied for Scottish hospitals in the two specialty groupings between 1991 and 1996. It focuses on the relationships between these costs and occupancy rates one such factors as the length of stay and type and size of hospital has been taken into account.
Selection of study hospitals
1.14 Eight Trusts were selected on the basis that they had sufficient bed complements in both of the
specialty groupings. The sample chosen comprised teaching hospitals or large district general hospitals to ensure that they would be comparable. To as great a degree as was possible they were chosen to reflect apparent differences in occupancy ratios in the two specialty groupings, with the added constraint that they were not to overlap with the trusts being used by the Health Economics Research Unit at the University of Aberdeen in a related project. All of the Trusts approached gave their consent to the interviews for which we are grateful.
II: DAILY VARIATION IN BED OCCUPANCY
Introduction
2.1 There has been much criticism, especially from medical and nursing staff, about using the term ‘bed
occupancy’ when discussing the performance of hospitals (Yates, 1982). Williams said “there is a vast difference between a bedstead and a bed with adequate staff and services. A high bed occupancy rate may be associated with poor medical practice and service to the community” (Williams, 1968). Despite such misgivings annual bed occupancy figures are still often used to evaluate or compare how hospitals or individual specialties are using their resources. The hospital with a high average occupancy rate may not necessarily be running more effectively than the hospital with a low average. High occupancy rates can be due to longer lengths of stay rather than greater numbers of patients being treated. Furthermore since these averages are generally calculated based on an average number of available staffed beds for a year they frequently conceal bed borrowing by other specialties, five day wards, and temporary ward closures. Midnight bed counts can fail to identify patients who do not remain overnight. Even when the number of staffed beds has been counted correctly, there is no certainty that other resources such as theatre capacity or diagnostic facilities can match the available beds (Yates, 1982). In this chapter patterns of daily occupancy rates have been highlighted in order to give some insight into the wide variations in bed occupancy between hospitals and individual specialties.
Data
2.2 Analysis of data from the routine system of Scottish Hospital discharge summaries (form SMR1) and data from Scottish Health Service Costs for the financial year 1994/95 were used to investigate variation in daily occupancy rates for the two chosen specialty groupings: general medicine and its associated sub-specialties (such as cardiology or gastroenterology) as a high occupancy, high emergency admission category and the combined grouping of ear, nose and throat (ENT), gynaecology, and ophthalmology as a lower occupancy, high elective admission category. In this part of the analysis, however, the three specialties in the lower occupancy grouping were considered separately. Daily occupancy rates were calculated for all hospitals in Scotland, but the results reported here will focus on the eight hospitals chosen for the project.
Methods
2.3 The statistical package SPSS was used to calculated the daily bed occupancy of each of the hospitals for the specialties of interest. Bed occupancy (as a percentage) was defined as:
Bed occupancy = number of occupied beds x 100 number of available staffed beds
It was possible to calculate the daily number of occupied beds for specialty and hospital, because patients’ lengths of stay; dates of admission and discharge are recorded on SMR1. Nearly 10% of medical inpatient discharges in the financial year 1994/95, however, were recorded as having a length of stay of zero days (that is, they did not remain overnight). For these patients, a length of stay of 0.5 days was assumed. Information on the daily number of staffed beds was not available and so an average figure – the number of beds reported in Scottish Health Service Costs for the financial year 1994/1995 – was used.
Results
Distribution of average daily bed occupancy
2.4 Figure 2.1 shows the distribution of average daily occupancy rates for the medical grouping for each of the eight hospitals. The hospitals have been ranked A to H in increasing order of their annual bed occupancy for general medicine. The Figure shows the substantial variations in daily occupancy rates throughout the year which annual averages conceal. Hospital H for instance had an average rate of 90%, yet on a daily basis in the financial year 1994/1995 its occupancy ranged between 57% to 114%. This pattern was not particular to hospital H or to general medicine: each of the hospitals had similar variation for all four specialties (Figures 2.1 – 2.4). A B C D E F G H hospitals 40 50 60 70 80 90 100 110 120 be d oc cu panc y %
A
B
C
D
E
F
G
H
hospitals
0
20
40
60
80
100
120
140
be
d o
cc
u
pa
n
cy
%
Figure 2.2: Distribution of daily bed occupancy for ENT surgery
A
B
C
D
E
F
G
H
hospitals
0
20
40
60
80
100
120
140
be
d o
cc
u
pa
n
cy
%
A B C D F G hospitals 0 20 40 60 80 100 120 140 be d o cc u pa n cy %
Figure 2.4: Distribution of daily bed occupancy for ophthalmology
Variation in bed occupancy rates by day of week
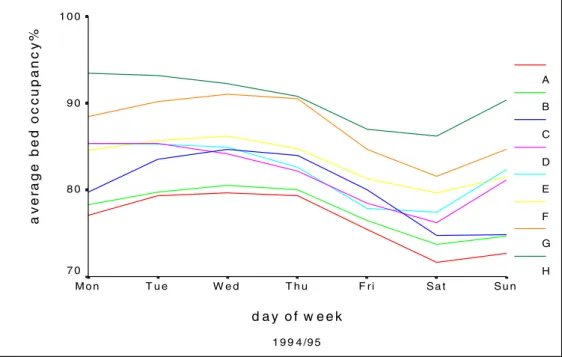
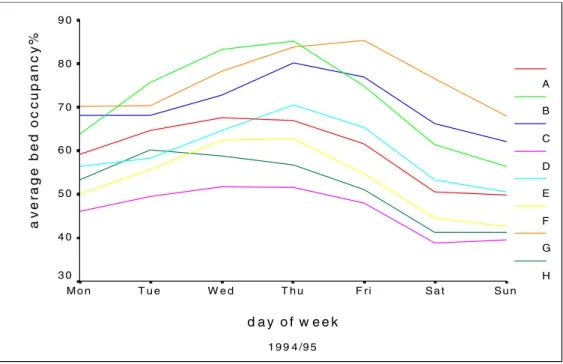
2.5 Day-to-day averages highlight how the number of occupied beds changes during the week. Bed occupancy is usually lower at the weekend due to fewer admissions because there are few elective medical admissions. GP referrals are also more likely to be held off until Monday (Audit Commission , 1992). Generally, each of the eight hospitals follows a similar pattern for bed occupancy by day of the week. In the medical grouping, they have higher occupancy rates from Monday to Thursday tailing off at weekend with an increase on Sunday (Figure 2.5). In ENT and gynaecology, occupancy rates tend be higher mid-week (Figures 2.6 and 2.7). Ophthalmology was the only specialty out of the four that did not have a clear trend for all the hospitals (Figure 2.8): hospital G follows a similar pattern to ENT and gynaecology, but hospital B’s occupancy peaked on Tuesday and then gradually decreased until Saturday.
1 9 9 4 /9 5 d a y o f w e e k S u n S a t F ri T h u W e d T u e M o n a v er a g e bed oc c u pan c y % 1 0 0 9 0 8 0 7 0 A B C D E F G H
Figure 2.5 : Average bed occupancy by day of week for general medicine and its associated sub-specialties
1 9 9 4 /9 5 d a y o f w e e k S u n S a t F r i T h u W e d T u e M o n a v er age bed oc c upanc y % 9 0 8 0 7 0 6 0 5 0 4 0 3 0 2 0 A B C D E F G H
1 9 9 4 /9 5 d a y o f w e e k S u n S a t F ri T h u W e d T u e M o n a v e ra g e be d o c c u pa nc y % 9 0 8 0 7 0 6 0 5 0 4 0 3 0 A B C D E F G H
Figure 2.7: Average bed occupancy by day of week for gynaecology
1 9 9 4 /9 5 d a y o f w e e k S u n S a t F r i T h u W e d T u e M o n a v er age bed oc c upanc y % 1 0 0 8 0 6 0 4 0 2 0 0 A B C D F G
Seasonality of bed occupancy
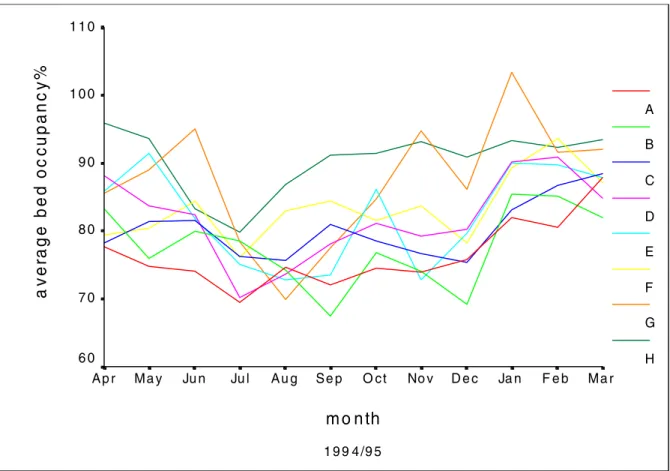
2.6 The seasonal pattern of bed occupancy is less obvious than the day-to-day variation. For general medical beds (with a high rate of emergency admissions), occupancy rates were high between January and March, with a drop in the summer months and a slight decline in December (Figure 2.9); in the high elective admission specialities, (ENT – Figure 2.10 and gynaecology – Figure 2.11) occupancy rates remained steady for most of the year apart from a sharp decline in December. Occupancy rates were more erratic however for ophthalmology (Figure 2.12) with no great similarity between the hospitals apart from a decline in July and December.
2.7 As well as the expected winter peak for general medical admissions and and a corresponding trough for the elective specialties (especially in ENT and gynaecology), each of the eight hospitals tended to have their own individual peaks and troughs at different times of the year. As an example, Hospital H did not appear to have an obvious winter peak for general medicine, but remained at a high level of occupancy for most of the year apart from a reduction in the summer months.
1 9 9 4 /9 5 m o n th M a r F e b Ja n D e c No v O c t S e p A u g Ju l Ju n M a y A p r a v er ag e be d oc c upan c y % 1 1 0 1 0 0 9 0 8 0 7 0 6 0 A B C D E F G H
1 9 9 4 /9 5 m o n th M a r F e b Ja n D e c No v O c t S e p A u g Ju l Ju n M a y A p r a v er age bed oc c upanc y % 9 0 8 0 7 0 6 0 5 0 4 0 3 0 2 0 A B C D E F G H
Figure 2.10: Average monthly bed occupancy for ENT surgery
1 9 9 4 /9 5 m o n th M a r F e b Ja n D e c No v O c t S e p A u g Ju l Ju n M a y A p r a v er age bed oc c upan c y % 1 2 0 1 0 0 8 0 6 0 4 0 2 0 A B C D E F G H
1 9 9 4 /9 5 m o n th M a r F e b Ja n D e c No v O ct S e p A u g Ju l Ju n M a y A p r a v er age bed oc c upanc y % 9 0 8 0 7 0 6 0 5 0 4 0 3 0 2 0 1 0 A B C D F G
Figure 2.12: Average monthly bed occupany for ophthalmology
Bed occupancy and emergency admissions
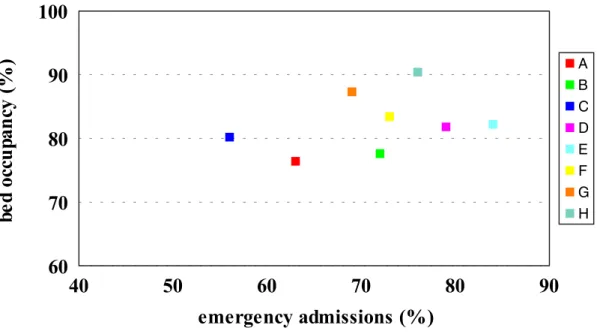
2.8 The proportions of emergency admissions for the eight hospitals in the medical specialties ranged from 58% to 84%. Hospitals with a high average occupancy tend to have a greater number of emergency admissions (Figure 2.13). For most hospitals, a high proportion of their emergency admissions are during the winter months and on certain days of the week (Audit Commission, 1992). Since occupancy rates tend to be higher at these times, this gives hospitals the potential to schedule elective admissions outwith these periods, hopefully avoiding undue pressures on their beds.
40
50
60
70
80
90
emergency admissions (%)
60
70
80
90
100
be
d o
cc
u
pa
n
cy
(
%
)
A B C D E F G HFigure 2 .13: Relationship between bed occupancy and emergency admissions for general medicine and its associated sub-specialties
Elective, transfer and emergency admissions.
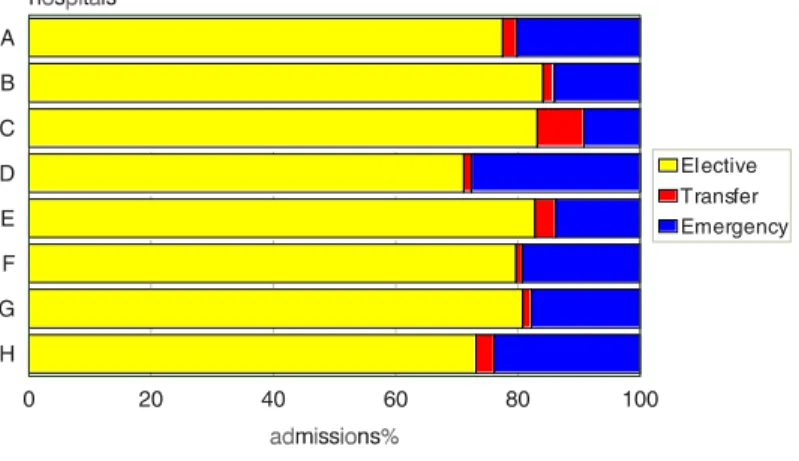
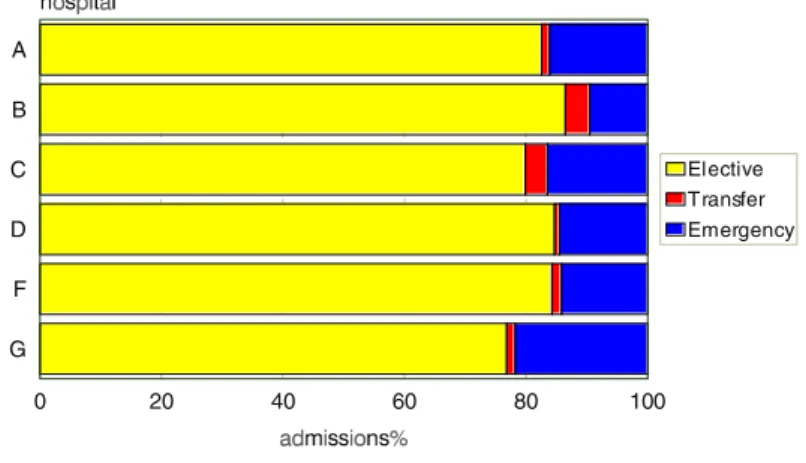
2.9 Figures 2.14 -2.17 show the division of admission types in the financial year 1994/95 for each specialty in the eight hospitals. The obvious difference is the much larger proportion of emergency admissions in general medicine compared with ENT, gynaecology or ophthalmology. In general medicine, the proportion of emergency admissions for the study hospitals (apart from C) was greater than the Scottish average (60.3% of admissions in 1993). There are marked differences between hospitals in both their proportion of emergency admissions (ranging from rather less than 60% in Hospital C to about 95% in Hospital H) and the proportions of patients of transferred from another speciality (under 5% in Hospital E and 20% in Hospital B). These differences will themselves influence annual average bed occupancy rates, but they also raise other doubts about the ways in which these categories of patients are recorded in one or other hospital. Similar – although less substantial –differences are seen for the other specialities.
A B C D E F G H hospitals 0 20 40 60 80 100 admissions% Elective Transfer Emergency
Figure 2.14: Proportion of elective, transfer and emergency admissions for general medicine and its associated sub-specialties
A B C D E F G H 0 20 40 60 80 100 Elective Transfer Emergency
Figure 2.15: Proportion of elective, transfer and emergency admissions for ENT surgery
A B C D E F G H 0 20 40 60 80 100 Elective Transfer Emergency
A B C D F G 0 20 40 60 80 100 Elective Transfer Emergency
Figure 2.17: Proportion of elective, transfer and emergency admissions for ophthalmology
Periods of pressure
2.10 Levels of occupancy over 90%, 95% and 100% or over were investigated for the eight hospitals. For general medicine and its associated sub-specialties, five of the eight hospitals had occupancy rates of 100% or more for at least five days of the year (Figure 2.18). It is interesting that these days were not during the winter period but were spread over a several months. What these high occupancy rates mean in two of the hospitals is illustrated in the examples below:
Hospital H – high bed occupancy • 14 admissions per day, on average
• 9 or less ‘free’ beds for 60% of the year
• no ‘free’ beds for 12% of the year
Hospital E –average bed occupancy • 21 admissions per day, on average
• 16 or less ‘free’ beds for 23% of the year
A
B
C
D
E
F
G
H
hospitals
0
10
20
30
40
50
60
70
da
ys
in
t
he
ye
ar
(
%
)
Bed occupancy
>90%
>95%
>100%
Figure2.18 : Periods of pressure for general medicine and its associated sub-specialties
2.11 The three specialties with high rates of elective admissions also had to deal with high occupancy rates. Figure 2.19 shows the percentage of days in 1994/95 when the combined elective specialties had occupancy rates of 90%, 95% and 100% or more. These days were again spread over a several months. The hospitals with the highest levels of bed occupancy in general medicine were not necessarily the same as those with high rates for the elective specialties. Hospital H had the greatest percentage of days of 90% and over for general medicine, but had the lowest number for the elective specialities; hospital C had relatively few high occupancy days for general medicine, but the second highest proportion for the “elective” specialities. These differences may be due to different ways of managing caseload and may also reflect the effects of bed borrowing in one or other hospital.
A
B
C
D
E
F
G
H
hospitals
0
10
20
30
40
50
60
70
da
ys
in
t
he
ye
ar
(
%
)
Bed occupancy
>90%
>95%
>100%
Hospital Average Occupancy % No. of days occupancy>=90% No. of days occupancy>=95% No. of days occupancy>=100% A 76.45 12(3.3%) 3(0.8%) 0 B 77.63 22(6.0%) 1(0.3%) 0 C 80.21 30(8.2%) 8(2.2%) 0 D 81.82 78(21.4%) 19(5.2%) 9(2.5%) E 82.22 85(23.3%) 23(6.3%) 5(1.4%) F 83.37 64(17.5%) 22(6.0%) 5(1.4%) G 87.28 150(41.1%) 88(24.1%) 45(12.3%) H 90.43 217(59.5%) 107(29.3%) 45(12.3%)
Table 2.1: Annual bed occupancy and periods of pressure for general medicine and its associated sub-specialties
2.12 Tables 2.1 – 2.4 detail the relationship between annual average and daily occupancy rates for the four specialities in each Trust and provide a helpful insight into the implications of different rates of annual occupancy. Leaving aside uncertainties about the ways in which annual rates might be calculated, one question that might be asked about them is whether it is possible to propose a “right” or “acceptable” annual rate for comparative purposes. There are, of course, other variables to be considered in such a discussion (Chapters III and IV provide an illustration). What crude annual averages do not do is take account of the requirements of a patient’s admission at different stages of a hospital stay; for this reason, they do not reflect the severity of illness (and thus the necessary skill levels of appropriate staff) or provide a measure of the flexibility needed for the random arrival of emergency admissions. Boarding patients in the beds of other specialties may provide a solution to the simple necessity of admitting a patient to hospital but it can have more complex implications for the quality of care that is provided and such other aspects of their costs as their staffing needs.
2.13 There can, of course, be no absolute percentage rate of bed occupancy that reflects an optimal efficiency of bed use – principally, for the reasons above, that a simple statistic cannot reflect the differing circumstances of individual hospitals. Leaving these objections aside, however, Table 2.1 provides a crude indication that – for general medicine – occupancy rates in the low 80s may be an approximate measure of what can be expected (noting always that these data relate to a small sample of Trusts). In Table 2.1, and assuming that a 95% occupancy rate reflects an upper limit if new cases are to be accommodated, Trust D with an annual average occupancy of 82% will encounter this higher level of demand about once every three weeks. Trust F (annual average 83%) will do so every seventeen days and the speciality will need to board its patients on only five days each year. In contrast, Trusts G and H (87% and 90%) will reach the level of 95% occupancy every three or four days and will need to board patients on one day in eight.
2.14 Rather different considerations apply to the “high elective” specialities when it seems necessary to ask whether seemingly low bed occupancy rates are a sensible basis for evaluating the work they undertake. These specialities are characterised by a high proportion of planned admissions associated with relatively short lengths of stay so that – at the level of bed use – such other influences as the availability of operating theatre resources or patterns of staffing beds over the course of a week (neither of which are captured by bed
occupancy rates) may be more significant determinants of their efficiency. It is also worth recalling that these beds are used as a reserve for the admission of patients from the “high emergency” specialities and that such admissions do not necessarily contribute to bed occupancy rates.
2.15 Even with these qualifications, the question of a “right” rate of bed occupancy is not well expressed in annual percentages. For ENT surgery, Trust C (annual rate 69%) experienced 90% occupancy every sixth day and had an occupancy rate over 100% on one day in 9. For gynaecology, Trust G filled 95% of its beds every sixth day and boarded patients every ninth day for an annual rate of 76%. Lower rates of occupancy suggest a more stable balance: In Trust F (annually, 60% for ENT surgery), 90% occupancy was reached every twelfth day and every fourteenth day in Trust B for an annual average of 59%. None of these simple calculations make allowance for low rates of occupancy at weekends.
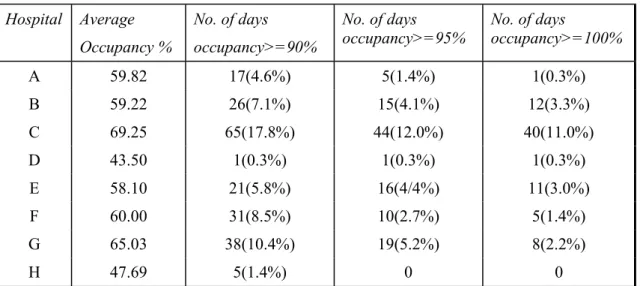
Hospital Average Occupancy % No. of days occupancy>=90% No. of days occupancy>=95% No. of days occupancy>=100% A 59.82 17(4.6%) 5(1.4%) 1(0.3%) B 59.22 26(7.1%) 15(4.1%) 12(3.3%) C 69.25 65(17.8%) 44(12.0%) 40(11.0%) D 43.50 1(0.3%) 1(0.3%) 1(0.3%) E 58.10 21(5.8%) 16(4/4%) 11(3.0%) F 60.00 31(8.5%) 10(2.7%) 5(1.4%) G 65.03 38(10.4%) 19(5.2%) 8(2.2%) H 47.69 5(1.4%) 0 0
Table 2.2: Annual bed occupancy and periods of pressure for ENT surgery
Hospital Average Occupancy % No. of days occupancy>=90% No. of days occupancy>=95% No. of days occupancy>=100% A 60.04 3(0.8%) 0 0 B 71.53 48(13.2%) 29(7.9%) 18(4.9%) C 70.63 42(11.5%) 28(7.8%) 13(3.6%) D 46.44 0 0 0 E 59.90 9(2.5%) 3(0.8%) 2(0.5%) F 53.25 5(1.4%) 2(0.5%) 1(0.3%) G 76.06 92(26.0%) 65(17.8%) 43(11.8%) H 51.76 1(0.3%) 0 0
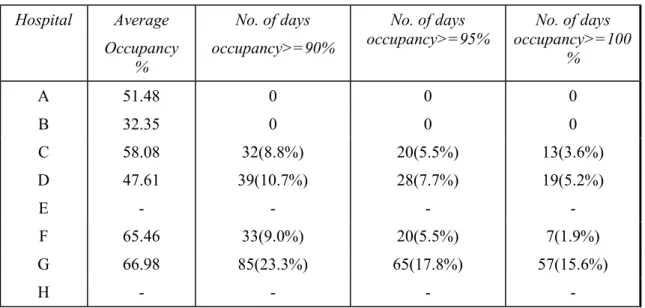
Hospital Average Occupancy % No. of days occupancy>=90% No. of days occupancy>=95% No. of days occupancy>=100 % A 51.48 0 0 0 B 32.35 0 0 0 C 58.08 32(8.8%) 20(5.5%) 13(3.6%) D 47.61 39(10.7%) 28(7.7%) 19(5.2%) E - - - -F 65.46 33(9.0%) 20(5.5%) 7(1.9%) G 66.98 85(23.3%) 65(17.8%) 57(15.6%) H - - -
-Table 2.4: Annual bed occupancy and periods of pressure for ophthalmology Conclusion
2.16 The main argument of this Chapter has been to suggest that annual average bed occupancy rates do not – or do not necessarily – reflect the efficiency of hospital resource use even at the simplistic level of counting beds. Hospitals reporting an average occupancy of 90% may appear to be working efficiently when in fact they are treating fewer patients with longer lengths of stay. When used for comparative purposes, crude bed occupancy rates do not take account of the ‘legitimacy’ of differences resulting from factors outwith the control of the hospital or its management: these will include variation in case-mix, in diagnostic-mix, and the social context of a hospital’s practice when influences such as “bed blocking”. Although it is tempting to seek some simple comparative statistic, this first level of the project’s analysis illustrates other features of the problem, especially in its demonstration that annual averages fail to reflect daily, weekly, or seasonal variations in demand. There are two sides to this issue: first, the idea that there might be some rule-of-thumb rate of expected bed occupancy is attractive in the sense of estimating whether a speciality is under- or over-performing: with the strong proviso that these rates may not reflect the other circumstances of a Trust, there are suggestions in Table 2.1, that – for general medicine – Trusts A and B may reflect some degree of spare capacity whereas Trust H is may be under-resourced. Two points are worth making, however: first, that this view is based more on observations about their daily bed occupancy than on their annual rates, and, second, that it is based only these rates. It takes no account of what may be more significant determinants of them – principally, lengths of patient stay and (for example) the options they may have for treating patients as day-cases rather than as in-patients.
2.17 The second issue – which may have greater relevance to the bed occupancy rates of the elective specialities – concerns the extent to which simple measures of this kind reflect the patterns of work undertaken in contemporary hospital practice and thus the link between “bed occupancy” as a measure of such work and the actual provision of patient care. This is an important question because the introduction of contracting has shifted the focus of hospital management (and Trust accounting) away from historical measures of activity – bed occupancy is one – towards a more patient-focused perspective. The question is important because whether regarded as an indicator of spare capacity or as a measure of efficient resource use (as a correlate of costs), there is no a priori reason to assume that bed occupancy rates will reflect the more significant resources needed to provide patient care.
2.18 This view leads on to a rather different conclusion about the uses of bed occupancy rates. Clearly, there are arguments for the efficient use of beds within Trusts so that, internally, there will be a need to monitor bed use as part of the management processes of a Trust. At this level, bed occupancy rates can have value as a way of monitoring other requirements – staffing needs is an obvious example. Comparisons between Trusts, on the other hand, create the need for a wholly different approach to evaluating performance
or efficiency: later sections of the Report identify both the inadequacies of present data for these purposes and provide a preliminary account of the considerations necessary if a more useful understanding of complex problems is to be reached
References
Audit Commission. (1992) Lying in wait: the use of medical beds in acute hospitals.
Information and Statistics Division. Scottish Health Service Costs. Information and Statistics Division, National Health Service in Scotland, 1991 to 1996.
Williams, B. (1968) The use and misuse of bed-occupancy and waiting list figures. Lancet 1968 i1029-1030. Yates, J. (1982) Hospital Beds: A problem for diagnosis and management?
III: CASE MIX
Introduction
3.1 Adjusting for the case-mix of populations for the purpose of comparing units (e.g. treatments,
institutions) is an essential part of health research. Despite the importance of case-mix adjustment there is no consensus on the ‘correct’ method for doing so. The problem is particularly difficult when using routine hospital data because the level of information is understandably limited. The aims of this chapter are to outline some of the rationale for methods of case-mix adjustment in the analyses presented in this report and to present some results which highlight the importance of case-mix adjustment.
Healthcare Resource Groups (HRGs)
3.2 In both the econometric and survival analyses, it was necessary to use information from all discharges
from General Medicine and its sub-specialties. Given the range of diagnoses and operational procedures which would be involved in the data set, the main concern was how to reduce the dimensionality of the data. It was deemed sensible to use an established case-mix adjustment tool and The National Casemix Office’s HRG classification, Version 3, appeared appropriate. The grouping algorithm uses the OPCS procedure codes and ICD diagnosis codes as the main sources of information to assign hospital episodes to groups which are homogenous in terms of resource utilisation. The classification can also depend on the age of the patient, the method of discharge (i.e. dead or alive) and length of stay (LOS); further details are available in the Introduction of the documentation set for HRG, Version 3.
3.3 The HRG classification of episodes results in a maximum of 572 groups which form a total of nineteen
chapters. Chapter headings and the number of HRGs in each are detailed in table 3.1. The division of HRGs into chapters will be referred to again in chapter 5 when describing the results from the survival analyses. In the present chapter, these chapter headings are used to illustrate the differences between hospitals’ case mix.
HRG Chapter Heading n HRGs
Nervous System 36
Eyes and Periorbita 12
Mouth, Head, Neck and Ears 31
Respiratory System 36
Cardiac Surgery and Primary Cardiac Conditions 38
Digestive System 65
Hepato-biliary and Pancreatic System 25
Musculoskeletal System 56
Skin, Breast and Burns 47
Endocrine and Metabolic System 19
Urinary Tract and Male Reproductive System 57
Female Reproductive System 21
Obstetrics and Neonatal Care 12
Diseases of Childhood 26
Vascular System 20
Spinal Surgery and Primary Spinal Conditions 20
Haematology, Infectious Diseases, Poisoning and Non-specific Groupings
27
Mental Health 17
Undefined Groups 7
Total 572
Table 3.1 : HRG chapter headings and HRG content Variation in case-mix between study hospitals
3.4 For the eight study hospitals in the project, all episodes in General Medicine and its associated
sub-specialties in 1994-95 were grouped into HRGs and the corresponding HRG chapters. A comparison of the variation in case-mix between hospitals is illustrated using HRG chapters in figure 3.1. For the purpose of this illustration, only the six largest chapters are shown and all remaining episodes are grouped into ‘Other Chapters’. The workload of the hospitals is shown as the percentage of hospital episodes within each of these seven groups.
Figure 3.1 : HRG-mix in eight study hospitals
3.5 It is obvious that even under the broad HRG chapter headings, the case-mix of each hospital is quite
different. For example, hospitals B and C have the same proportion of episodes for Cardiac Surgery and Primary Cardiac Conditions, and approximately the same proportion of episodes for Haematology, Infectious Diseases, Poisoning and Non-specific Groupings. However, hospital B has approximately twice the proportion of episodes for the Respiratory System than hospital C, and hospital C has twice the proportion for the Urinary Tract and Male Reproductive System.
3.6 Comparing case-mix at the level of HRG chapter is only an indication of how the patients treated and
the treatments they receive differ between hospitals. Within each chapter there can be up to 65 distinct HRGs and within each HRG there may be important differences between patients which are not taken into account by the grouping algorithm. Age of the patient is used at a basic level to distinguish between the under and over 70’s, for example. Social factors such as marital status and deprivation are also known to affect the level of resources required by different patient groups (see Chapter 4).
3.7 Table 3.2 illustrates some of the other differences in case-mix between the eight hospitals. The average age and sex ratio of episodes do not vary markedly among the hospitals. There are, however, large variations in other factors; the proportion of patient episodes for married patients ranges from 47% to 61%, while the proportion of patient episodes for patients from the most deprived areas in Scotland (upper quartile of Carstair’s scores for postcode sectors, 1991) ranges from 5% to 67%. It is recognised that important social processes can operate through such factors as family structure and deprivation which in turn influence the need for health services (e.g. longer lengths of stay). Therefore, the large variations illustrated in table 3.2 have important implications for understanding the different services being provided in each hospital. There are also wide variations in the types of episode according to whether any co-morbidities were recorded for each episode (ranging from 30% to 66%) and whether the case was an emergency admission (56% to 84%) – both these factors will increase length of stay (LOS). The number of episodes which ended in a transfer to another specialty within the same hospital ranged from 4% to 27%. Indicators such as this may reflect differences in the case-mix of the patients arriving in General Medicine as well as differences in
0 20 40 60 80 100 120 A B C D E F G H ho sp ita l % of all discharges
Cardiac Surgery/Conditions Haema/Inf. Diseases etc Respiratory System Digestive System Nervous System Urinary/Male R epro. Other C hapters
hospital management or scope for management - larger hospitals will be more able or likely to operate between specialty transfers than hospitals with fewer specialties.
Hospital age (mean) males (%) married (%) deprived (%) co-morbidity (%) emergency adm. (%) transfer (%) A 58.9 53 61 14 57 63 17 B 58.2 51 47 67 58 72 27 C 59.7 49 57 52 50 56 9 D 56.8 49 61 15 44 79 10 E 58.6 52 55 28 60 84 4 F 60.7 50 51 40 50 73 13 G 61.1 52 54 5 66 69 12 H 57.0 52 55 63 30 76 8
Table 3.2 : Variation in case-mix among the eight study hospitals
HRG-adjusted LOS vs. crude LOS
3.8 The following section provides an illustration of the extent to which LOS varies between hospitals and
how this is influenced by case-mix. Table 3.3 details the crude and HRG-adjusted LOS for General Medicine and its associated sub-specialties in 26 hospitals for the financial years 94/95 and 95/96. The 95/96 HRG-adjusted LOS was taken from the Blue Book and the other figures were derived from the SMR1 data set. The 26 hospitals form the sample used in the econometric analysis ; a description of the sample and the methods used to calculate the scores can be found in Chapter 5. Figures below 100 indicate that LOS in these hospitals was less than the Scottish average, while figures above 100 indicate that LOS was longer than average. Hospitals are ordered in ascending crude LOS score in 94/95.
3.9 The purpose of this table is to illustrate two points. The first is that adjusting for case-mix using HRGs
can substantially change the rating of a hospital’s performance relative to the Scottish average. In 94/95, for example, the crude LOS score for hospital 24 was 79 indicating that it had one of the shortest stays of the 26 hospitals. However, adjusting for case-mix increased the LOS score to 107, implying that the stays were longer than average for the types of patients being treated there. The second point is that the LOS for individual hospitals varies from year to year. Clearly this variation over time exists for both the crude LOS scores and the adjusted ones. The point to make is that variation in the crude LOS may be attributable to changes in case-mix rather than changes that have taken place in the organisation and policy of the hospital. For example, the crude LOS score for hospital 26 increased from below average (89) to above average (103) between 94/95 and 95/96. However, by considering the HRG-adjusted LOS scores, it would appear that the hospital actually decreased LOS relative to the Scottish average.
3.10 Table 3.4 contains crude and adjusted LOS scores for the 26 hospitals but these are now calculated for the selected low occupancy specialties of ENT, Gynaecology and Opthamology. The table is included for reference and illustrates the same points as those made for General Medicine and its associated sub-specialties.
Conclusions & Discussion
3.11 The purpose of this chapter has been to illustrate that case-mix can vary substantially among hospitals
and if one wishes to compare hospitals in terms of performance or management of resources, then failing to take account of these differences can be misleading. Figure 3.1 and table 3.2 compared the eight study hospitals in terms of their HRG-mix and other case-mix indicators and both showed important differences in the composition of patient episodes. Given that the provision of services will be directly affected by these differences, clearly it is not sensible to compare the hospitals in terms of outcomes without first adjusting for differences in inputs (e.g. patients) and processes (e.g. treatments).
3.12 The following chapter provides a more detailed account of the effects of case-mix on length of stay. In
some cases, differences between patient groups were found to be quite small, for example, increasing length of stay with increasing deprivation. However, if these differences are considered at the hospital level, where the percentage of patients from deprived areas can vary from just 5% to over 60% (table 3.2), the effect on the hospital’s average length of stay will be much greater. Other factors, such as the episode ending in a transfer to another specialty within the same hospital may reflect differences in case management as well as differences in case-mix. Episodes ending in a transfer were found to reduce LOS but this does not mean a reduction in the total time the patient spends in that hospital. The fact that between specialty transfers can account for one in four episodes in some hospitals (table 3.2) implies that beds should be considered a trust resource rather than a resource at the specialty level.
3.13 This chapter also provided an illustration of the effects of case-mix with tables 3.3 and 3.4 detailing
LOS scores for 26 Scottish hospitals with and without adjusting for HRG-mix. These showed how inferences drawn from both cross-sectional and temporal variation in LOS could be affected by taking account of HRG-mix. Further implications of taking account of case-mix will be discussed in chapter 5 which describes the econometric analysis of bed occupancy and cost per case.
3.14 It was stated at the start of this chapter that adjusting for case-mix with routine data can be problematic
because information is limited. For example, information on severity of disease is not available in the routine data and current methods have to rely on proxy measures such as co-morbidities and emergency admissions in an attempt to take severity into account. Therefore, while the use of adjusted measures are preferable to crude measures, adjustment should not be considered a panacea. However, making an attempt to understand the differences between hospitals that result from differences in the patients they treat and the services they provide will be provide a more informative step towards understanding how resources are managed.
Crude Score HRG Adjusted Score Hospital 1994/95 1995/96* 1994/95 1995/96* B 79 77 82 85 24 79 89 107 109 D 80 89 89 86 18 84 82 82 73 28 84 74 64 67 F 84 93 95 100 26 89 103 110 103 H 92 86 102 97 A 93 92 98 86 C 94 68 88 87 35 97 104 77 86 29 98 101 102 103 36 98 96 99 98 E 100 97 102 100 34 101 112 103 110 23 103 105 103 100 22 105 104 108 106 20 106 112 114 133 G 110 105 101 105 31 112 92 124 112 25 113 111 113 109 21 124 127 128 136 17 126 127 121 125 32 129 126 128 129 30 134 135 111 106 16 144 151 125 140
Table 3.3 : Crude and HRG Adjusted Length of Stay Scores for 26 Scottish Hospitals:
Financial Years 1994/95 and 1995/96 – General Medicine and Associated Specialities: Scotland = 100
Crude Score HRG Adjusted Score Hospital 1994/95 1995/96* 1994/95 1995/96* 28 74 71 78 73 16 84 86 100 107 D 87 82 88 91 29 88 82 104 111 C 89 84 90 90 34 90 74 87 82 22 92 96 87 93 H 92 89 101 105 36 93 98 97 94 26 94 101 93 90 20 94 103 87 94 24 94 93 94 91 32 95 97 105 104 23 99 118 100 108 E 100 105 98 101 21 102 95 108 107 35 105 105 99 99 18 107 96 117 87 F 107 104 102 102 B 111 104 100 101 25 113 97 101 101 G 119 118 119 123 30 119 115 95 95 17 122 121 105 107 A 123 129 115 117 31 148 127 120 114
Table 3.4 : Crude and HRG Adjusted Length of Stay Scores for 26 Scottish Hospitals: Financial Years 1994/95 and 1995/96 – ENT, Gynaecology, Ophthalmology: Scotland = 100
IV: SURVIVAL ANALYSIS
Introduction to the use of survival analysis
4.1 Survival analysis is the name given to the statistical technique used to model the duration of an episode
from a defined start point to an end point for a number of individuals, with particular reference to the determination of the influence of individual characteristics on this duration. A common example of the use of survival analysis would be to follow up patients until death (the end point) following the administration of a drug or treatment (the start point). The survival analysis would then be able to provide information as to whether survival was improved amongst a group of patients taking one drug over another, or to give a description of the ways in which the patient’s age and comorbidities affect their survival. The analysis may be complicated by individuals leaving the study before reaching the end point – for example, a patient being lost to follow-up before death. The survival time of such a patient is censored and should be included in the analysis because, although the precise time of death is not known, the time at which they left the study usually is and they were known to be alive at this time.
4.2 The modelling of hospital stays may then be conducted using survival analysis, although in this context
“survival” may appear to be a misnomer since the duration of interest is not until death but from admission to hospital (the start point) until discharge (the end point). The analysis presented in this chapter focuses on the factors influencing the decision to discharge patients, with particular reference to the impact of daily bed occupancy rates. Patients who died during their hospital stay are therefore regarded as being censored, since no decision was taken about their discharge and they therefore could not be regarded as having reached the end point. The analysis was performed for the financial year running from 1 April 1994 to 31 March 1995 to tie in with the economic analysis over the same period; for this reason there was also left-censoring of patients who were admitted to hospital before 1 April 1994 but discharged on or after this date and right-censoring of patients who were admitted on or before 31 March 1995 and subsequently discharged on or after this date.
4.3 The data structure is hierarchical, relating to episodes nested within patients who are treated within
hospitals. This structure is likely to have consequences for the analysis; patients within the same hospital are likely to have similar decisions taken concerning their appropriate length of stay. With data available for a total of 45 hospitals a random effects model is appropriate whereby the higher order effects (the effects of hospitals upon the length of stay of their patients) are assumed to be normally distributed.
4.4 A variable such as bed occupancy is known as a time-dependent covariate – its value changes from one
day to the next. The survival analysis essentially uses information from every day of a patient’s stay and not just the day of discharge; in addition to the occupancy at discharge it is therefore also important to consider the occupancy on each day that the patient was not discharged. The rationale behind this is that if there is a link between daily occupancy rates and discharges – if, for example, patients are more likely to be discharged when occupancy rates are high – then the association must run both ways and patients should be less likely to be discharged when occupancy rates are low. Multilevel modeling was used to build a random effects survival model for data including time-dependent covariates. The following section introduces the
principles of this analysis and some of the more commonly occurring issues are explored in detail. This is then followed by details of the Analyses and results for General Medicine and its associated sub-specialties..
Case study: Chronic obstructive airways disease (COAD)
4.5 The purpose of this section is to familiarise the reader with the concepts of multilevel survival analysis
and explore some of the issues which will arise in each of the 14 analyses for general medicine. This will alleviate the need for repetition of key findings. The underlying algebra and many of the results are presented in Appendix B; for a fuller understanding this chapter should be read in conjunction with that Appendix.
4.6 The data relate to 6109 hospital episodes with principal diagnosis of chronic obstructive airways disease
(ICD9 496). This was selected as an example of a common condition for which there may be multiple episodes per patient and for which there was a reasonably long mean length of stay and reasonable variation about this mean, implying that the possibility may exist to reduce stays and that there may be a lack of consensus as to an appropriate length of stay.
4.7 A total of 4229 patients were admitted to hospital during the course of the financial year 1994/95,
generating 6109 episodes between them for an average of 1.44 episodes per patient. The mean length of each episode of care was 8.69 days (S.D. 7.90). Admissions were made to 39 hospitals, giving a mean of 157 episodes per hospital (range 1 to 798); the range in mean length of stay was from 4.19 to 12.33 days. The mean number of episodes per patient varied from 1 to 2.08. There were 5956 discharges meaning that 153 (2.5%) episodes were right censored.
Covariate effects
4.8 The effect of each covariate – variables describing the individual patient (such as age and sex) – is
expressed as the risk of discharge relative to a reference group. A risk greater than one implies a greater risk of discharge than the reference group on any given day and hence implies that shorter lengths of stay are associated with that covariate than with the reference group. The estimates given in table B2, for example, suggest that the relative risk of discharge for women is 0.96 relative to that of men (95% C.I. 0.91-1.00). For a continuous variable, such as age, the figure relates to a unit increase in that variable. The same table implies that each additional year of age gives a relative risk of discharge of 0.98 (95% C.I. 0.98-0.99). This risk is the same whether comparing a 61 year old to a 60 year old or a 71 year old to a 70 year old. These risks are multiplicative; the relative risk of discharge of a 60 year old is therefore 1.17 compared to a 70 year old (95% C.I. 1.14-1.20).
Hospital effects
4.9 Each hospital is assumed to have a constant effect on the relative risk of discharge of its patients, and
these effects are multiplicative in the same way as patient covariates. The effects of the hospitals are estimated from the data. The fact that these effects vary between hospitals is an explanation for observed differences between hospitals for the length of stay of their patients even after the standardisation for case mix and HRG mix. The degree of variation between hospitals enables the construction of a coverage interval for hospital effects (see figure B2).
Patient effects
4.10 Some patients will be admitted to hospital more than once during the course of the year. In the same
way that a hospital could have an effect on the length of stay of its patients – possibly due to the clinical decision process regarding the correct length of stay – there may be patient effects. Thus a decision to keep a patient in for an above average length of stay on one occasion may be repeated on subsequent occasions. This may reflect conditions not collected on SMR1 but which remain constant for the patient, such as social circumstances or the severity of the condition. Table B4 indicated that these patient effects were large
compared to the hospital effects for chronic obstructive airways disease – about three and a half times the size. However, the remainder of this chapter has considered the analysis of episodes within hospitals with no regard to the consequences of patients generating multiple episodes with the following reasoning. Our interest is focused on the effects of the covariates and of bed occupancy in particular; the addition of the patient level of analysis did not appear to alter the covariate estimates by any reasonable magnitude (see table B4). By its nature, chronic obstructive airways disease is likely to have a larger number of multiple episodes per patient that General Medicine as a whole – 72% of the patients treated in General Medical specialties throughout Scotland in 1994-95 only had a single episode of care. Moreover, the addition of the patient level is only the partial solution to a particularly complex problem; completeness would require the inclusion of the cross-classification of patients by hospitals, since patients may have attended more than one hospital, and of patients by HRG chapter since there may be associations within patients across different treatment categories. The effect of area of residence, although not found to be of importance for this diagnosis, should similarly be cross-classified by the hospital. The use of an episode and hospital hierarchy was therefore designed to provide a quick solution to what could be a very resource-intensive problem.
Time-dependent hazards
4.11 It may be that the effect of a covariate, in terms of the relative risk of discharge, is not the same
throughout a patient’s stay in hospital. For example, is the risk of a female patient being discharged relative to a male always 0.96 or does this effect diminish as the length of stay increases? A cursory examination of such possibilities indicated that even when such effects are significant they tend to be extremely small and do not effect other parameter estimates (see table B3).
Bed occupancy
4.12 There are a number of possible relationships which can be envisaged between bed occupancy and the
relative risk of discharge. Different formulations – based upon a simple linear relationship with occupancy, step functions depending upon the level of occupancy above a certain level or occupancy only factoring after a certain length of stay – yielded the same relationship. The remaining analyses therefore consider just the simple linear relationship.
Survival Analysis for General Medicine
4.13 The following section of the report contains results from the analysis of length of stay for all discharges
from General Medicine specialties in the financial year 1994-95. The statistical methods have been described in the previous section detailing the pilot analysis for COAD discharges and in Appendix B.
The data
4.14 There were 226,228 episodes in General Medicine and its associated sub-specialties in Scotland in
1994-95, involving 52 hospitals. The main aim of the analysis was to determine the association between bed occupancy and LOS, and it was therefore necessary to omit observations from hospitals for which bed occupancy was either unavailable or appeared unreliable. Information on bed occupancy was not available for two hospitals and was considered unreliable for five hospitals. In most cases the unreliability arose from very high daily bed occupancy figures which were likely to have resulted from the average number of staffed beds, taken from the Blue Book, changing some time in the financial year. Omitting these eight hospitals resulted in losing 2,483 discharges (1.1%).
Adjusting for case-mix
4.15 The number of diagnoses and operational procedures which were carried out for all medical discharges
meant that it was necessary to adopt an established case-mix adjustment tool. Each discharge was assigned an HRG code based on the National Casemix Office’s grouping, Version 3. Other information recorded on the SMR1 about factors known to affect LOS was also included in the models. These factors were the age and sex of the patient, their marital status and a deprivation score of their area of residence, using 1991 Carstair’s scores for postcode sectors. Also included in the models was whether or not any secondary diagnoses were recorded, the type of admission and type of discharge.
Format of analyses
4.16 Due to the number of discharges, it was necessary to split the data into groups which could be handled
with the available computing hardware. HRG chapters formed an obvious classification of the data and it seemed reasonable to carry out a separate analysis for each chapter. The number of discharges and the percentage of all discharges for each chapter heading are detailed in table 4.1. The largest HRG chapter, Cardiac Surgery and Primary Cardiac Conditions, had to be split further into two sets because the number of discharges could not be processed in a single model.1 Analyses for six of the nineteen chapters were not carried out because the number of discharges were relatively small. These chapters were Eyes and Periorbita, Mouth, Head, Neck and Ears, Female Reproductive System, Obstetrics and Neonatal Care, Spinal Surgery and Primary Spinal Conditions, and Undefined Groups. In total, these chapters only formed 2.3% of all discharges. This resulted in fourteen separate analyses.
1 The Cardiac Surgery and Primary Cardiac Conditions chapter was split into two groups: group 1 contained the HRGs
for Acute Myocardial Infarction, Heart Failure or Shock, Cardiac Arrest and Angina, and resulted in 32,695 episodes. All other HRGs from the chapter were combined to form group 2 which consisted of 45,094 episodes.
HRG Chapter Heading n discharges %
Nervous System 21,889 9.7
Eyes and Periorbita 225 0.1
Mouth, Head, Neck and Ears 1,285 0.6
Respiratory System 29,992 13.3
Cardiac Surgery and Primary Cardiac Conditions 77,789 34.4
Digestive System 20,724 9.2
Hepato-biliary and Pancreatic System 4,972 2.2
Musculoskeletal System 8,356 3.7
Skin, Breast and Burns 3,665 1.6
Endocrine and Metabolic System 6,095 2.7
Urinary Tract and Male Reproductive System 9,009 4.0
Female Reproductive System 790 0.3
Obstetrics and Neonatal Care 56 0.0
Diseases of Childhood 3,058 1.4
Vascular System 2,677 1.2
Spinal Surgery and Primary Spinal Conditions 1,069 0.5
Haematology, Infectious Diseases, Poisoning and
Non-specific Groupings 27,776 12.3
Mental Health 4,997 2.2
Undefined Groups 1,804 0.8
Total 226,228 100
Table 5.1 : Distribution of discharges by HRG chapter headings
Results
Case-mix effects
4.17 The main interest of the analysis was in the effect of bed occupancy on the probability of discharge. In
order to address this research question and report differences between hospitals it was necessary to adjust for the case-mix of the patients as outlined in paragraph 4.15. The effects of these variables on LOS are generally well understood, e.g. LOS increases with age, hence the probability of discharge decreases with age.
4.18 Estimates for the case-mix effects were obtained from each of the fourteen analyses except where
noted. The size and direction of the effect, either an increasing or decreasing effect on the probability of discharge, changed according to HRG chapter. For the purpose of the summary presented in table 4.2, the results from the fourteen analyses for each variable were split according to how many increased and decreased the risk of discharge, and how many of each were statistically significant. Table 4.2 should give an overview of the direction and consistency of the effects - specific details of the estimates and confidence intervals can be found in Appendix C, tables C1-C5. With the exception of age, all variables were
categorical which meant that the results were estimated as the risk of discharge relative to a reference category. For all effects described in table 4.2, the reference category is given in italics. For example, the effect of sex was estimated as the risk of discharge for women relative to men.
4.19 Increasing age, having co-morbidities, being transferred into a specialty or being admitted as an
emergency all had a decreasing effect on the probability of discharge and were relatively consistent across HRG chapters. This would be expected as all these variables are indicators for more complex cases and hence longer lengths of stay. Women tended to have longer stays than men although these effects were significant in just under half of the HRG chapters. Compared to patients who were single, married patients were discharged earlier, while being widowed or divorced had a less clear effect on LOS. Patients from more deprived areas had longer stays but these effects were generally quite small and more often than not, not statistically significant. While being discharged from a specialty was the outcome variable, different types of discharge, excluding death, were thought to be reasonable case-mix indicators. However, with the exception of being transferred to another specialty within the same hospital, which significantly reduced LOS in all HRG chapters, the effects estimated for type of discharge were not very consistent across the HRG chapters.