R E S E A R C H
Open Access
Structural and functional analytics for
community detection in large-scale complex
networks
Pravin Chopade
1*†and Justin Zhan
2†*Correspondence: [email protected] †Equal contributors
1Department of Computer Science, North Carolina A and T State University, 305 Cherry Hall, 1601 East Market Street, Greensboro, NC, USA Full list of author information is available at the end of the article
Abstract
Community structure is thought to be one of the main organizing principles in most complex networks. Big data and complex networks represent an area which
researchers are analyzing worldwide. Of special interest are groups of vertices within which connections are dense. In this paper we begin with discussing community dynamics and exploring complex network structural parameters. We put forward structural and functional models for analyzing complex networks under situations of perturbations. We introduce modified adjacency matrix and modified Laplacian. We further introduce network or degree centrality (weighted Laplacian centrality) based on modified Laplacian, weighted micro-community centrality. We discuss its robustness and importance for micro-community detection for social and technological complex networks with overlapping communities. We also introduce ’k-clique sub-community’ overlapping community detection based on degree and weighted micro-community centrality. The proposed algorithms use optimal partition of k-clique sub-community for modularity optimization. We establish relationship between degree centrality and modularity. This proposed method with modified adjacency matrix helps us solve NP-hard problem.
Keywords: Community; Big data; Complex network; Laplacian; Centrality; Robustness; Modularity
Introduction
The last decade has witnessed the birth of a new field of interest and research in the study of complex networks, i.e. networks whose structure is irregular, complex and dynami-cally evolving in time, with the main focus moving from the analysis of small networks to that of systems with thousands or millions of nodes, and with a renewed attention to the properties of networks of dynamical units. Networks are all around us, and we are ourselves, as individuals, the units of a network of social relationships of different kinds and, as biological systems, the delicate result of a network of biochemical reactions. Networks can be tangible objects in the Euclidean space, such as electric power grids, the Internet, highways or subway systems, and neural networks. Or they can be entities defined in an abstract space, such as networks of acquaintances or collaborations between individuals [1].
© 2015 Chopade and Zhan. This is an Open Access article distributed under the terms of the Creative Commons Attribution License (http://creativecommons.org/licenses/by/4.0), which permits unrestricted use, distribution, and reproduction in any medium, provided the original work is properly credited.
tion, highway, traffic networks, centrality plays a somewhat different role than in social networks [4].
In this paper we discuss structural and functional analysis of complex technological and social networks. First we discuss various existing structural analysis parameters. Major contribution of this work is modified relationship between adjacency and Lapla-cian matrix. We use this modified relationship to define new degree centrality and new modularity. Using these new degree centrality and new modularity we are able to detect micro level overlapping community structures. We introduce network or degree centrality (weighted Laplacian centrality) based on modified Laplacian, weighted micro-community centrality and discuss its robustness and importance for micro-micro-community detection for social and technological complex networks with overlapping communities. We also introduce ‘k-clique sub-community’ overlapping community detection based on degree and weighted micro-community centrality. These new matrices and algorithms are helpful for identifying hidden level vulnerabilities. First we review various complex net-work structural parameters. We further put forward new community detection based on network or degree centrality. In the “Background and literature review” section, we review and discuss existing community detection methods and algorithms. The “Research design and methodology” section discusses about community dynamics, research approach and complex network structural parameters. The “Methodology” section discusses analysis of unweighted, weighted networks (functional analysis), where we introduce modified rela-tionship between adjacency, degree and Laplacian matrices. Using this we define weighted Laplacian centrality, weighted micro-community centrality and related algorithms. We also discuss and introduce algorithm fork-clique sub-community and optimal partition ofk-clique sub-community for weighted modularity optimization and overlapping com-munity detection. Next section, we analyse real world complex networks and carry out comparison of different community detection algorithms. Lastly we discuss computa-tional complexity of our proposed algorithms and conclude the paper with major findings and future works.
Background and literature review
Community detection is a fundamental component of network analysis for sensor systems and is an enabling technology for higher level analytical applications such as behav-ior analysis, prediction, and identity and pattern-of-life analysis [2]. In both commercial industry and academia, significant progress has been made on problems related to the analysis of community structure; however, traditional work in social networks has focused
on static situations (i.e., classical social network analysis) or dynamics in a large-scale sense (e.g., disease propagation) [2].
Communities are of interest for a number of reasons. They have intrinsic interest because they may correspond to functional units within a networked system [5]. The aim of community detection in graphs is to identify the modules and, possibly, their hierarchical organization, by only using the information encoded in the graph topology. Community detection is important for other reasons, too. Identifying modules and their boundaries allows for a classification of vertices, according to their structural position in the modules. So, vertices with a central position in their clusters, i. e. sharing a large num-ber of edges with the other group partners, may have an important function of control and stability within the group; vertices lying at the boundaries between modules play an important role of mediation and lead the relationships and exchanges between different communities [6]. Fortunato [6] discussed various crucial issues of community detection like the significance of clustering and its application to real networks. This paper trig-gered a big activity in the field, and many new methods have been proposed in the last years.
With the aim at explaining and comprehending common principles and properties in real networks, three general network models have been intensely researched: ran-dom network [7], small-world network [8] and scale-free network [9], though these models cannot interpret all phenomena observed in real networks. Random network has binomial or Poisson degree distribution [10], so random network is rather robust since it is a homogeneous network where majority of vertices almost have the same number of edges to be connected. However, real networks do not show random distri-bution and properties. Small-world is a network between a lattice and random networks. Small-world network has smaller average path length like a random network but larger clustering coefficient like a lattice network. Rather unexpectedly, the degree distribu-tion of small-world network is mathematically explained by binomial distribudistribu-tion that is same as random network. Besides, most of real networks have the degree distribu-tion that is power law [11] rather than Poisson distribudistribu-tion and these networks are called as scale-free network which is sensitive to intentional removal of vertices but robust against randomly removing vertices because the power law distribution shows it is a heterogeneous network where a larger number of vertices have larger edges to be con-nected and these vertices are called as hubs that play important role in connectivity of networks [12].
Centrality measures the relative importance of a node or a link in terms of the net-work efficiency and utilization of the netnet-work resources. Koschutzki et al. [13] discusses centrality indices based on degree considering distances and neighborhoods as well as shortest paths. Koschutzki et al. presented some of the more influential, ‘classic’ central-ity indices but he did not strive for completeness and provide a catalog of basic centralcentral-ity indices with some of their main applications.
Borgatti [14] claimed that centrality measures can be regarded as generating expected values for certain kinds of node outcomes (such as speed and frequency of reception) given implicit models of how traffic flows. Borgatti regarded the formulas for central-ity concepts like betweenness and closeness as generating the expected values under specific unstated flow models of certain kinds of node participation in network flows. As such, they do not actually measure node participation at all but rather indicate the
is an agglomerative hierarchical clustering method, where groups of vertices are succes-sively joined to form larger communities such that modularity increases after the merging. Greedy optimization method attempts to optimize the “modularity” of a partition of the network. The optimization is performed in two steps. First, the method looks for “small” communities by optimizing modularity locally. Second, it aggregates nodes belonging to the same community and builds a new network whose nodes are the communities. These steps are repeated iteratively until a maximum of modularity is attained and a hierarchy of communities is produced.
By assumption, high values of modularityQ indicate good partitions. So, the parti-tion corresponding to its maximum value on a given graph should be the best or at least a very good one. This is the main motivation for modularity maximization, by far the most popular class of methods to detect communities in graphs. An exhaustive opti-mization ofQis impossible, due to the huge number of ways in which it is possible to partition a graph, even when the latter is small. Besides, the true maximum is out of reach, as it has been recently proved that modularity optimization is an NP-complete problem [17], so it is probably impossible to find the solution in a time growing poly-nomially with the size of the graph. However, there are currently several algorithms able to find fairly good approximations of the modularity maximum in a reasonable time [6].
Integer linear programming algorithms solve the modularity maximization problem for small graphs [16, 18]. Brandes et al. [18] have given an integer linear programming formu-lation for modularity clustering and established that the formal problem is – in the worst case – NP-hard.
Gregori et al. [19] presented a novel, parallelk-clique community detection method, based on an innovative technique which enables connected components of a network to be obtained from those of its subnetworks. The novel method has an unbounded, user-configurable, and input-independent maximum degree of parallelism, and hence is able to make full use of computational resources. Chen et al. [20] introduce two novel fine-tuned community detection algorithms that iteratively attempt to improve the community qual-ity measurements by splitting and merging the given network communqual-ity structure but they did not consider optimal number of clusters or subnetwork or concept of modularity for community detection.
Considering the importance of the community detection problem this work aim to identify hidden layer micro-community, overlapping communities and related functional dynamics by using concept of modified adjacency and modified Laplacian matrices.
Research design and methodology Research design
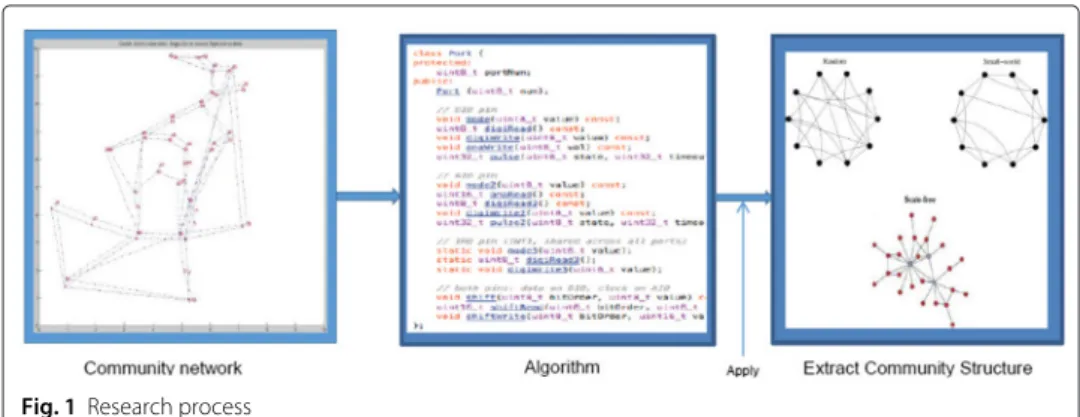
Many social networks exhibit community structure. Communities are groups of nodes that have high connectivity within a group and low connectivity across groups. Com-munities roughly correspond to organizations and groups in real social networks. Figure 1 shows our community detection research process. We will apply our developed algorithm for large-scale big data networks. This algorithm will explore or extract dif-ferent community structures which will represent properties of real networks such as random, small world and scale-free network.
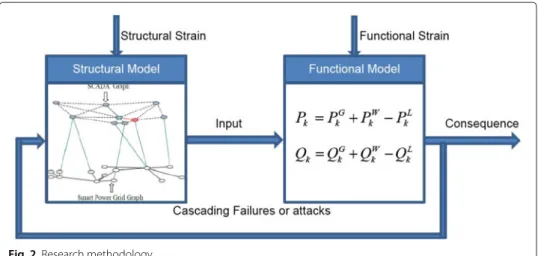
Figure 2 shows research methodology which holds true for any type of network. Here, the aim of network analysis is to study how the performance of networks is affected by the removal of vertices and edges, to compare the structure of different networks, and to analyse how the change of structure affects the vulnerability of networks.
Complex network structural parameters
Structural parameters are the tools of Complex Network Analysis which are of useful to understand salient properties of complex systems. Some of the important local and global structural parameters are discussed below
Node degree distributions, correlations and assortativity
The degree (or connectivity)kiof a nodeiis the number of edges incident with the node. It is defined in terms of the adjacency matrixAas given bykiin = Aij. For directed network total degree is sum of in-degree of node and out-degree of node given with Eqs. 1 to 3. kiin= j∈N Aij (1) kouti = j∈N Aji (2) ki=kiin+kiout (3)
The degree distribution, usually denoted byP(k), is the probability that a vertex chosen uniformly at random has degreek, or equivalently, the fraction of vertices in the network with degreek. In many real networks it has been found that the degree distribution follows a power-law, i.e.P(k)~k−α, whereαis the scaling coefficient, it is typically between 1 and
Fig. 2Research methodology
3 [21]. A large number of real networks are correlated in the sense that the probability that a node of degreekis connected to another node of degree, sayk depends onk. The degree correlations are formally characterized byP(k|k). Some networks (including the Internet and the World Wide Web) have degree distributions in the form of a power law: that is, the probability that a node has degreekis given asP(k)~k−α[22]. Assortativity is the correlation between the degrees of connected nodes. Positive assortativity indicates that high-degree nodes tend to connect to each other.
Shortest path lengths or characteristics path length
Average path length is the distance between two vertices is defined as the number of edges along the shortest path connecting them. Many complex networks, despite their often-large size, have a relatively short average path length between any two vertices.
Let the community network be represented as a graph Gn = {V,E} with N nodes, V = {vi}is the set of vertices andEthe set of edges. Denote byd(vi,vj)=dijthe shortest path lengths (shortest distance) connecting two nodesiandjin the community network. The average path lengthlis given by,
l= 1 N(N−1)
i,j
dij (4)
The community network is divided into two subcommunities,Gc1 representing the sub-community 1, andGc2representing the subcommunity 2. Then the interdependent struc-tural efficiencyX(Gc1∩Gc2)of the community network can be defined as follows [23]:
XGc1∩Gc2 = 1 Nc1.Nc2 i∈Gc1 j∈Gc2 1 dij (5)
whereNc1is the number of resource nodes in the subcommunity 1, andNc2is the number of nodes in the subcommunity 2.
When two nodes are not connected at all, or become disonnected due to attacks, their shortest path lengthdijbecomes infinite, and then d1ij is zero. IfX
Gc1 ∩Gc2
is large, it is indicated that the network is well connected and has high efficiency [24].
Local and global clustering coefficient
If the nearest neighbours of a node are also directly connected to each other they form a cluster. The clustering coefficient quantifies the number of connections that exist between the nearest neighbours of a node as a proportion of the maximum number of possible con-nections [8]. Interactions between neighbouring nodes can also be quantified by counting the occurrence of small motifs of interconnected nodes [25]. The distribution of different motif classes in a network provides information about the types of local interactions that the network can support [26].
The local clustering coefficient (Cliques): For the modular network cliques (or similar measures) identify interesting sub-components of the network. This metric can help to identify functionally related genes/proteins in the network. The local clustering coeffi-cient,CCi, of a vertexiis the ratio between the actual number of edges that exist between the vertex and its neighbors and the maximum number of possible edges between these neighbors. TheCCiof the network is defined as:
CCi(local)= mi ki(ki−1)/2
(6) HereCCiis thelocal clustering coefficient,miis the number of edges that exist between the neighbors of vertexiandkiis the number of neighbors for vertexi. The denomina-torki(ki −1)/2 is the maximum possible number of edges that can exist between the neighbors of vertexi.
The global clustering coefficientCCis the ratio of the number of triangles in a network versus the number of paths of length 2. This ratio is typically high in social networks, whose generative processes tend to close triangles. In contrast, the clustering coefficient is close to 0 for random graphs.
The global clustering coefficient,CCof the network is defined as: CC(global)= 1 N i∈V CCi= 1 N i∈V mi ki(ki−1)/2 (7) N represents the number of vertices or the number of nodes in the network. A gen-eral problem of network measures, such as the clustering coefficient, is whether sampling or perturbations change the values of these measures. Network measures are frequently used for the classification of different networks [27] or of topological changes (addition or deletion of nodes or edges) within the same network.
Network centrality and robustness
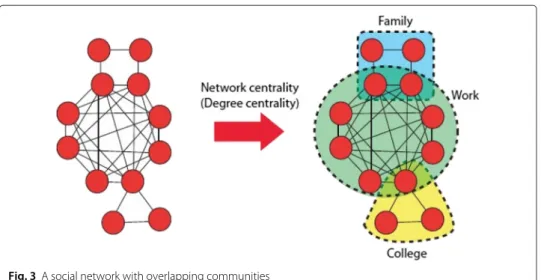
The structure of many networks is governed by latent communities or clusters. For exam-ple, in a social network, people which are part of the same latent community are more likely to be friends and therefore be connected in the network. Very often it is useful to learn these latent communities in order to better understand the structural composition of a network. The challenge is then to figure out how to use the available network data to find these latent communities. Social networks have the added complexity that very often the users belong to multiple communities, so there is considerable overlap in the commu-nities. For example, in Fig. 3, we show a social network where there are three overlapping communities: people from work, family, and college. This type of overlapping community structure is very common in social networks, so finding the community structure is more complex than simply partitioning the network into disjoint communities.
Fig. 3A social network with overlapping communities
Centrality measures are used in network science to rank the relative importance of ver-tices and edges in a graph. Within graph theory and network analysis, there are various measures of the centrality of a vertex or an edge. Centrality indices are quantifications of the fact that some nodes/edges are more central or more important in a network than others [28]. Our algorithm uses the network centrality known as degree centrality to find overlapping community structure.
Degree centrality The simplest centrality for a vertex is its node degree, i.e., the total number of edges incident upon a node. This centrality represents the connectivity of a node to the rest of the network and reflects the immediate chance for a node to exert its influences to the rest of the network or to be exposed to whatever is flowing through the network, such as disturbances, shared information, power or traffic flows, or even a virus. For a graph withGn = {V,E}, whereV represents the set of vertices andE the set of edges, given its LaplacianL the degree centrality of a vertex or node is defined as [28], CDi = Di 2nE = Lii 2nE (8) Where 2nE is used as a normalization factor. In order to make better comparisons between graphs of different sizes the degree is standardized by dividing by 2nE, the maximum possible degree of any node.
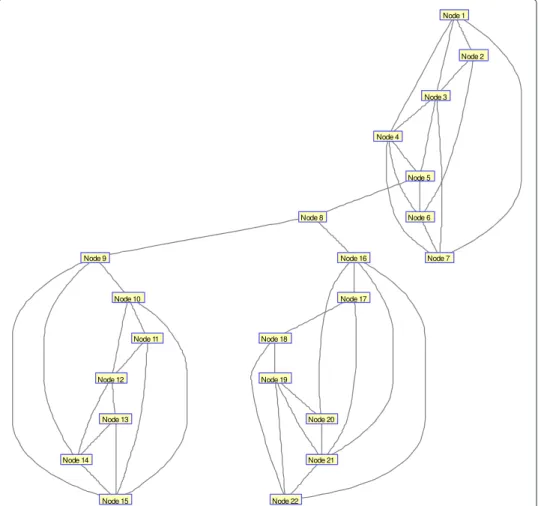
Robustness refers either to the structural integrity of the network following deletion of nodes or edges or to the effects of perturbations on local or global network states. As shown in example network in Fig. 4 node 8 is most central but not robust. Network robustness and centrality plays vital role under circumstances of perturbations [28, 29]. Modularity
The modularity is the fraction of edges that fall within communities, minus the expected value of the same quantity if edges fall at random without regard for community structure [30]. Several optimization methods attempt to optimize the “modularity” of a partition of the network [30]. Many complex networks consist of a number of modules. Each module contains several densely interconnected nodes, and there are relatively few connections between nodes in different modules. Hubs can therefore be described in terms of their
Fig. 4Example network for indentifying network robustness and centrality. (Central, but not robust or powerful)
roles in this community structure [22]. Provincial hubs are connected mainly to nodes in their own modules, whereas connector hubs are connected to nodes in other modules as shown in Fig. 5 [22].
Network density or cost
Network or Connection density is the actual number of edges in the graph as a proportion of the total number of possible edges and is the simplest estimator of the physical cost, for example, the energy or other resource requirements, of a network.
We use above discussed complex network structural parameters for supervised com-munity detection. Research methodology and algorithms are discussed in next section. Methodology
As briefly discussed in the “Background and literature review” section, our research process and methodology consists of structural and functional analysis. To account for structural analysis we already discussed various complex network structural parameters in the “Research design and methodology” section.
Analysis of unweighted network (structural analysis)
A network can be defined as an object composed of elements and interactions or connec-tions between these elements. A graph,Gn(V,E), made up of node set,V, and link set,
Fig. 5Supervised community detection process [22]
E, is a natural means to model networks mathematically. Consider a graph withNnodes andmlinks or edges. The line-node incidence matrix of the network, is anm×N, matrix Mwhere thelthedge is connected between nodesiandjif and only if
M: ⎧ ⎪ ⎨ ⎪ ⎩ Mli= 1 Mlj= −1 Mlk = 0, withk=iorj (9)
The Laplacian matrixLof the network [31], with sizeN×N, can be obtained as
L=MTM (10) Then Lij: ⎧ ⎪ ⎨ ⎪ ⎩
−1, if there exists linki−j, forj=i k withk= −j=iLij, forj=i 0 otherwise
(11)
with i,j = 1, 2,· · ·, N. Moreover, L is positive-semidefinite, real symmetric and the elements of every row (or column) add to zero. Alternatively:
L=D−A (12)
A normalized Laplacian is stated as
−
whereD=diag(L)is the diagonal degree matrix of the network, matrixDbe defined as Dij=
D(i) fori = j
0 otherwise (14)
andAis theN×Nadjacency matrix. The adjacency matrix can be written as Aij:
1 if there is an edge from vertexito vertexj,
0 if there is no edge from vertexito vertexj. (15) HereAij=kif there arekparallel edges fromitoj. Moreover,Di≥0,Dii=number of edges connected to nodei. Note that the diagonal elements of the Laplacian are assumed to be positive.
Eigenvalues of matrices in a graph, especially the adjacency matrix, the Laplacian matrix and the normalized Laplacian matrix reflect structural properties about the graph. For instance, adjacency matrix is useful for counting paths of certain length in a graph, num-ber of spanning trees and connected components can be determined from the Laplacian, and the normalized Laplacian enables recognition of connected components and bipartite structures [32].
Analysis of weighted networks (functional analysis)
For a purely topological representation of a simple graph (with no parallel or self loops), the graph-theoretic matrices satisfy the following properties.
• The adjacency matrixAis real, symmetric, and zero on the diagonal, with entries being either 0 or 1. Since the trace is zero, then some of the eigenvalues must be positive and others must be negative, and hence this matrix is not sign-definite. It is obtained from the Laplacian matrix after zeroing its diagonal elements.
• The Laplacian matrixLis real symmetric and the sum of each row is zero. The diagonal elements are nonnegative, and the off-diagonal elements are nonpositive, either 0 or -1.
• The degree matrixDis a matrix with diagonal elements equalling either 0 or 1. If parallel links are allowed between nodes, then nonzero entries can have integer values higher than 1 but of the same sign. If self loops are allowed, the adjacency matrix can have nonnegative integer diagonal elements. In any case, the matrices are related by Eq. 12, L=D−A.
Here we lift the restriction that the elements be binary or integers, thus leading to definitions of thepseudo-adjacency,pseudo-Laplacian, andpseudo-degree matrices. We will use the above guidelines to definepseudo-adjacency, pseudo-Laplacian, and
pseudo-degree matricesfor the weighted networks. The value of weights considered as power flow in smart grid network, signal or data flow in communication or data networks, information flow in social networks, money flow or transactions in financial networks, traffic flow in internet networks, money, weapons, drugs transactions in terrorists net-work etc. These matrices are required to maintain the basic structure and property of their graph-theoretic counterparts. In particular:
• The pseudo-adjacency matrixA˜is real, symmetric, and zero on the diagonal, with nonnegative entries. Since the trace is zero, then some of the eigenvalues must positive and others must be negative, and hence this matrix is not sign-definite.
−
L=D−12LD−12 (17)
−
L=I−D−12AD−12, (18)
whereIis anN×Nidentity matrix (with ones on the diagonal, other elements being zero). Normalized Laplacian in matrix form is written as
− Lij: ⎧ ⎪ ⎪ ⎨ ⎪ ⎪ ⎩ 1, ifi=j, −√1 kikj ifij∈E, 0 otherwise (19)
The LaplacianLof a directed network is defined asLD LD=D− 1 2 O AD −1 2 I , (20)
whereDois the diagonal matrix of out-degrees (or row sum ofA) andDIis the diagonal matrix of in-degrees (or column sum ofA).
For adirected weightednetworks Eq. 20 is written as
˜ LD= ˜D− 1 2 O A˜D˜ −1 2 I , (21)
whereA˜ is weighted adjacency matrix of directed networks,D˜Ois the weighted diagonal matrix of out-degrees (or row sum ofA) and˜ D˜I is the weighted diagonal matrix of in-degrees (or column sum ofA).˜
For incorporating functional analysis in order to consider flow or functional dynamics in the network we proposed modified relationship between adjacency and Laplacian of a graph given by Eq. 16.
This modified relationship turns modularity maximization into a spectral graph par-titioning problem using the modified Laplacian matrix. A nice feature of the modified Laplacian is that, for graphs which are not too small, it can be approximated (up to con-stant factors) by the transition matrixA˜x, obtained by normalizingA˜such that the sum of the elements of each row equals one.
Weighted Laplacian centrality
Using modified relationship obtained in Eq. 16 we then obtained modified network or degree centrality as given by Eq. 22.,
CDi F = (L˜)ii 2nE
(22) Using Eq. 22 we will get centrality of the functional network. We used this functional degree centrality to determine robustness of the network.
Definition 1.(Micro-Community). The micro-community is a small dense group or a sub-graph or isolated node that consists of one or more connected dense network or pairs with certain energy.
Network energy is defined as: the sum of the absolute values of the real components of the eigenvalues, ne(Gn)= N i=1 |λi| (23)
For a networkGn(V,E), the local micro-communityμc
μc=c(l1)=(Vl1,El1,nel1) (24)
whereVl1vertices of sub or dense network,El1edges of sub or dense network andnel1is the energy of local sub or dense network.
The micro-community clustersμccare given by
μcc= {c(l1),c(l2),c(l3), ...c(ln)} (25) For a given community network, to partition it into a certain number of smaller sub-communities or number of subsets, calledclusters.
Weighted micro-community or sub-community centrality
Smaller sub-communities are given more weight than larger ones, which makes this mea-sure appropriate for characterizing network motifs. The sub-community centrality can be obtained mathematically from the spectra of the weighted adjacency matrix of the network. The sub-community centrality of a node is a weighted sum of closed walks of different lengths in the network starting and ending at the node. This function returns a vector of sub-community centralities for each node of the network [33, 34].
Definition 2.(Micro-Community Centrality).
For a graph,Gn(V,E), letv1,v1,...vN be an orthogonal basis ofRNcomposed by eigen-vectors of weighted adjacency matrixA˜ associated to the eigenvaluesλ1,λ2,...λN.Letvij denote theithcomponent ofv
j.For alli ∈V, the sub-community centrality is expressed
as [33], CSi F= n i=1 vij2eλj (26)
For all methods and approaches discussed above Micro-Community Centrality (MCC) network robustness algorithm is developed. Overall process of MCC is described in Algo-rithm 1. For any given large-scale community networkGn. First it identifies type of net-work i.e. Directed Unweighted (DU), Directed Weighted (DW), Undirected Unweighted (UU), Undirected Weighted (UW). As per the type of network then it calculates all required statistical parameters from adjacencyA, LaplacianLand degree matricesDand similarly for weighted matrices i.e.A,˜ L, and˜ D˜ etc. Then it calculates network energy, micro-community and micro-community clusters. With these parameters it then cal-culate weighted Laplacian centrality and weighted micro-community centrality. Using algebraic connectivity it check for robustness of the network i.e. whether network is strongly connected or weakly connected.
8: Avg. Degree Distribution, 9: Degree matrix D, 10: L←D−A, andL˜← ˜D− ˜A 11: LD←D− 1 2 O AD −1 2 I , and L˜D= ˜D −1 2 O A˜D˜ −1 2 I , 12: λ2(L),Avg. path length l,Shortest path length dij, 13: Local clustering coefficient CCi(local),
14: Global clustering coefficient CC(global),
15: Network Energy ne(Gn),Micro-communityμc,Micro-community clustersμcc 16: Weighted Laplacian centralityCDi F = (L˜)ii
2nE 17: Weighted Micro-Community CentralityCiSF
18: arranged v1,v1,...vNby the descending order of their 19: micro-community centrality C1S,CS2, , ...CNS.
20: Check forthe Network Robustness
21: EV=sort ( L,descend); 22: N =length( Gn) 23: eps=0.01;
24: if (N >=2)&&(abs(EV(N)) <eps) 25: Algebraic Connectivity=EV(N−1); 26: return; 27: else 28: Algebraic Connectivity= −1; 29: return; 30: end 31: return;
K-clique sub-community: degree and weighted micro-community centrality based overlapping community algorithm
Most real networks typically contain parts in which the nodes (units) are more highly connected to each other than to the rest of the network. The sets of such nodes are usu-ally called clusters, communities, cohesive groups, or modules [35]. Most real networks are characterised by well defined statistics of overlapping and nested communities. Such a statement can be demonstrated by the numerous communities each of us belongs to, including those related to our scientific activities or personal life (family, work, college) and so on [35], as illustrated in Fig. 3.
Definition 3.A typical community consists of several complete (fully connected) sub-communities that tend to share many of their nodes. Thus, we define a sub-community, or more precisely, a k−clique-sub community as a union of all k−cliques (complete subgraphs of sizek) that can be reached from each other through a series of adjacent k-cliques (where adjacency means sharingk−1 nodes).
Proposed algorithms (Algorithm 2 and 3) firstly extracts all complete weighted sub-communities of the network that are not parts of larger complete sub-communities. A maximal clique is a clique that is not a subset of any other clique in a community network [36]. These maximal complete subgraphs are simply called cliques, and the dif-ference betweenk-cliques and cliques is thatk-cliques can be subsets of larger complete sub-communities. Once the cliques are located, the clique-clique overlap matrix is pre-pared [37]. In this symmetric matrix each row (and column) represents a clique and the matrix elements are equal to the number of common nodes between the corresponding two cliques, and the diagonal entries are equal to the size of the clique. The intersection of two cliques is always a complete sub-communities. Thek-clique-communities for a given value ofkare equivalent to such connected clique components in which the neigh-bouring cliques are linked to each other by at leastk−1 common nodes. Advantage of this method is that the clique-clique overlap matrix encodes all information necessary to obtain the communities for any value ofk, therefore once the clique-clique overlap matrix is constructed, thek-clique-communities for all possible values ofkcan be obtained very quickly [35]. Algorithm 2 describes the process of finding maximums-sizek-cliques in the community network. It uses degree sequence for finding largest possible clique size.
Algorithm 2Maximums-sizek-cliques in the community network
Input:Gnthe initial network (Dataset)
Returns:Maximums−sizek-cliques 1: Number of nodes N =size(Gn, 1)
2: Find the largest possible clique size via the degree sequence 3: Let{d1,d2, ...,dk}be the degree sequence of a graph. 4: The largest possible clique size of the graph is the 5: maximum value k such that dk>=k−1 6: degree_sequence = sort(sum(Gn, 2)−1,’descend’); 7: smax=0; 8: fori=1 :length(degree_sequence) 9: if degree_sequence(i) >=i−1 10: smax=i; 11: else 12: break; 13: end 14: end 15: cliques = cell(0); 16: fors=smax:−1 : 3 17: Gnaux=Gn; 18: forN=1 :Nbn
29: Gnaux(:,N)=0; 30: end
31: end
For detecting overlapping communities Algorithm 3 is developed. It uses weighted adja-cency matrix, weighted micro-community centrality and maximums-size k-cliques in the community network (With Algorithm 2). First it generates the clique-clique overlap matrix. Then extracts thek-clique matrix kMfrom the clique-clique overlap matrix and k-clique sub-communitiesccfrom thek-clique matrixkM.
Algorithm 3Overlapping community detection
Input:Gnthe initial network (Dataset)
Returns:k-clique sub-communitiescc, all cliques,k-clique matrixkM 1: Number of nodes N=size(Gn)
2: Compute Weighted micro-community centrality(CiS)F
3: (CiS)s=sort( CiS,’descend’)
4: Find all maximum s-size k-cliques in the community network using Algorithm 2 5: Generating the clique-clique overlap matrix
6: kM=length(cliques) 7: forc1=1: length(cliques)
8: forc2=c1:length(cliques)
9: if c1=c2
10: kM(c1,c2)=Number of array elements(cliques{c1});
11: else
12: kM(c1,c2)=Number of array elements(cliques{c1} ∩cliques{c2}));
13: kM(c2,c1)=kM(c1,c2);
14: end
15: end
16: end
17: Extracting the k-clique matrix kM from the clique-clique overlap matrix 18: Off-diagonal elements<=k−1→0
19: Diagonal elements<=k→0
20: Extracting components (or k-clique sub-communities cc) from the k-clique matrix kM 21: Sub-community cc=[ ] ;
23: linked_cliques = find(kM(i, :)==1); 24: new sub-community ccn=[ ] ;
25: forj=1 :length(linked_cliques)
26: new sub-community ccn=( ccn∪cliques{linked_cliques( j)});
27: end 28:: found = false; 29: if ~isempty ( ccn) 30: forj=1 :length(cc) 31: ifall(ismember(ccn,cc{j})) 32: found = true; 33: end 34: end 35: if ~found 36: cc=[cc;{ccn}] ; 37: end 38: end 39: end
Modified weighted mudularity: optimal partition of k -clique sub-community
We then used weighted adjacency matrixA˜ to derive functional modularity of the net-work. For a simple, undirected graphGnand a partitionCwith a given number of groups or number of communitiesn, the modularity measureQ(Gn,C)is defined as [38]:
Q(Gn,C)= n i=1
(eii−a2i) (27)
where the network is fully subdivided into a set of nonoverlapping communities n, andeij is the proportion of all links that connect nodes in communityiwith nodes in communityj. with eij= vx∈Ci vy∈CjAij 2|E| (28)
where A adjacency matrix which is symmetric and set of edges E. With modified adjacency matrixA, Eq. 28 changes to˜
eij= vx∈Ci vy∈Cj(A˜)ij 2|E| (29)
and the proportion of edges with at least one node in the communityiis given by ai=
j
eij (30)
e: TheN×Nsymmetric weighted matrix of the partitionC. eij: The fraction of edges between clustersCiandCj.
eii: The fraction of edges in clusterCi. (i.e. the porportion of edges that connect vertices inside communityCi).
Assuming the network is divided intoncommunities. Let us defineCi andCjbe the communities which belong to verticesiandjrespectively. Nodeibelong to community
Pij= i j
2m (33)
wherekikjare degrees of vertexiand vertexj.
The actual number of edges falling between a particular pair of verticesiandjisAij. The modularity matrix is defined as
Bij=Aij− kikj
2m (34)
Alternatively Eq. 34 can be written as
Bij=Aij−Pij (35)
Important property of modularity matrix is that all rows (and columns) of the modular-ity matrix sum to zero i.e.,
j Bij= j Aij− j Pij=ki−ki=0 (36)
Like Laplacian matrix for any network the vector(1, 1, 1, ...) is an eigenvector of the modularity matrix with eigenvalue zero but the eigenvalues of the modularity matrix are not necessarily all of one sign i.e. matrix has both positive and negative eigenvalues [39].
Modularity measures the non-randomness of a graph partition. Higher values of the modularity indicate stronger community structures. The modularity maximization problem is then:
max
P∈Q(Gn,C) (37)
Then the MaxModularity can be written Qmax= 1 2m ij Aij−Pij δ(Ci,Cj), (38) Qmax= 1 2m ij Bij δ(Ci,Cj), (39)
Using weighted adjacency matrix weighted modularity can be written as
QWmax= 1 2m ij ⎡ ⎣A˜ij− ~ ki ~ kj 2m ⎤ ⎦δ(Ci,Cj), (40) wherek~iand ~
For directed weighted network modularity is given as → Q W max= 1 2m ij ⎡ ⎢ ⎣A˜ij− ~ kiI ~ kOj 2m ⎤ ⎥ ⎦δ(Ci,Cj), (41)
A measure for the modified modularity is proposed to quantify the overlapping com-munity structure referred asQWM (Weighted modified modularity). With the measureQWM, the overlapping community structure can be identified by finding an optimal partition ofk-clique sub-community, i.e., the one with the maximumQWM. TheQWM is based on a maximal clique view of the original network. A maximal clique is a clique (i.e. a complete subgraph) which is not a subset of any other clique in a network. The maximal clique view is according to a reasonable assumption that a maximal clique cannot be shared by two communities due to that it is highly connective. To find an optimal partition, we construct a maximal clique network from the original network. We then prove that the optimization ofQWMon the original network is equivalent to the optimization of the mod-ularity on the maximal clique network. Thus the overlapping community structure can be identified through partitioning the maximal clique network with an efficient modularity optimization algorithm [40].
The proposed overlapping community structure based on optimal partition ofk-clique sub-community is stated as → Q W Mmax= 1 2m ij 1 Ci,Cj ⎡ ⎢ ⎣A˜ij− ~ kiI ~ kjO 2m ⎤ ⎥ ⎦, (42)
where Ci,Cj are the number of overlapping communities to which node i and nodej belongs. High value of→Q
W
Mmaxindicates a significant overlapping community structure.
In our implemented Algorithm 4 given below we used Fast Newman Greedy algo-rithm for modularity optimization [41] with modified functional parameters. In order to efficiently detect community structure using complex network structural and func-tional parameters listed above we developed an Algorithm 5 for modified modularity for overlapping community detection.
Algorithm 4Modularity maximization 1: Gn(V,E)the initial network
2: repeat
3: Put each node of Gnin its own community
4: Calculate QWfrom pairs of connected communities
4: whilesome nodes are moveddo
5: forall N node of Gndo
6: place N in its neighboring community including its own
7: whilemaximal QW>0do
8: select the maximal QW,join the pair of communities with the maximal QW 9: which maximizes the modularity gain QW
10: update theQWmatrix
11: end while
It measures modularity variation for each candidate partition where pair of clusters are merged. It merges the pair of clusters by maximizing modularityQusing Algorithm 4. So for each formed clusters it splits community and then updates correspondingQ. For each sub-community then it measures sub-community energyne, micro-community central-ity using overlapping communcentral-ity detection Algorithm 3. Then it selects sub-communcentral-ity with highestQand highestneto findk-cliques sub-community network to form micro-community clustersμcc. These micro-community cluster formation continues till value ofQis 0 i.e. leading eigenvalue is zero which means that subgraph is indivisible. Overall process of modified modularity for overlapping community is described in Algorithm 5.
Algorithm 5Modified modularity for overlapping community detection (MMOC)
Input:Gnthe initial network (Dataset)
Returns:Community Clusterscc 1: Identify type of network
2: Directed Unweighted (DU), Directed Weighted (DW), 3: Undirected Unweighted (UU), Undirected Weighted (UW) 4: As per the type of network
5: ComputeCommunity c and Modularity QW
6: Apply overlapping community detection (Algorithm 3) 7: Apply modularity optimization (Algorithm 4)
8: Measure modularity variation QWfor each candidate 9: partition whereapair of clusters are merged
10: Compute→Q
W Omax
11: Repeat
12: foreach clusters 13: →Q
W
Omax←Merge the pair of clusters maximizing QW
14: Update→Q W
Omax←Split c
15: if QW =0
16: (leading eigenvalue is zero, subgraph is indivisible)then
17: break;
18: end if
19: end for
This modified modularity for overlapping community algorithm has several advantages. First, its steps are intuitive and easy to implement. Moreover, the algorithm is extremely fast, i.e., network simulations on large-scale ad-hoc modular networks found that its com-plexity is linear on typical and sparse data. Experimental evaluation of these algorithms for complex technological networks and social networks are discussed in next Section “Analysis of real-world large-scale complex networks”.
Results and discussion
Analysis of real-world large-scale complex networks
In this section we analyze real world large-scale complex network using proposed algo-rithms discussed above. We used MATLAB version R2015a [42] with Intel, Xeon(R) 2.60 GHz, 256 GB RAM 2 processors, GPU Quadro K6000 and Tesla K20c for running these algorithms. In a simple random graphGn, degree will have a Poisson distribution, and the nodes with high degree are likely to be at the intuitive center. Deviations from a Poisson distribution suggest non-random processes, which is at the heart of current “scale-free” work on networks. Figure 6 shows degree distribution of directed weighted Facebook social network with 1899 nodes and 20296 links [43].
Figure 7 shows degree centrality for directed Amazon product co-purchasing network from March 2, 2003 with 262111 nodes and 1,234,877 links [43]. As shown in this figure network follows the power law of scale free network.
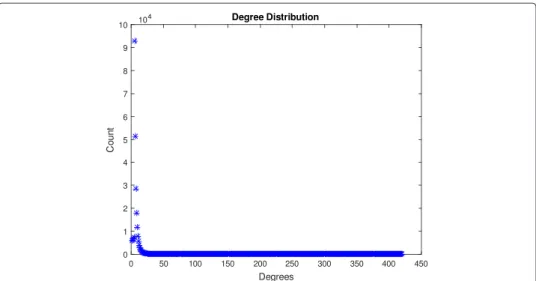
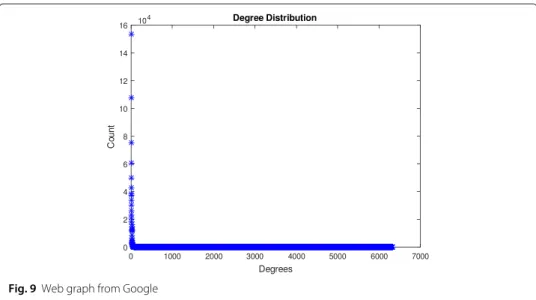
Centrality measures and power have become common emphasis for world city network research and frequently serve as tools for describing cities’ position or status in the sys-tem. We experimented weighted bipartite graph of world city network. Figure 8 shows the out degree distribution for world city system. Figure 9 shows degree distribution of directed web graph from Google (Data obtained in 2002) with 916428 nodes and 4333051 links [43]. Node represent web pages and directed edges represent hyperlinks between them.
Then we experimented with other real-world complex networks including complex critical infrastructure U.S. WECC power grid with 4941 nodes and 6594 links [44, 45] and other social community, as well as citation networks. For these networks we applied
Fig. 7Degree centrality for directed Amazon product co-purchasing network
MMOC and other algorithms (Algorithms 1 to 5 and parameterk = 3). Table 1 shows analysis for these networks. As seen from the results MMOC algorithm plays major role in overlapping community detection in complex networks. We can see relationship of alge-braic connectivityacand network energyne. These values shows how strong or how weak the overall network is. This MMOC algorithm plays decisive role for directed weighted, unweighted as well as undirected weighted networks. As seen from results in case of Face-book network with 1899 nodes. (1899 users that sent or received total of 59,835 online messages over 20,296 directed ties among these users) MMOC algorithm identifies 512 communities and 353 overlapping communities based on topics, social areas of interests,
Fig. 9Web graph from Google
etc. Similary for PhD in Computer Science it identifies 189 communities and 4 overlap-ping communities and for SciMet citation network directed multigraph with 3084 nodes and 10413 links it identifies 650 overlapping communities. Overlapping community clus-ters(cc) obtained with MMOC algorithm clearly shows how this algorithm identifies dense, deeper and hidden community structures. For social community networks also we can see the same relationship of algebraic connectivityacand network energyne. Comparison of different community detection algorithms
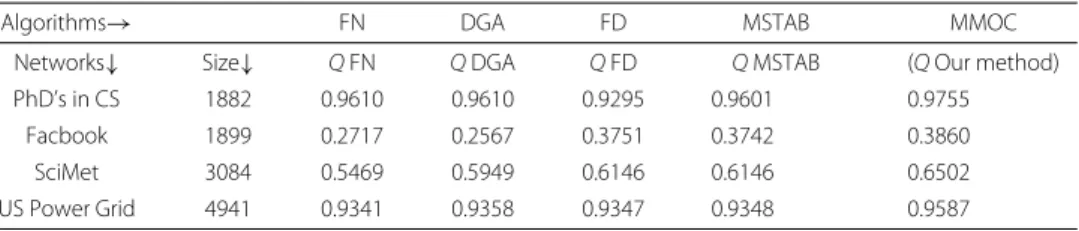
We compared modularity optimization values obtained using MMOC algorithm with other existing algorithms for real world large-scale big data networks as shown in Table 2. We plotted values obtained using different modularity optimization algorithms as shown in Table 2. Figure 10 shows modularity comparison for existing algorithms and with MMOC algorithm (Algorithm 4 and 5).
Table 1Analysis of complex social and technological networks
Networks→ PhD’s CS Facebook SciMet U.S. Power grid
Analysis parameters↓
Type of network Directed Directed weighted Directed multigraph Undirected
V 1882 1899 3084 4941 E 1740 20296 10399 6594 Avg k 40.913 5.6962 16.6402 260.0526 CCglobal 0.0051 0.1107 0.1703 0.0801 ac 20.2106 115.9189 77.3748 15.0674 ne 34.18 109.3126 96.1957 35.5106 c 189 512 391 35 cc(oc) 4 353 650 307
V: Number of nodes or vertices,E: Number of links or edges,Avg k: Average node degree,CCglobal: Global clustering coefficient, ac: Algebraic connectivity,ne: Network energy,c: Sub-communities,cc: Overlapping community clusters (Fork-cliques=3)., PhD’s CS: PhD’s in computer science, directed graph with 1882 nodes and 1740 links
Facebook: The Facebook-like Social Network originate from an online community for students at University of California, Irvine. The dataset includes the users that sent or received at least one message (1,899). A total number of 59,835 online messages were set over 20,296 directed ties among these users
SciMet: SciMet citation network directed multigraph with 3084 nodes and 10413 links. US Power Grid: US power grid undirected graph with 4941 nodes and 6594 links (Note: Datasets obtained from iLab Big Data Center, North Carolina A&T State University [43])
Modularity maximization achieved with MMOC algorithm helps for detection of dense, hidden micro level communities. These results clearly indicate the importance of modularity maximization even though it is NP-complete problem.
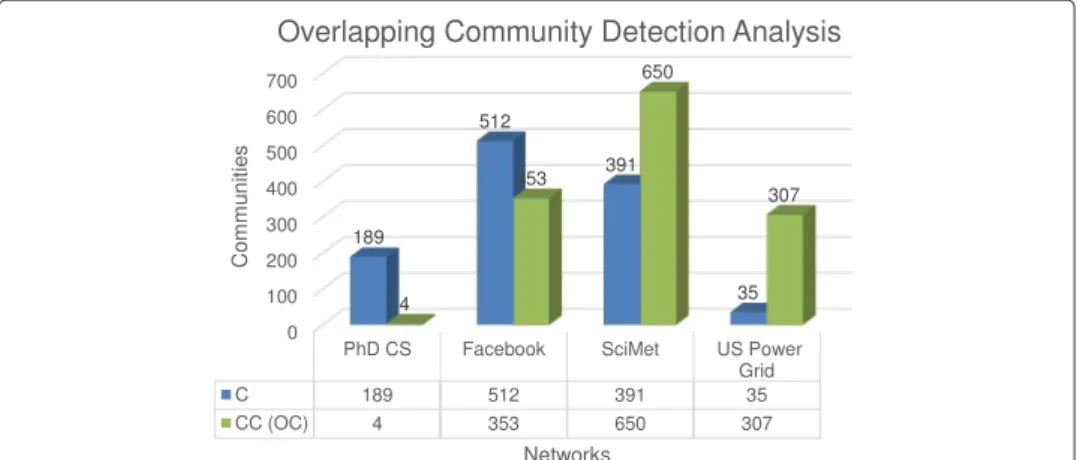
Also for overlapping community analysis shown in Table 1, we plotted comparison based on communities obtained with existing algorithm and overlapping communities clusters obtained with MMOC algorithm. Figure 11 shows overlapping community detec-tion analysis for complex technological and social community networks. These values clearly shows significant difference between base communities and overlapping commu-nities for both complex technological networks as well as social community networks. The parameterkaffects the constituent of the overlapping regions between communities. The choice of the parameterkdepends on the specific networks. Observed from many real world networks, the typical value ofkis often between 3 and 6 [40].
From these results it showed that community centrality appears to have relation with vertices that are central in their local communities. The centrality is correlated with degree, for few overlapping communities they are not perfectly correlated and in par-ticular some vertices have quite high centrality while having relatively low degree. High centrality is an indicator of individuals who have more connections than expected within their neighborhood and hence potentially make a large contribution to the modularity, rather than simply having a lot of connections.
Fig. 11 Overlapping community detection analysis
Computational complexity
The determination of the full set of cliques of a network is widely believed to be non-polynomial problem. In spite of this, proposed algorithm proves to be very efficient when applied to the graphs of the investigated real systems. Our method consists of five stages, finding degree sequence, micro-community centrality, finding out the maximal cliques, constructing the maximal clique network and overlapping community network matrix and partitioning the maximal clique network based on the modularity maximization and then finding overlapping communities.
We analyze the computational complexity of MMOC and other algorithms (Algorithms 1 to 5). Finding an exact solution to a partitioning task of this kind is believed to be an NP-complete problem, making it prohibitively difficult to solve for large-scale net-works, but a wide variety of heuristic algorithms have been developed that give acceptably good solutions in many cases. The first algorithm of the modern age of community detection introduced by Newman and Girvan has a complexityO(N3)on a sparse
net-works and other mentioned existing algorithms for detecting community structures gives qualitatively similar results. Fast implementation of Newman algorithm (Fast Newman algorithm) has worst-case running time ofO((m+N)N), orO(N2)on sparse network withNnodes andmedges. Experimental evaluation on the real-world complex techno-logical and social community networks show that MMOC algorithm achieves the best performance when compared with other existing methods discussed in Table 2. Effi-cient time complexity of MMOC algorithm and other algorithm is O(NlogN) which is scalable in nature. For MMOC algorithm running time is consumed by maximizing modularity and forming overlapping community matrix based on sub-community energy. Also in case of directed weighted networks running time is also consumed by compu-tation of large eigen values. Our method is very efficient on real world networks. In our future work we will work for modifying our MMOC algorithm for better run time performance.
Conclusions
In this paper we have discussed community dynamics and reviewed complex network structural parameters. We highlighted the importance of network centrality or degree centrality and network robustness for community detection. Centrality is correlated with
plexity of our proposed algorithms is better as compared to other existing algorithms. Scalable nature of this algorithm is valuable for analyzing more complex large-scale networks.
It is also an interesting problem about the selection of the parameterkin our method. We will further investigate how to determine an appropriatekfor a given network later. In our future work we will put forward functional dynamics of complex network by incor-porating network centrality and weighted clustering coefficient for identifying micro level communities and their associated relationship.
Competing interests
The authors declare that they have no competing interests.
Authors’ contributions
Dr. Pravin Chopade performed the primary literature review, mathematical modelling, research design, large-scale data collection, programming and experimental evaluation, and also drafted the manuscript. Dr. Justin Zhan supervised Dr. Pravin Chopade to develop the research methodology and computational complexity. All authors read and approved the final manuscript.
Acknowledgment
We are thankful to The United States Department of Defense (DoD) for their support and finance for this project. This work is supported by The United States Department of Defense (DoD grants #W911NF-13-1-0130).
We are also thankful to National Science Foundation (NSF) and National Consortium for Data Science (NCDS). This research was partially supported by the following grants: NSF No. 1137443, NSF No. 1247663, NSF No. 1238767, DoD No. W911NF-13-0130, DoD No. W911NF-14-1-0119, and the Data Science Fellowship Award by the National Consortium for Data Science.
Received: 8 May 2015 Accepted: 12 June 2015
References
1. Boccaletti S, Latora V, Moreno Y, Chavez M, Hwang DU (2006) Complex networks: Structure and dynamics. ELSEVIER Phys Rep 424:175–308
2. Campbell W, Dagli C, Weinstein C (2013) Social Network Analysis with Content and Graphs. MIT Lincoln Lab J 20:62–81
3. Marsden P (2002) Egocentric and sociocentric measures of network centrality. Soc Netw 24:407–422
4. Zio E, Piccinelli R (2010) Randomized flow model and centrality measure for electrical power transmission network analysis. Reliability Eng Syst Saf 95:379–385
5. Newman M (2012) Communities, modules and large-scale structure in networks. Nat Phys 8:25–31. doi:10.1038/NPHYS2162
6. Fortunato S (2010) Community detection in graphs. Phys Rep 486(3–5):75–174 7. Bollobas B (2001) Random graphs. Cambridge University Press 2:1–496
8. Watts DJ, Strogatz DJ (1998) Collective dynamics of ’small-world’ networks. Nature 393:440–442 9. Barabasi A (1999) Emergence of scaling in random networks. Science 286:509–512
10. Newman M (2003) The structure and function of complex networks. Siam Rev 45:167–256 11. Clauset A (2009) Power-Law distributions in empirical data. Siam Rev 51:661–703
12. Crucitti P (2004) Error and attack tolerance of complex networks. Phys Stat Mech Appl 340:388–394
13. Koschutzki D, Lehmann K, Peeters L, Richter S, Renfelde-Podehl D, Zlotowski O (2005) Centrality Indices. Netw Anal Methodol Foundations Springer-Verlag Chapter 3:16–61. doi:10.1007/978-3-540-31955-9-3
15. Blondel V, Guillaume J, Lambiotte R, Lefebvre E (2008) Fast unfolding of communities in large networks. J Stat Mech Theory Exp. doi:10.1088/1742-5468/2008/10/P10008, P–10008
16. Geyer-Schulz A, Ovelgönne M (2014) The Randomized Greedy Modularity Clustering Algorithm and the Core Groups Graph Clustering Scheme. Springer Book Chapter ISBN: 978-3-319-01263-6, eBook ISBN:978-3-319-01264-3, doi:10.1007/978-3-319-01264-3, http://www.springer.com/978-3-319-01263-6
17. Brandes U, Delling D, Gaertler M, Gorke R, Hoefer M, Nikoloski Z, Wagner D (2006) Maximizing Modularity is hard. Cornell University Library, physics data an arXiv:physics/0608255v2:1–10
18. Brandes U, Delling D, Gaertler M, Gorke R, Hoefer M, Nikoloski Z, Wagner D (2008) On modularity clustering. Knowl Data Eng IEEE Trans 20(2):172–188. doi:10.1109/TKDE.2007.190689
19. Gregori E, Lenzini L, Mainardi S (2013) Parallel k-Clique community detection on large-scale networks. IEEE Trans Parallel Distributed Syst 24(8):1651–1660. doi:10.1109/TPDS.2012.229
20. Chen M, Kuzmin K, Szymanski BK (2014) Community detection via maximization of modularity and its variants. Comput Soc Syst IEEE Trans 1(1):46–65. doi:10.1109/TCSS.2014.2307458
21. Sun K (2005) Complex networks theory: A new method of research in power grid. In: 2005 IEEE PES Transmission and Distribution Conference and Exhibition: Asia and Pacific Dalian, China. pp 1–6. doi:10.1109/TDC.2005.1547099 22. Bullmore E, Sporns O (2009) Complex brain networks: graph theoretical analysis of structural and functional systems.
Nat Rev Neurosci 10(3):186–198. doi:10.1038/nrn2575
23. Chopade P, Bikdash M, Kateeb I (2013) Interdependency modeling for survivability of Smart Grid and SCADA network under severe emergencies, vulnerability and WMD attacks. In: Southeastcon, 2013 Proceedings of IEEE, ISBN: 978-1-4799-0052-7. pp 1–7. doi:10.1109/SECON.2013.6567510
24. Chopade P, Bikdash M (2013) Structural and functional vulnerability analysis for survivability of Smart Grid and SCADA network under severe emergencies and WMD attacks. In: Technologies for Homeland Security HST, 2013 IEEE International Conference, ISBN: 978-1-4799-3963-3. pp 99–105. doi:10.1109/THS.2013.6698983
25. Milo R (2002) Network motifs: simple building blocks of complex networks. Science 298:824–827 26. Sporns O, Kötter R (2004) Motifs in brain networks. PLoS Biol 2:1910–1918
27. Amaral L, Scala A, Barthelemy M, Stanley H (2000) Classes of small-world networks. Proc Natl Acad Sci USA 97(21):11149–11152
28. Chopade P (2013) Robustness and survivability of smart power grid and scada networks when subjected to severe emergencies, vulnerability and WMD attacks. In: Doctoral Dissertation, North Carolina Agricultural and Technical State University ACM, ISBN: 978-1-303-68490-6. pp 1–194. http://dl.acm.org/citation.cfm?id=2604359
29. Chopade P, Bikdash M (2012) Analyzing smart power grid and SCADA network robust-ness using the node degree distribution and algebraic connectivity under vulnerability and WMD attacks. In: Homeland Security (HST), 2012 IEEE Conference on Technologies for, IEEE, ISBN: 978-1-4673-2708-4. pp 365–372. doi:10.1109/THS.2012.6459876 30. Chopade P, Zhan J (2014) Community detection in large-scale big data networks. In: ASE International Conference
2014 on BIGDATA, SOCIALCOM, CYBER SECURITY. Stanford University, CA, USA ASE, ISBN: 978-1-62561-000-3. pp 1–7. http://www.ase360.org/handle/123456789/64
31. Biyikoglu T, Leydold J, Stadler P (2007) Laplacian eigenvectors of graphs. Springer Publications Springer, ISBN: 978-3-540-73509-0
32. Baltz A, Kliemann L (2005) Spectral analysis, in network analysis: Methodological foundations. Springer Publications Verlag Berlin Heidelberg Springer, ISSN 0302-9743, ISBN 3-540-24979-6
33. Ernesto E, Juan R (2005) Subgraph centrality in complex networks. Phys Rev E, Am Phys Soc 71:056103–056103. doi:10.1103/PhysRevE.71.056103
34. Estrada E, Desmond H (2010) Network properties revealed through matrix functions. Soc Ind Appl Math SIAM REVIEW 52(4):696–714
35. Palla G, Derenyi I, Farkas I, Vicsek T (2005) Uncovering the overlapping community structure of complex networks in nature and society. Nature 435:814–818. doi:10.1038/nature03607
36. Shen H, Cheng X, Guo J (2009) Quantifying and identifying the overlapping community structure in networks. J Stat Mech 7:P07042–P07042
37. Everett M, Borgatti S (1998) Analyzing clique overlap. Connections INSNA 21(1):49–61
38. Newman M (2006) Modularity and community structure in networks. PNAS 103(23):8577–8582. doi:www.pnas.org/ cgi/doi/10.1073/pnas.0601602103
39. Newman M (2006) Spectral methods for community detection and graph partitioning. Phys Rev E 88:8577–8582. doi:www.pnas.org/cgi/doi/10.1073/pnas.0601602103
40. Shen H (2013) Detecting the Overlapping and Hierarchical Community Structure in Networks. Springer, Community Structure of Complex Networks XIV 120 e-ISBN 978-3-642-31821-4, 042822-1–10. doi:10.1103/PhysRevE.88.042822 41. Newman M (2004) Fast algorithm for detecting community structure in networks. APS Phys Rev E
69(6):P066133–P066133
42. MATLAB (2015) The Mathworks Inc. USA R2015a:0–1. http://www.mathworks.com/
43. iLab (2015) iLab Big Data Center. North Carolina A and T State University 1:0–1. http://www.ilabsite.org 44. NERC (2015) The North American Electric Reliability Corporation. USA 1:0–1. http://www.nerc.com/ 45. WECC (2015) US Power Grid Data. USA 1:0–1. http://www.wecc.biz/
![Fig. 5 Supervised community detection process [22]](https://thumb-us.123doks.com/thumbv2/123dok_us/215031.2520245/10.892.181.717.128.604/fig-supervised-community-detection-process.webp)
![Figure 7 shows degree centrality for directed Amazon product co-purchasing network from March 2, 2003 with 262111 nodes and 1,234,877 links [43]](https://thumb-us.123doks.com/thumbv2/123dok_us/215031.2520245/21.892.178.717.792.1067/figure-degree-centrality-directed-amazon-product-purchasing-network.webp)