SP DISCUSSION PAPER NO. 0012
23086
The Swedish
Pension
Reform
Model:
Framework
and Issues
Edward
Palmer
June 2000
Public Disclosure Authorized
Public Disclosure Authorized
Public Disclosure Authorized
The Swedish Pension Reform Model: Framework and Issues
Edward
Palmer
ce %
The Swedish Pension Reform Model: Framework and Issues
Edward Palmer
Abstract
This paper describes the recent Swedish reform and available options on major issues within this reform framework. In June 1994, Sweden's Parliament passed legislation replacing the old defined benefit system with a combination of a pay-as-you-go notional defined contribution
(NDC) and a DC privately managed financial account scheme, based on a total contribution rate of 18.5 percent on earnings. The financial account scheme is run using a state-clearing house as a broker, and will have a state monopoly supplier of annuities. During the
accumulation period, participants can choose among all registered funds, about 500 when they make their first choice in the autumn of 2000. Accounts were created in 1999, and two annual
statements have been sent out since then.
If the NDC and financial account schemes together do not reach a minimum level by age 65, and the individual chooses to retire at this age, benefits from these systems will be
supplemented up to the guarantee level, determined by Parliament and financed with a state budget transfer. This reflects the fact that the PAYG NDC and financial account schemes are
designed to function autonomously from social policy. Life expectancy is factored into the NDC annuity, and together with the financial account system, this innovation helps to shift the risk of an aging society onto workers while they are still active. There is no maximum
retirement age, and the system offers a broad range of options for labor-force exit for older workers. Full, partial or no earnings from work can be combined freely with full or partial annuities from one or both of the public schemes from the minimum pension age of 61.
The Swedish Pension Reform Model: Framework and Issuesl
Part I
Introduction and Overview of the New System
1
Introduction
In legislation passed by Parliament during and after June, 1994, Sweden replaced its pay-as-you-go, defined benefit system with a pay-as-you-go (PAYG) notional defined contribution (NDC) system and an advance funded second pillar with privately managed individual
accounts, supplemented with a guarantee at age 65 for persons with low lifetime earnings. The earnings-related NDC PAYG commitment emulates the principles of a market-based defined-contribution insurance scheme, although without advance funding - other than that which follows with changes in cohort size - and with a rate of return based on the performance of the economy rather than the financial market.
The old system being replaced combined a flat-rate universal benefit (Folkpension) with an earnings-related supplement (ATP). A full earnings-related benefit could be obtained with 30 years of covered earnings at age 65, based on an average of the best 15 years. This system was unfair for persons with long working and large contribution histories and was expected to require increases in contribution rates that were believed to be unacceptable to future workers. In line with this, beginning in the 1980s, there emerged an increasingly widespread belief among new entrants into the labor force and the general public that the system could not meet its "promises" in the future. Younger workers were becoming more and more skeptical about their prospects as pensioners. In short, trust in the system was eroding, and it became clear to experts and policy makers that something had to be done.
The old system was conceived in the 1950s in an economic environment with 4 per cent real growth and much lower life expectancies. As the rate of per capita wage growth slowed down to an average of around 2 percent and labor force growth stagnated, experts began to become concerned that the contribution base would not grow rapidly enough in the future to support the anticipated increase in old-age pensioners. Actuarial calculations showed it would be necessary to raise the contribution rate considerably in order to meet future commitments, although the extent of the problem, as usual, depended on the underlying assumptions. The
fact that it was not possible to say today what the likely outcome would be tomorrow was itself seen to be a problem. There is general agreement that it is important to be clear about the content of the intergenerational commitment of the pay-as-you-go system.
A deep economic recession and accompanying fall in the contribution base by around 10 percent in the early 1990s finally brought home the acute need for reform to a broad spectrum
of political interests. The recession came on the heels of the final report from the Pensions Commission in 1990. In 1992, a newly elected government formed what was called the Pension Working Group, with a representative from each of the parties in Parliament and a few experts, and with a mandate to reform the then existing pension system. The principles of the reform were cast into the public arena for debate in the autumn of 1992. The first
legislation for the reform came in June 1994. Since this time, additional legislation has been introduced, specifying more of the details of the reform, including some of the unresolved
political issues left in 1994.2
Social security reforms are inherently political and in the end inevitably represent
compromises among various interests. One of the strengths of the Swedish reform process is that it emerged out of a political consensus among five of the seven parties in Parliament in 1994, representing over 80 percent of the voters, and this wide political support of the reform has continued. Hopefully, the broad spectrum of political support, together with the content of the reform itself, will be sufficient to guarantee that it will not only serve its purpose well but will be supported by a strong political majority for a long time to come.
My aim in this monograph is broader than simply to document the Swedish reform. The Swedish reform has brought together ideas that when woven together represent what many consider to be a paradigm shift in old-age social security. For this reason, my goal is to present the general framework and main options available at each juncture, and to comment on theirstrengths and weaknesses.
2
Overview of the Reform and Reform Goals
The overriding principle of the reform is that which has guided Swedish social policv since the 1950s. This is to provide an adequate earnings-related retirement benefit with universal
coverage for all persons working and residing in Sweden, backed up by a safety net that guarantees an adequate standard of living for the elderly. The Swedish reform has four main goals. The first isfair treatment of persons with different contribution histories. Two persons who have paid the same amount in contributions and who retire at the same time and at the same age should be entitled to the same benefit. This entails relating the benefit solely to lifetime money contributions, and not to the number of years of contributions, a specified number of best years and/or seniority, all of which are frequently found components of European social insurance systems. including the old Swedish system.
The second goal is transparent redistribution. This goal is achieved with redistributional policy financed with general budget resources earmarked specifically for this purpose. The most important example is the minimum guarantee benefit designed to protect the lifetime poor.
- One of thc must difficult technical issues ilaS been the specitication of the transition fromi the old system with an extra tax deduction for pensioners to a svstem where all inc(ome (earnings and pension benefits) are given eclual tax treatmenit.
The third goal is financial stability in the face of changes in demography and the economy. In the "old" defined benefit system, it was assumed that future workers would pay the bill, regardless of its size. In contrast, in the NDC system individual decisions about work and retirement are reflected in the size of the individual annuity, and the long-run aggregate contribution rate future workers will pay to finance the system is the same as that paid individually by workers today.
A fourth goal is to create financial saving managed by private financial institutions. During the period in which the large birth cohorts of the 1940s will drain the reserves of the present PAYG pension fund, the public financial saving will be maintained through the creation and growth of new second pillar saving from younger workers.
A result of the reform is that older workers will be able to combine earnings from work and retirement income in any way. with the same tax rules applying for both earnings and benefits. In fact, a part of the reform was changing the tax rules for pensioners - from a system with an extra deduction for pensioners - to create neutrality between sources of income. The NDC and second pillar benefits can be claimed wholly or in part - together or separately - after
reaching the minimum retirement age of 61. This in turn means that work and benefits can be combined in many different ways after this age.
The total contribution rate on earnings for the new old-age system will be 18.5 percent. Half will be an employer contribution and half an employee contribution. For persons covered fully by the new rules, 16 percentage points will go to the NDC PAYG component of the system and 2.5 percentage points to a mandatory funded component. This specific split reflects the goal to create the funded component, while honoring acquired rights under the old system and staying within a given cost restriction (18.5 percent of earnings). A split within the framework of the mandatory scheme between PAYG and funded components provides a portfolio that combines economic and financial returns.
3
Implementation
Implementation of the reform began in 1995, when contributions for the second pillar were put into an aggregate interest-bearing account at the National Debt Office. Additional
contributions have been set off every year since then. New information technology was introduced in the Social Insurance Administration, and this made it possible to create account data consistent with the ideas of the new reform.
Individual accounts were created for the NDC system using historical files from 1960. Notional capital through 1994 is based on a contribution rate of 18.5 percent and from 1995-1998 on 16.5 percent and from 1999 and thereafter on 16 percent, with the difference from
the format of the new system, account statements could be sent out to the entire covered population. This occurred in early 1999.
Individuals make their first choices of private funds with their second-pillar accounts in the autumn of year 2000. They will choose from around 500 privately managed funds for investment of their accumulated capital. Thereafter, new contributions will be accrued annually, and individuals will be allowed to change funds at their own discretion.
The first benefit computed according to the new rules can be paid on January 1, 2001. The first recipient would be a person born in 1938, the first age cohort covered by the new rules, and retiring at the age of 63. Assuming people keep with current practices, the first large age cohort claiming the new benefits will be composed of persons born in 1938 when they turn 65 in the year 2003.
There is a gradual transition into the new system, beginning with persons born in 1938 and ending with persons born in 1953. Persons born in 1934 will receive 20 percent of their
benefit from the new system and 80 percent from the old system. These proportions change by 5 percent per year for each younger age, and persons born in 1954 and later are completely within the new system.
Finally, in order to have a complete picture, it is important to note that a typical employee in Sweden is also covered by collectively bargained group insurance. Until the reform o.f the public system, these benefits were based on defined-benefit schemes. With the reform of the public system, the major occupational-based group schemes, covering about 85 percent of the labor force. have begun to convert into advance-funded defined-contribution, to coincide with the public scheme. The blue-collar workers (roughly 25 percent of the labor force) xkere the first to convert, in 1998. By the end of 2000 just about all employees, the main exception being those employed by the state, will have some degree of coverage based on an advance-funded defined contribution scheme in their negotiated (occupational) scheme, where they choose their own provider, with contributions of 2 - 4.5 percent of earnings (see figure).
Old-age Pension Insurance after the Reform
Contribution rates on earnings, net of contributions
Negotiated schemes 2.0-4.5 percent Advance Funded DC
Privately managed
_~ 2.5 percent +1 individual accounts
Social insurance
16 percent
Part II
Defined-Contribution PAYG with Notional Accounts
1
The Basic Idea
The basic idea of the pay-as-you-go system based on defined contributions with individual notional accounts (NDC) is that of underlying conventional defined contribution insurance schemes. Contributions based on a defined contribution rate applied to earnings from work are recorded on individual accounts. Account values represent a claim on a future pension. There is no advance funding, as opposed to in what we normally call a defined contribution. For this reason, we say that the system is notional defined contribution. Instead, contributions flowing into the system are used to finance current pension obligations, in the traditional PAYG manner.
The account value at the close of any current year consists of contributions during the year to date plus the account value from the previous year, the latter indexed to the rate of growth of covered earnings. Continuous indexation of account values from all years means that
contributions accredited in earlier years have the same relative weight as those earned in later years. In the most straight-forward version of this model, an annuity is calculated by dividing the capital balance at the chosen time of retirement by average (unisex) life expectancy for men and women together in that year, i.e., by an estimate of life expectancy for a person of that specific age:
Capital Annuity =
Life expectancy
The demographic instability created by an aging society is counteracted automatically by a change in the life expectancy factor. The system is actuarial in nature. The individual can handle the increasing life expectancy factor by working and contributing more or by postponing his/her annuity claim a little longer.
As the idea has been developed in Sweden, the annuity also includes an imputed real rate of return of 1.6 percent. This is equivalent to giving the capital in the account a real rate of return for a specified time, determined by life expectancy. This front-loading gives people a share of real economic growth in advance, and provides a higher initial benefit than they would have been entitled to under a straightforward application of the NDC system with wage indexation of benefits. The amount of the annuity will not be fixed, however, since benefits will be adjusted annually both for changes in the CPI and for the discrepancy between actual real earnings growth and the 1.6 percent used to compute the annuity. Appendix 1 discusses the calculation of the annuity and indexation in greater detail.
in value a little each year throughout the retirement career. A wage-indexed annuity costs a certain amount of money over a given life expectancy profile. Front-loading the annuity with "expected real growth" is a way to shift some of this fixed sum of money into the initial retirement years. but at a price: compared with normal wage indexation, the benefit will be relatively lower towards the end of retirement. This procedure is consistent with an
assumption that people would rather have more money now than later, i.e., positive time preference. The figure below illustrates the difference between front-loading the annuity with an assumed real growth rate and annual indexation of the annuity to the equivalent growth in the real wage, given that the annuities will be price-indexed in both cases.
Front-loading compared to wage indexation
Annuirv without
Front-loaded annuity based on front-loading. but
with annual real wage
B \ 1.6 percent annual growth. indexation of 1.6
e percent. on top of
e
neiein price indexation.
An illustration of NDC accounts
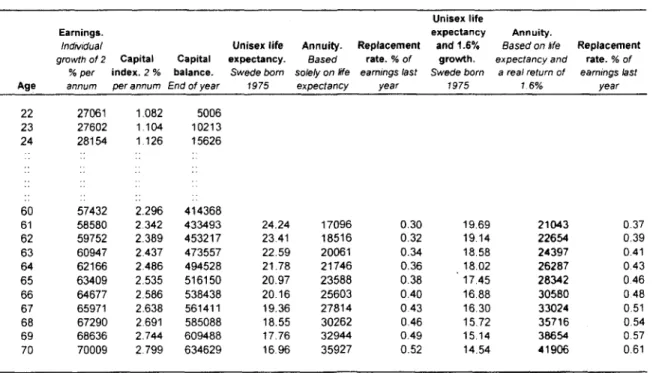
The idea of how the notional account is built up during working years and how a pension is calculated upon retirement is illustrated with an example in Table 1. In the example, the contribution rate is assumed to be 18.5 percent. The calculations assume that the individual does not earn any income or pay contributions until age 22 and that from this age he' she works continuously until retirement with nominal earnings that grow at an average rate of 2 percent per annum. In the example, the individual's rate of wage growth also happens to coincide with the rate of growth of the economy-wide wage. which is used in the example for indexation of notional capital. Of course, in practice individual wage growth will seldom coincide with the economy-wide growth rate. The annuity is calculated for a Swede born in 1975, based on the projected life expectancy of this person from age 61, etc. Note that unisex life expectancy is already projected to be almost 21 years from age 65 for a person born 1975. This means that for a person beginning work at age 22, the working period if it stops at age 62 will be only twice the number of years of retirement.
Table 1. NDC. An example with an individual who begins work at 22 and works every year until he/she decides to retire fully at sometime between age 61 and 70. Conmtribution rate on earnings=18.5 %. Values in US dollars.
Unisex life
Earnings. expectancy Annuity.
Individual Unisex life Annuity. Replacement and 1.6% Based on fie Replacement
growth of 2 Capital Capital expectancy. Based rate. % of growth. expectancy and rate. % of
% per index. 2 % balance. Swede born solely on fife eamings last Swede born a real return of earnings last
Age annum per annum End of year 1975 expectancy year 1975 1 6% year 22 27061 1.082 5006 23 27602 1.104 10213 24 28154 1 126 15626 60 57432 2.296 414368 61 58580 2 342 433493 24.24 17096 0.30 19.69 21043 0.37 62 59752 2.389 453217 23.41 18516 0.32 19.14 22654 0.39 63 60947 2.437 473557 22.59 20061 0.34 18.58 24397 0.41 64 62166 2.486 494528 21.78 21746 0.36 18.02 26287 0.43 65 63409 2.535 516150 20.97 23588 0.38 17.45 28342 0 46 66 64677 2.586 538438 20.16 25603 0.40 16.88 30580 0 48 67 65971 2.638 561411 19.36 27814 043 16.30 33024 0.51 68 67290 2.691 585088 18.55 30262 0.46 15.72 35716 0.54 69 68636 2.744 609488 17.76 32944 0.49 15.14 38654 0.57 70 70009 2.799 634629 16 96 35927 0.52 14.54 41906 0.61
It makes a considerable difference if the benefit is front-loaded using the real growth rate of 1.6 percent in the calculation of the annuity. At the age of 65, the benefit is about
5,000 dollars greater, according to Table 1.
The benefit level and replacement rate (compared with earnings the year prior to retirement) increase as (i) notional capital increases for each additional year individuals work and contribute, (ii) as the capital balance from the previous year is indexed up and (iii) as the
retirement and, hence, payment period decreases. It is worth noting that, for the older worker, indexation of capital from the previous year can provide a larger increment to the capital balance than contributions from working an additional year. In other words, there is always much to be gained by postponing a benefit claim and continuing to work, even with reduced
hours or a lower hourly wage.
A word of caution about replacement rates
Replacement rates provide us with a picture of the income standard of the retiree relative to his/her standard prior to retirement and for this reason are of general interest. Nevertheless, there are two good reasons to be cautious about replacement rates, including those shown
income, may be taxed at a higher rate than the same individual's pension income. This gives an after-tax replacement rate that is higher than the pre-tax replacement rate.
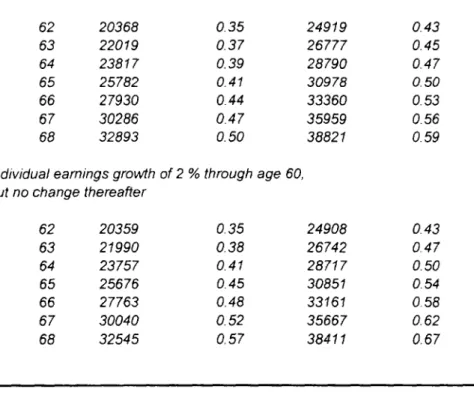
Second, if we are examining pre-tax replacement rates, as we often do (since complex tax systems can make it difficult to provide simple illustrations), it makes a difference what we assume about earnings growth towards the end of the working career. Typically, earnings profiles flatten out as we age, even if there is overall real wage growth. Table 2 illustrates that simply letting earnings remain constant after age 60, instead of assuming that they continue to increase, makes a big difference for the calculated replacement rate - but little difference for the amount of the benefit at retirement.
Table 2. Replacement rates are a poor guage of coverage. They depend greatly on end-career earnings, as this table illustrates. (This example is based on Table 1.)
Annuity based Replacement Annuity Replacement solely on life rate with 1.6 % rate
Age expectancy real growth
Individual eamings growth of 2 % throughout career
62 20368 0.35 24919 0.43 63 22019 0.37 26777 0.45 64 23817 0.39 28790 0.47 65 25782 0.41 30978 0.50 66 27930 0.44 33360 0.53 67 30286 0.47 35959 0.56 68 32893 0.50 38821 0.59
Individual eamings growth of 2 % through age 60,
but no change thereafter
62 20359 0.35 24908 0.43 63 21990 0.38 26742 0.47 64 23757 0.41 28717 0.50 65 25676 0.45 30851 0.54 66 27763 0.48 33161 0.58 67 30040 0.52 35667 0.62 68 32545 0.57 38411 0.67
Overall replacement rates - NDC, 2"n pillar and occupational schemes
The NDC and 2nd pillar components of the public pension scheme are both account systems.
From the point of view of the individual, the only difference - potentially - is in the rate of return. During the past 50 years, the real yield on equities has been around 8 percent. Bonds
have yielded 2-3 percent. Real economic growth was around 2 percent in the two decades preceding the deep recession in 1991-1994, during which the wage sum decreased by around
10 percent. Thereafter, real growth has been well over 2 percent, on average.
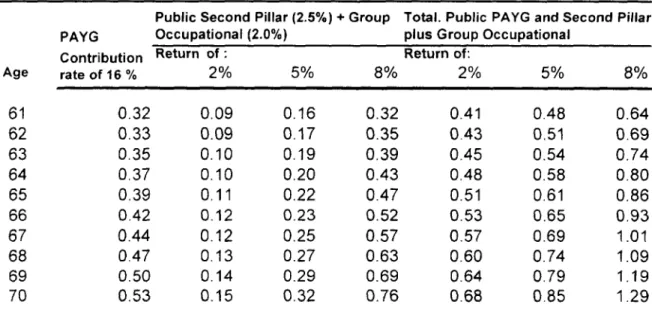
Table 3 provides an illustration of what the NDC, 2nd pillar and occupational schemes together
can mean for the "typical" individual, in this case a blue-collar worker. The calculations are based on the same assumptions as those underlying Table 1 - i.e., for an individual born in
1975 who works from age 22 and with a projected life expectancy according to the figures in Table 1. Earnings are assumed to grow throughout the individual's earnings career at a real rate of 2 percent per year. Given the present design of the "semi-mandatory" negotiated schemes, 2 percent is the smallest advance-funded DC contribution an individual can have, while some municipal employees will have as much as 4.5 percent. It is possible to have various mixes of bonds and equities, and, based on historical results, different rates of return, also depending on individual choice and market performance. Table 3 shows replacement rates for three rates of return, and assuming that the contribution rate to the negotiated scheme is 2 percent.
The total contribution rate for all three schemes together is 20.5 percent, with 4.5 percentage points going to financial account schemes. As is obvious, the rate of return makes a big difference. At age 65, a real rate of return of 2 percent overall gives a replacement rate of 51 percent, which is the same as what the NDC system would deliver with a contribution rate of 20.5 percent. With a 5 percent real rate of return on financial funds, the replacement rate
increases to over 60 percent. With the highly optimistic rate of return of 8 percent (which implies that the worker chooses a 100 percent equity fund), the result is still better, but less likely to occur.
What is important is that the overall result for the typical individual in Sweden will resemble that illustrated in Table 3. Table 3 shows the relative proportions of the systems taken together, with various rate-of-return assumptions. Of course, with a flat earnings profile, as
we have illustrated above, replacement rates would look better as the individual gets older -although the final annuities themselves are hardly affected by a slightly lower level of contributions. Once again, it is important to keep this point in mind.
Table 3. Replacement rates under different rates of return.
Public Second Pillar (2.5%) + Group Total. Public PAYG and Second Pillar
PAYG Occupational (2.0%) plus Group Occupational
Contribution Return of: Return of:
Age rate of 16 % 2% 5% 8% 2% 5% 8% 61 0.32 0.09 0.16 0.32 0.41 0.48 0.64 62 0.33 0.09 0.17 0.35 0.43 0.51 0.69 63 0.35 0.10 0.19 0.39 0.45 0.54 0.74 64 0.37 0.10 0.20 0.43 0.48 0.58 0.80 65 0.39 0.11 0.22 0.47 0.51 0.61 0.86 66 0.42 0.12 0.23 0.52 0.53 0.65 0.93 67 0.44 0.12 0.25 0.57 0.57 0.69 1.01 68 0.47 0.13 0.27 0.63 0.60 0.74 1.09 69 0.50 0.14 0.29 0.69 0.64 0.79 1.19 70 0.53 0.15 0.32 0.76 0.68 0.85 1.29
Note. The individual's earnings are assumed to grow at a real rate of 2 % per year throughout the earnings career The rate of growth for indexation of capital in the PAYG system is 2 %. The pay-as-you-go, second pillar and grouD
occupational annuities are all based on unisex life expectancy and a real rate of return on capital from retirement of 1.6 %.
2
Features of the NDC Scheme
The system is fair
A fundamental feature of the NDC model is that it is fair. For two persons working in
identical jobs - or more generally in careers with identical earnings profiles - the person with a longer earnings history and, consequently. who has contributed more, will receive a
proportionately higher benefit.
Similarly, a person whose lifetime earnings stream is higher, for example resulting from a longer period of education, but who is born at the same time and retires at the same time as his lower income neighbor, will receive a higher benefit.
The system accommodates redistribution
Traditionally, the notion of fairness in social security has also been associated with
redistributive goals. The NDC account framework provides a framework that can be used for many redistributive aims. Money can be transferred into the NDC system to finance "rights" that give rise to additions to individual accounts. In the Swedish reform, rights are granted for time spent in military conscription, care of younger children, higher education, and
compensated days of sickness and unemployment, as well as disability. These credits will be discussed in greater detail below. Note that financed rights can also be credited to 2"i pillar financial accounts - and are in the Swedish scheme.
Annuities adjust to changing life expectancy
In the more advanced economies, improvements in dietary, exercise and living habits, better working conditions and advancements in medical care have all led to improvements in life expectancy, which are continuing to rise. Although improvements in life expectancy have been absent in some countries, in time they are inevitable in all countries. For this reason, it is
important for the pension system to respond smoothly to improvements in longevity. This is where the NDC scheme is superior to many defined benefit schemes, as they are
usually designed. Namely, a serious problem with standard defined-benefit systems is that they typically promise a full benefit at a fixed retirement age. Ideally, the full-benefit retirement
age in a defined-benefit system would be adjusted automatically with changes in life
expectancy - but this should be made known long enough in advance to give people time to adapt. Governments are understandably reluctant to change their promises as life expectancy changes. In fact, the failure to adjust regularly for increases in life expectancy has contributed
to the cost crises that many national social security systems are facing today.
One of the most appealing characteristics of the NDC system is, then, that the annuity
responds automatically to the financial pressure created by an aging population. For any given amount of accumulated capital, a benefit is less at a given retirement age the greater the length of life expectancy. Life expectancy changes slowly, and current life-expectancy projections are something people can and - in the Swedish framework - will be informed about. They can take this information into account in formulating their decisions about work, retirement and personal saving.
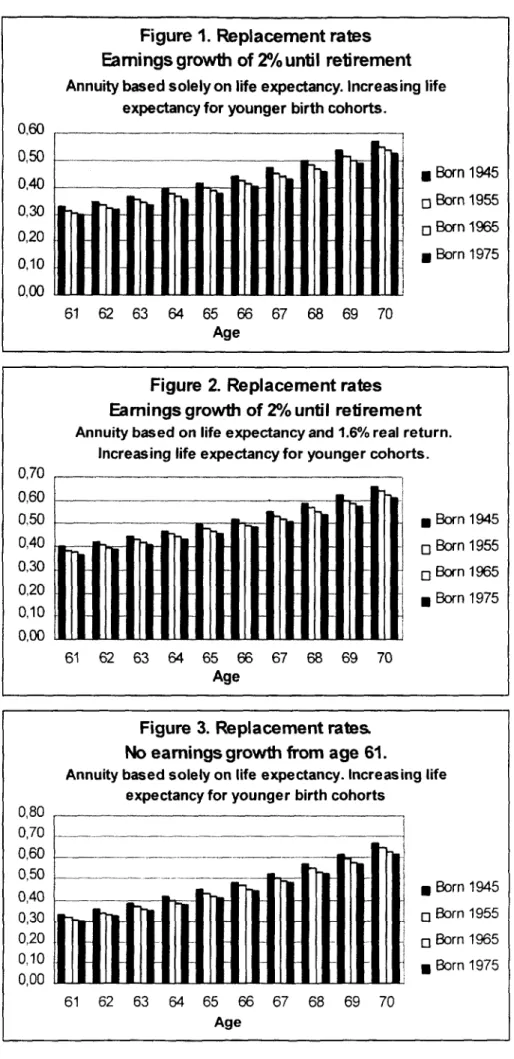
Figures 1-4 illustrate the effects of increasing life expectancy for younger birth cohorts.
Between the mid-1950s and the turn of the century, unisex life expectancy increased at the rate of about one year every ten years in Sweden. Presently, the projected change in life
expectancy between persons born in 1945 and 1975 is around two and a half years. The calculations are based on the same assumptions as those elaborated in Table 1. The only difference is that the values for projected life expectancy change with the age cohort. In sum, the fact that newly granted benefit levels change with changes in life expectancy provides an incentive for people to spend more time in the labor force as average life expectancy increases. This contributes to maintaining the long-term financial stability of the overall system with an aging population.
Figure 1. Replacement rates
Earmings growth of 2r/o until reti rement
Annuity based solely on life expectancy. Increasing life expectancy for younger birth cohorts.
0,60 _ ___ _ 0,50 040 * Born 1945 0,30 ~~~~~~~~~~Born 1955 0,20 0EBorn 1965 0,10 *Born 1975 0,00 61 62 63 64 65 66 67 68 69 70 Age
Figure 2. Replacement rates
Eamings growth of 20/o until retirement
Annuity based on life expectancy and 1.6e/o real return. Increasing life expectancy for younger cohorts.
0,70 0,60 0,50 _Born 1945 0,40 0 Born 1955 0,30 0 Born 1965 0,20 Bon17 0,10 0,00 61 62 63 64 65 66 67 68 69 70 Age
Figure 3. Replacement rates. No eamings growth from age 61.
Annuity based solely on life expectancy. Increasing life expectancy for younger birth cohorts
0,80 0,70 _ 0,60 0,50 __ 0,40 _ _ | | | | Born 1945W 0,30
oBorn
1955 0,20 1 Born 1965 0,10*Bon17 0,00Bon17 61 62 63 64 65 66 67 68 69 70 AgeFigure 4. Replacement rates No eamings growth from age 61.
Annuity based on life expectancy and 1.6% real return. Increasing life expectancy for younger birth cohorts
1,00 -X -- 0,80 0,60 _ Born 1945 0,40 [ on15 0,20 Born 1975 0,00 61 62 63 64 65 66 67 68 69 70 Age
Flexible retirement is made easy
Notional accounts grow in the manner described above until the individual chooses to retire sometime after the statutory minimum retirement age. People are free to choose partial or full retirement at any age above the statutory minimum. In principle, a partial benefit claim could be any percentage of a full claim. In Sweden choices will be limited to 25 percent, 50 percent,
75 percent or a full annuity. With partial retirement the individual can continue to work and accumulate additional notional capital from contributions on earnings, and hence, enhance the value of a recalculated pension upon full retirement. A recalculation can be made any number of times.
In other words, the NDC account scheme system makes retreating gradually from the labor force easy. Work and earnings can be combined in any way with an annuity, and all new contributions count towards a recalculated annuity. In occupations where early retirement might be the rule rather than the exception, occupational schemes could provide various choices for programmed withdrawal that could be combined with the social insurance benefit or taken for a period instead of it.
Finally, there is a tendency in Sweden, as in many other countries, for employers to buy out employees before they reach the minimum retirement age in the public system. A strong argument for increasing the minimum age in the public system, as life expectancy increases, is to make this practice more expensive and thereby encourage employers (and employees) to set their sights on a higher normal exit age for retirement.
3
Some NDC Design Issues
Setting the minimum retirement age
It is important to set the minimum retirement age with respect to two interrelated
considerations. The first is that the purpose of mandatory social insurance is to provide an adequate earnings replacement rate. The benefit amount to which people are entitled in both the NDC and financial account systems is determined by life expectancy at retirement. The longer the life expectancy. the smaller the benefit will be. It is important to set the minimum age high enough to provide an adequate benefit for the typical claimant. If this is not the case, some people will enter into permanent old-age poverty.
Given the long life expectancies of Swedes (presently unisex life expectancy is close to 22 years from age 61, with women expected to live about 5 years longer than men) it is not clear that Swedish politicians gave this matter enough thought. A person who works 40 years to age 61 will spend more than a third of his/her adult life in retirement. Although the cost is neutral for the system, all other things being equal, the benefit amount is around 30 percent higher at age 65 than at age 61.
For Sweden, there is a case for setting the minimum age higher - at 63-65 - in order to force people to remain longer at work in order to get a good lifetime benefit. This ought to be one of the goals of further reform work in Sweden. Persons entitled to a disability benefit, or who have supplementary occupational benefits covering earlier retirement, would then receive income replacement at an earlier age through these channels.
Should benefits be recalculatedfor changing life expectancy?
Life expectancy changes throughout our lives, including, of course, the period after the
annuity has been granted. Should benefits that have already been granted be recalculated as life expectancy increases beyond what it was at the time of the calculation? In principle, financial stability requires that it should; otherwise, a source of instability is introduced into the system. There are several possible responses to this problem. One is to adjust all benefits on a regular basis as changes in life expectancy become known. This means that people have to get used to small continuous changes. Another approach is to take expected future changes - estimated conservatively - into consideration in calculating the initial level of the benefit. This sort of a projection would be based on a long-term estimate that would be gradually changed. The latter approach is more appealing in that it suggests a once-and-for-all calculation of the annuity.
The floor and ceiling for covered earnings
It is not reasonable to cover all earnings - from the smallest to the largest. Persons with very high earnings should be entitled to make private decisions about how much insurance to
purchase. A lowest level is usually desirable for reasons of administration. How can the floor and ceiling be determined?
A practical way to set the minimum is to put it at the level of earnings above which people are required to report their earnings for income tax purposes. This is the approach taken in
Sweden. The ceiling should be high enough to provide an adequate retirement standard for the average worker, but low enough to leave room for individual variation in choosing optimal lifetime patterns for saving and consumption. Both the floor and the ceiling should be indexed to per capita wage growth so that they will maintain their relative values. The ceiling in the Swedish scheme is roughly 50 percent above the average wage, which is relatively low. The ceiling is indexed to average wage growth from the year 2002 onward.
Should voluntary contributions be allowed?
Should people be allowed to contribute more into the NDC scheme voluntarily? Of course this is possible in principle. In practice, however, it makes more sense to put voluntary
contributions into financial accounts, and normally there will be many private insurance options available for this purpose. It will not be possible to make voluntary contributions into the Swedish public schemes.
Periods of unemployment, sickness and disability
Contributions can be paid into both the PAYG and 2nd pillar funded components of the
mandatory public old-age pension system to cover periods of compensated unemployment, sickness, work injury and disability. This has the additional advantage of forcing these systems to include both the direct costs of program-related benefits and the indirect cost of contributing to the PAYG and funded accounts in the old-age system. The cost of the transfers from the
various income-replacement schemes is a part of their total cost to society, and for this reason their contributions to the old-age system are really a component of social policy.
In principle, any amount can be credited to an individual pension account, using any form of rule, and it is possible to make the rules more or less generous as time goes on, without
affecting the acquired rights (notional or financial capital) accredited in the past. Note also that it is important that financial transfers to the old-age pension system actually be made, since without them there is no financial backing for these rights.
In Sweden, benefits replacing earnings during sickness and unemployment will be treated as earned income, and 18.5 percent of these amounts give pension rights and will be accredited to individuals and transferred from these systems into individual accounts in the pension system. Similarly, the earnings replaced by compensation for work injury and disability will provide the basis for accrediting individual accounts. Appendix 2 discusses possible models for dealing
Child care and other social policy motives for enhancing pension accounts
Pension rights can be given for activities other than market activities yielding earnings or social insurance replacing these earnings. Obvious examples are time spent caring for younger children and in military conscription. Rights accredited for military conscription can be based on a fictitious wage, a minimum wage etc.
There are several issues associated with constructing a child-care credit. The issues are how to compensate, for how long, whether persons have to be wholly out of the labor force to obtain a credit, whether the credit can be taken by either parent, and whether this latter decision is made by the parents themselves.
The simplest child-credit model is to grant a sum (credit) per child, regardless of whether the mother (or father) works or not. More complicated models can also be devised, and Sweden has pursued this path.
In Sweden the parent with the lowest earnings in the year(s) in question will be automatically accredited with child-care pension rights, unless the parents choose otherwise. Child-care
earnings" will be imputed according to the most favorable of the following three computations:
* a supplement equal to 75 percent of average earnings for all covered persons * a supplement up to the individual's own earnings the year prior to child birth
* a supplement consisting of a fixed amount, indexed in time to the (covered) wage per capita
Each is targeted to a specific type of recipient. The first model covers persons without
earnings imrnediately prior to childbirth. The second replaces own earnings for a person who leaves her(his) job after childbirth and is wholly or predominantly at home. It also provides a supplement for someone who works less than he/she did prior to childbirth. The third provides an extra supplement after return to work - thus not discriminating against those women(men) who return shortly (in Sweden usually after 8-12 months) with earnings equal to or higher than those prior to childbirth.
For each child, the parent has the right to four years of imputed earnings according to the most favorable of the three models. If women continue to bear close to two children and, as is common, give birth to their second child within 2-3 years after giving birth to the first child, one of the above forms of credit will typically be received during 6-7 years. It is estimated that an average Swedish woman can expect to have her benefits enhanced by close to 10 percent from pension credits for child-care years. On average, she will then have about the same number of earnings years as a typical man.
Contributions will be paid from the state budget for child-care years, conscripted military service (based on imputed earnings equivalent to 50 percent of the average covered wage) and
years in higher education - the latter provision was enacted in spite of the strong arguments against it.3 The military and educational credits will be very small, however.
Survivors
An individual life can be separated into an economically active and a retirement period, the latter corresponding to the period beginning with the average retirement age. Deaths occurring up to the retirement age create a "surplus" in the system that can be utilized in a number of ways. The most obvious of these are to create:
* a survivor benefit for young (under the pension age) survivors, * a higher old-age benefit, or
* a general reserve to cover imperfections in the actual system design.
The second option is that which has been chosen for the Swedish scheme. This option requires keeping track of the notional capital of the deceased and distributing it proportionately to the accounts of survivors.
Gender Issues
In most countries the average woman earns less than the average man for a number of reasons. Among these are the choice to work fewer hours per week, employment in occupations with lower wage and salary levels, and, over the life cycle, fewer years in full-time work because of years spent caring for children. What are the implications within the structural framework discussed here'?
Bearing and raising children is an important activity that society normally wants to promote. On this premise a mandatory pension system should not disfavor persons who spend time out of the labor force during early child-care years. It is easy to argue that time spent at home for care of younger children should be compensated by transferring money from the state budget
to the account systems to provide financial backing for additional pension rights in the NDC and 2nd pillar schemes. The Swedish approach has already been described above.
Should capital be redistributed from men to women to compensate for the gender-specific wage bias? The annuity in both the NDC and financial account systems is calculated on the basis of life expectancy without regard to gender. In most countries, though, women live considerably longer than men. For this reason alone, there is already a considerable built-in transfer of capital to women; an additional transfer is provided by the childbirth credit. Nevertheless, lower earnings generate lower account values, and consequently a lower pension. This effect could be neutralized by adjusting individual accounts. An argument
today what the relative earnings of men and women will be in the coming decades. For this reason, in the Swedish scheme, this sort of transfer will not be made.
The "Rate of Return " in the NDC Account System
The contribution wage sum and the rate of growth of this sum determine the capacity to finance benefits. The contribution wage sum can be viewed as the product of the per capita wage and the number of contributors. Wage sum indexation always moves the system in the direction of financial stability. Per capita wage growth reflects the growth in productivity, but not changes in the size of the labor force. For this reason, per-capita wage indexation does not yield financial stability if wage growth is greater than the growth of the contribution wage
sum.
A birth rate lower than that needed to reproduce the population or net migration out of the country are demographic factors that can lead to a decline in the labor force over time, and thus reduce the system's financial capacity if per-capita wage indexation is chosen.
Nevertheless, the Swedish scheme has per-capita wage indexation. However, in addition, the system is provided with a balance mechanism that operates as a downside brake. It is based on the relationship between the actual debt and the "theoretical" debt with wage sum indexation and takes the reserve fund into account. This mechanism is described in more detail below
under the section on financial stability.
Transition from the old system
The question of how to go from the old to the new system is one of the most difficult of all design issues. There are two principal questions. The first is how to convert rights acquired under the old system. The second is, which age cohorts should be included in the new system'? Rights earned up to the time of the reform should be honored, to the extent possible. It may
not be a simple matter to place a value on these rights in practice. The Swedish defined-benefit system provides an example of the problems that might arise. Benefits in the income-related ATP-component are based on the average of the best fifteen years of earnings of a maximum
30 years needed to receive a full benefit. We do not know when the best years have occurred until all are accounted for. In principle, in terms of rights in the pension system, people could begin to work at age 35 and still qualify for a full benefit at age 65.
Availability of records is also a key issue. Sweden is fortunate in that there are computerized historical earnings records from 1960. A person born 1938 (the first covered by the new system) was 22 years old then, so very little history was unretrievable, and, one could argue. earnings histories prior to the introduction of the ATP system in 1960 gave no rights in the ATP-system anyway. In Sweden. earnings histories froml960 have been used to compute NDC accounts for everyone covered by the new rules, using the contribution rate of 18.5
percent through 1994, before 2nJ pillar rights occur in 1995, and the contribution rate
excluding the 2"d tier rate thereafter.4
Which birth cohorts should be covered in the new system'? Swedish politicians argued that a short transition period would be unfair to persons who for one reason or another had planned their careers so that they had not entered the labor force at an early age. Specifically, female participation in the labor force has been increasing steadily since the end of the Second World War. Women born around the 1940s were the first whose participation in the labor force matched that of men (with the exception of an average of two years, which we can guess have to do with childbearing). This suggests that in terms of gender neutrality, a starting year encompassing persons born 1938 and later was reasonable.
There is gradual transition for persons born 1938-1953. Persons born 1938 enter with 20 percent of their pension calculated according to the new rules and 80 percent according to the old rules. The proportions change successively with increments of 5 percent per year up to persons born 1954 who are entirely in the new system.
Calculations show that if earnings per capita grow by over two per cent per annum, it is generally better to be in the new system - rather than the old system with price indexation. Similarly, the second pillar real rate of return is likely to be well over two per cent during the next decades. In sum, there is a strong probability that an inmnediate transition for persons born 1938 (or perhaps 1940) would have provided better and potentially much better -benefits for the vast majority of pensioners now covered by the long transition. Moreover, an immediate transition would also have afforded more financial stability in the event that the downside scenario - i.e., continuous real growth of 0.5-1.5 percent - were to occur. Seen in this perspective, the long transition is highly questionable.
Finally, even persons born before 1938, most of whom are already pensioners. will notice a difference - at least in principle, if not in practice. This is because the flat-rate folkpension in the old system will to be converted into a guarantee and the extra tax deduction for all
pensioners will be eliminated, but with compensation provided through the construction of the guarantee.
Exportability of benefits
The NDC and 2"d pillar financial account benefits are based on contributions from earnings
and in principle should (and in Sweden in practice will) be exportable to persons who have earned rights but are not residing in the country during retirement. On the other hand, the guarantee can and, it can be argued, ought to be restricted to residents. This implies also that
it should be prorated according to the number of years of residence prior to reaching the qualification age.
4
A Guarantee for the Poor
The overallframework and design issues
In Sweden, as in many other countries, the safety net of last resort for the very poor is
financial social assistance, and for persons in need of special care, various care arrarngements. These are provided at the municipal level. Social assistance is means-tested. Low-income families and pensioners may also qualify for untaxed housing allowances, which are both means-tested and related to housing-standard norms for families of different sizes. Disability and old-age pensioners also have these options if their pensions are so low that they qualify for extra assistance.
Prior to the reform, the universal basic pension (folkpension), even together with a small ATP benefit, may have been below the Social Board's defined minimum standard for a single or married person. In this case the individual would have been entitled to a means-tested housing allowance. Normally the pensioner with combined benefits reaching the "housing allowance level" has a living standard roughly equivalent to the defined minimum. On the other hand, at the threshold, as the ATP benefit increased in size, the folkpension supplement and housing allowance decreased, so that total income remained practically unchanged. Hence, around the tax threshold, the composition of disposable income - although not its level - could change considerably.
The reform replaced this arrangement with a guaranteed minimum pension. The guaranteed minimum is also now a gross amount, i.e., a pre-tax benefit. The net, i.e., after-tax, benefit is roughly equivalent to the folkpension, including its supplement. With the reform, both present and future pensioners will receive a guarantee benefit based on the new model. One aim of the reform is to make the switch as neutral as possible to avoid ex post changes for persons
already receiving benefits. Since tax rates vary between municipalities, the highest tax rate was used in calculating the conversion - thus creating "winners" in low-tax municipalities.
Generally, there are two approaches to constructing a guarantee. The first is to establish a flat-rate guarantee. The alternative is to design the guarantee so that even persons with small NDC benefits always receive more than a flat guarantee. This graduated guarantee has been adopted in the Swedish reform.
There are also two general approaches to computing the amount of the guarantee with respect to the recipient's - or the recipient household's - other earnings. The first is to apply a means test, reducing the guarantee for other sources of income, including other, e.g.. third pillar or private, pension benefits. This is clearly the most efficient use of public money, and the least encouraging to "free-riding." In the absence of means-testing, individuals are free to avoid paying contributions and purchase private assets instead, or to have other sources of income,
and still be entitled to the guarantee. In spite of these problems, however, the Swedish politicians have generally favored a guarantee without regard to means, this alternative is the one that will be implemented in Sweden.
In the Swedish scheme, a full guarantee can be claimed at the age of 65, with 40 years of residence. It will be reduced by 1/40 for each year under 40. It will also be reduced by about
11 percent for a married pensioner. The guarantee and the 2nd pillar
How can the guarantee be coordinated with a 2"d pillar benefit that can be claimed separately
from the NDC benefit? Of course one approach is to avoid the problem by requiring people to claim both benefits at the same time. If both are fixed annuities, then there is no coordination problem. This approach is inflexible, however. That is. it may be important to be able to claim the 2nd pillar annuity separately - for example the stock market may be down at the time a claimant wants to claim the NDC annuity.
One approach to allowing flexibility is to impute a rate of return in calculating the value of unclaimed 2nd pillar annuity. This requires accepting the fact that the imputed annuity will
undoubtedly not be the same as the actual annuity, once the account is converted. To avoid this, in calculating the guarantee in Sweden, instead of using the actual 2nd pillar benefit, the 1SI
pillar NDC annuity will be calculated as if it were based on the total contribution rate,
encompassing the second pillar rate of 2.5 percent, i.e., 18.5 percent. Since the second pillar is relatively small in Sweden, the difference between these methods is also likely to be small in practice.
For relative large 2"d pillars, the Swedish method becomes more questionable if the aim is to
create an economically efficient guarantee (i.e., money is transferred to the very neediest individuals). The alternative of using the current converted value as the imputed value may be preferable. Yet another alternative would be to require people to convert their 2nJ pillar benefit
in order to qualify for the guarantee.
5
Medium and Long-Term Financial Stability
Rising contribution rates with the old systemThe major impetus for reform of the Swedish system was the threat of financial disaster. The old system would have collapsed with permanent wage growth under 1 percent. Even permanent real growth around 1 percent per annum would have required steady increases in contribution rates during the coming 30 years. In addition, increasing longevity has steadily contributed to rising costs, and it is likely that people will continue to surprise us by living longer than
The sensitivity of the old system to adverse demographic developments, e.g., a decreasing work force and/or increasing longevity after retirement, will be demonstrated in this section with scenarios based on the two most recent official demographic projections from Statistics Sweden. The first scenario is the baseline scenario used in official calculations in 1994, when the reform concept was passed by Parliament. The second scenario is from 1997, when the reform was legislated.
In the short time interval between the computation of figures for 1994 and 1997, the survival rates of both older men and women increased by several per cent. In part because of
persistently high unemployment, net immigration in the coming decade was adjusted
downwards by about 20 percent and the forecasted fertility rate was lowered from about 2.0 to about 1.8 children per woman - which is still high by European standards. The working-age population is constant to slightly increasing in the 1994 scenario, which we call the optimistic scenario. The 1997 scenario is more pessimistic. In this scenario there is a roughly constant labor force over the first 30 years but a steady decline thereafter with the accumulating effects of fewer births and lower net immigration.
Figures 5, 6 and 7 illustrate how these two demographic scenarios, together with three assumptions about real per capita wage growth (annual rates of 1 percent. 2 percent and 3 percent), affect the financial future of the public old-age pension system. The figures show the development of expenditures for the income-related parts of both the old and new systems (i.e., expenditures excluding the cost of the guarantees in the two systems). To achieve comparability of the old and new systems, in the reformed system the rate of return in the 2nd pillar has been set equal to the scenario rate of growth. This is tantamount to giving the new NDC PAYG system a contribution rate of 18.5 percent. This contribution level will also be equivalent to the long-run cost of the NDC PAYG system, i.e., the ratio of actual expenditures on benefits to the contribution base. A long-run contribution rate is also the target rate set for the reformed system, within a "pure" NDC framework.
Now, how does the old system perform with the different economic and demographic
scenarios'? Figure 5 shows that. in order to finance the old system with permanent real growth of 1 percent per annum in the contribution base, the contribution rate would have to rise to 24-27 percent by the year 2030, depending on whether the outcome resembled the "optimistic" or "pessimistic" demographic scenario. In the pessimistic scenario, the contribution rate needed to pay benefits at the time children born in the late 1980s become pensioners hovers around 29 percent. This sort of increase is not reasonable. Without reform of the old system. the alternative would undoubtedly have been repeated increases in the pension age, downward adjustments in benefit levels or, most likely, both.
Growth of 2 percent provides a much rosier picture of the old system. The pessimistic scenario leads to a - still too high - contribution rate of around 22 percent for much of the coming half century. But with the optimistic demographic scenario, the cost of financing the old system actually coincides roughly with the "target" contribution rate of 18.5 percent set for the reformed system. With consistent long-term real growth of 3 percent, the cost of the old
system falls to the target of 18.5 percent during the coming half century even in the pessimistic demographic scenario, and about 17.5 percent in the optimistic scenario.
Why does the old system respond so perversely to economic growth? Benefits are
price-indexed in the old system. This means that contribution costs fall as real wage growth rises.
Conversely, the burden on current workers increases as wage growth falls.
Probably no one believes that real wage growth will average 3 percent during the coming 50 years. These days many are even pessimistic about the prospects of maintaining real wage growth as high as 2 percent over the next half decade. More importantly, with growth in real per capita wage rates below 2 percent and/or an outcome resembling the pessimistic
demographic scenario, the old Swedish defined-benefit system would soon become unaffordable. As I have stated in the introduction, this was the main impetus for reform.
The financial stability of the reformed system
The new system is designed to maintain financial stability in the face of both economic and demographic changes. If benefits are calculated to reflect longevity exactly (so that the factor used to compute the annuity fluctuates randomly around the perfect-information outcome), and if indexation reflects exactly the development of the contribution wage sum, the ratio of
expenditures to the contribution base will fluctuate around the individual contribution rate of 18.5 percent.
The calculations in these figures assume that the NDC annuity is based on the exact longevity outcome for a cohort and a real rate of return of 1.6 percent (in accordance with the Swedish law). In addition, economic indexation is applied (also in accordance with the Swedish law), so that actual benefits are adjusted annually for the difference between the annuity factor rate of growth of 1.6 percent and the actual rate of growth. This mechanism keeps the system in financial balance. For the individual pension, this results in an annual deduction of 0.010 -0.016 = -0.006 per year with real growth of 1 percent, but there will be an increment of 0.0200 - 0.0160 = + .004 per year with 2 percent real growth, and 0.0300 - 0.016 =
+0.014 per year with 3 percent real growth. This economic indexation is also applied to benefits granted under the old rules. Finally, for purposes of illustration, two forms of
"economic indexation" and indexation of notional capital are applied, per capita and wage-sum indexation. With a stable labor force they should give the same result. With declining or increasing labor forces, the wage-sum index alone will keep the system in financial balance.5
Figure 5. Ratio of Benefit Payments to Contributions. Growth = 1 % 35,0% 30.0% -I Wage 25.0%/ Sum '97 _ -~~~ _ _ __ t ~~~~Wage 20 0%/ /,~ / Sum 94
oF''- Ave Wage
'97 15 0% z Ave Wage... ..} 94 10.0% |Old 97 Old 94 5.0% 0.0% 19 20 20 20 20 20 20 20 20 20 20 20 20 20 20 20 20 20 20 20 95 00 05 10 15 20 25 30 35 40 45 50 55 60 65 70 75 80 85 90 Year
Figure 6. Ratio of Benefit Payments to Contributions. Growth = 2 %
25 0% 20,0% 20.0% - ~~~~~~~~~~~~~~~~~~~~97VWage Sum - -~-~Wage Sum 150% 94 Ave Wage 10 0% 97 Ave Wage 5 0% - ' 94 Old 97 ° ° 20 20 20 20 20 20 20 20 20 20 20 20 20 20 20 20 20 20 2l 95 00 05 10 15 20 25 30 35 40 45 50 55 60 65 70 75 80 85 90 Old 94 Year
Figure 7. Ratio of Benefit Payments to contributions. Growth 3%
25.0% _ /__________ ________ =________ _=__=_ _=j_ _ - W age Sum 15.0% Ave Wage ' 97 10. 0% _____________________________________ ___ __ _ Ave Wage - Old 97 5.0% -Old '94 0.0% 19 20 20 20 20 20 20 20 20 20 20 20 20 20 20 20 20 20 20 20 95 00 05 10 15 20 25 30 35 40 45 50 55 60 65 70 75 80 85 90 Year
Figures 5 - 7 also demonstrate the central features of indexation in the NDC system. In the long-run - around 2030, when the last beneficiaries of pre-reform benefits have died off, we see that relatively extreme assumptions about the rate of real growth in the wage rate (I to 3 percent) all lead to about the same financial result.
What can we discern from the different demographic and labor market scenarios? With the 1994 demographic scenario the rate of growth in the wage sum is for all practical purposes the same as the rate of growth in the per capita wage. As a result, the development of costs is largely the same, regardless of the form of indexation applied. With the 1997 demographic scenario, labor force growth falls off by about a tenth of a percent per year from around 2025. As a result, with 2 percent per capita wage growth, for example, the contribution wage sum grows by only 1.9 percent. Per capita indexation of notional accounts and benefits means that the cost of benefits increases faster than the contribution base, leading to a long-run increase in costs and a growing financial deficit. With wage-sum indexation, financial balance is
maintained.
Finally, what is immediately clear from a quick glance at the three figures is that the new system is inherently financially stable, whereas the old system yields very different financial results depending on the economic and demographic scenario.
Automatic real-growth adjustment - "economic indexation" - of benefits acquired under thie
old system
It will take time before the majority of beneficiaries have benefits calculated according to the new rules. For the coming two decades a significant part of benefits will have been calculated according to the old formulas. How will financial crisis in the medium-term be averted, then? The answer is that even benefits paid according to the old rules will be subject to a new form of indexation. The mechanism to be employed is 'the economic adjustment factor," i.e., economic indexation, described above.'
We have just seen that cost neutrality required a real per capita growth rate of over 2 percent and an "optimistic" demographic forecast. With growth of 2 percent, benefits granted
according to the old benefit formulas actually cost more than they would have without reform. One can wonder, then, why Swedish politicians would choose to increase benefits granted under the old rules for per capita growth in the range of 1.6-2.0 percent over the coming three decades. The answer is straightforward. They were not willing to provoke elderly voters -i.e., persons on fixed incomes who usually have little chance of influencing their own economic situation through work. At the time the decision was made, many thought that per capita growth was more likely to fall well below 2 percent over the coming 20 years.
Increased longevity of old system (A TP) pensioners - generous transition rules - is still a source of financial instability in the medium term
There is another problem with the fact that benefits granted under the old system (with no adjustment factor for increasing longevity) will account for a dominant share of costs for well over two decades after the reform. There is no adjustment for increased longevity for benefits granted according to the old rules - including part of the transition benefit based on the old rules for persons born 1938-1953.
In addition, the large baby-boom cohorts of the 1940s, with part of their benefits calculated according to the old rules, create additional strain on finances. In principle, these costs can be covered by the reserves that the system will take over from the old system. In practice,
whether the fund will suffice to cover the generous transition rules depends on how large a sum is transferred to the state budget for partial compensation of additional costs associated with the budget transfers for child-care years, disability, etc. For such a transfer is also a part of the reform package. If an amount sufficient to cover the costs to the budget of budgetary transfers is moved from the present pension fund reserves to the treasury, it is likely that the reserves will not be sufficient to cover costs of conmmitments to persons born before 1950. A large sum of money - the equivalent of about one year of benefit payments - will already have been transferred from the pension fund to the state treasury by the year 2001. This transfer has already been decided. A second transfer is to be made in 2001. If it is, the two transfers together will decrease the total pension reserves by up to 50 percent. What does this mean for the generous transition rules?
If it turns out that politicians have been too generous to persons born in the late 1930s and 1940s, the "overly generous benefits" will be reduced by yet another index - the "pension-debt adjustment mechanism." This index corrects in the end all downside technical failings of the system. What this means is that politicians have chosen generous transition rules for the age cohorts of the 1930s and 1940s, but have also chosen a mechanism8 that probably will gradually reduce benefits once these people have become pensioners. In the final analysis this feature may be judged by social and political historians to have been the major failing of the reform.
The cost of the guarantee
The guarantee in the reformed system - financed separately from the general budget - costs more in the new system than in the old system. Why? The pre-tax amount has been set so that it will be neutral after the extra tax deduction for old-age pensioners is abolished in the year 2001. However, in order to do this for all, the gross amount has been set high enough so that no one will lose due to high local tax rates. This meant using the highest local tax rate to compute the conversion amount for all old-system pensioners. In other words, for many existing pensioners the reform provides an improved benefit.
heolew-At the outset, the guarantee costs (gross) about 2.2 percent, measured in terms of the contribution base. About 30 percent of this cost will be collected as local taxes, however, giving an after-tax cost of about 1.5 percent (and a tax-distribution problem between national and local jurisdictions). The guarantee will be price-indexed. This means that as older
pensioners with relatively low ATP pensions die and new individuals begin to retire with higher pensions, the need for the guarantee will decrease. By the year 2015 it is expected to cost about 1.2 percent (1.0 percent after tax) and by 2050 less than 0.5 percent (under 0.35 percent after tax) of the contribution base, if price indexation is maintained during all this time.
Will the long-run cost of the guarantee really be so low? Probably not. The size of the
guarantee is a political decision, which is one of the main features of the reform. The door is open for future political decisions about new distributional transfers through the tax-transfer system, including "simply" increasing the guarantee.
The contribution base