ESSAYS ON INTERNATIONAL CORPORATE FINANCE
JISOK KANG
A DISSERTATION SUBMITTED TO THE FACULTY OF GRADUATE
STUDIES IN PARTIAL FULFILLMENT OF THE REQUIREMENTS
FOR THE DEGREE OF DOCTOR OF PHILOSOPHY
GRADUATE PROGRAM IN BUSINESS ADMINISTRATION
YORK UNIVERSITY
TORONTO, ONTARIO
AUGUST 2016
ii ABSTRACT
The first chapter examines whether and how concentrated stock markets dominated by a small number of large firms affect economic growth. Using data from 47 countries worldwide relating to the period 1989–2013, I show that a country’s stock market concentration is negatively related to capital allocation efficiency, which results in sluggish IPO activity, innovation, and economic growth. These findings suggest that the structure of a concentrated stock market indicates insufficient funds for emerging, innovative firms; discourages entrepreneurship; and is ultimately detrimental to economic growth.
In the second chapter, we challenge the finding of Weld, Michaely, Thaler, and Benartzi (2009). They find that the average nominal price of stocks listed on New York Stock Exchange and American Stock Exchange has been approximately $25 since the Great Depression and that this “nominal price fixation is primarily a U.S. or North American phenomenon.” Using a larger data set from 38 countries, we show that the nominal share prices of most stocks in every country are mean–reverting and their best predictor is the beginning of sample period nominal stock prices. We demonstrate that corporate actions maintain these nominal stock price anchors.
The third chapter investigates the executive pay gap between public and private firms. We find that the executive pay gap escalates when there is less supply in potential competent executives, when shareholder’s power is stronger, and when a stricter rule on monitoring and disclosure is enacted. These findings largely support the view of the competitive executive labor market hypothesis that executive compensation is determined by market forces and increases when executives bear additional risk. The findings are inconsistent with the argument of the entrenchment hypothesis.
iii
DEDICATION
This dissertation is dedicated to my wife, Min–Young, for her devoted support throughout my Ph.D. study, and to my sons, Taein and Kenneth, who have reminded me of the passion in my
iv
ACKNOWLEDGEMENTS
I am indebted to my Ph.D. advisor, Professor Kee–Hong Bae, who has enlightened me on my study. I am thankful to Professor Yisong Tian and Professor Douglas Cumming for their invaluable advice on my research.
The first chapter has been benefited from many supportive suggestions at a seminar at the Finance Department of the Schulich School of Business in October 2015. I extend my thanks to Professor Mark Kamstra, Professor Lilian Ng, and Professor Yelena Larkin for their helpful comments. It is scheduled to be presented at Financial Management Association Asia Pacific Meetings in July 2016.
The second chapter was presented at Northern Finance Association Annual Meetings in September 2015. I thank Professor William Weld for his helpful discussion.
Last but not least, special thanks to faculty, staff, and my fellow Ph.D. students in the Finance Department for their support and encouragement on my research. I am also grateful to the Faculty of Graduate Studies at York University for generous financial support throughout my study.
v
TABLE OF CONTENTS
ABSTRACT ... ii
DEDICATION... iii
ACKNOWLEDGEMENTS ... iv
LIST OF TABLES ... vii
LIST OF FIGURES ... viii
CHAPTER ONE: MOTIVATION AND INTRODUCTION ... 1
CHAPTER TWO: STOCK MARKET CONCENTRATION, ENTERPRENEURSHIP, AND ECONOMIC GROWTH ... 3
2.1. Introduction ... 3
2.2. Data and Summary Characteristics ... 7
2.2.1. Data and variables ... 7
2.2.2. Summary statistics... 10
2.3. Stock Market Concentration and Capital Allocation Efficiency ... 12
2.4. Stock Market Concentration and Economic Growth ... 13
2.4.1. Regressions of real per capita GDP growth rates on stock market concentration ... 13
2.4.2. Endogeneity tests... 15
2.4.3. Stock market concentration and stability ... 18
2.4.4. Stock market concentration and institution... 19
2.5. Stock Market Concentration, IPOs, and Innovation ... 20
2.5.1. Stock market concentration and IPOs... 21
2.5.2. Stock market concentration and innovation ... 22
2.5.3. Two–stage regressions ... 23
2.6. Conclusions ... 23
CHAPTER THREE: NOMINAL STOCK PRICE ANCHORS: A GLOBAL PHENOMENON? ... 39
3.1. Introduction ... 39
3.2. Data ... 42
3.2.1. Nominal stock price ... 42
3.2.2. Other variables ... 44
3.3. Trends in Nominal Stock Prices ... 44
3.3.1. Time–series trends of nominal stock prices ... 44
3.3.2. Reversion of stock prices to initial price level: tercile analysis ... 46
3.4. Determinants of Nominal Stock Price: the Role of Anchor ... 47
vi
3.4.2. Speed of nominal price adjustment to anchor price ... 51
3.5. Corporate Actions and Anchoring ... 53
3.6. Nominal Stock Price after Euro Introduction... 56
3.7. Conclusions ... 58
CHAPTER FOUR: WHAT CAUSES THE PAY GAP BETWEEN PUBLIC AND PRIVATE FIRM EXEUCUTIVES? ... 75
4.1. Introduction ... 75
4.2. Hypothesis... 78
4.2.1. Entrenchment hypothesis ... 78
4.2.2. Competitive executive labor market hypothesis ... 79
4.3. Data and Summary Statistics ... 79
4.3.1. Data and variables construction ... 79
4.3.2. Summary statistics... 82
4.4. Pay Gap between Public and Private Firms ... 83
4.4.1. Overall pay gap ... 83
4.4.2. Managerial supply ... 85
4.4.3. Investor protection and shareholder power ... 86
4.4.4. International Financial Reporting Standards (IFRS) ... 87
4.4.5. Robustness tests ... 88
4.5. Conclusions ... 89
CHAPTER FIVE: SUMMARY AND CONCLUSIONS ... 108
BIBLIOGRAPHY ... 112
APPENDICES ... 118
Appendix A. Data Source and Variable Definitions ... 118
Appendix B. Stock Market Concentration and Economic Growth: Robustness Test—Regressions with Concentration at t–10 ... 121
Appendix C. Stock Market Concentration and IPO: Robustness Test—Regressions with Country Fixed–Effects ... 122
Appendix D. Stock Market Concentration and Innovation: Robustness Test—Regressions with Country Fixed–Effects ... 123
Appendix E. Data Source and Variable Definitions ... 124
vii
LIST OF TABLES
Table 2–1: Summary Statistics and Correlations of the Main Variables ……… 26
Table 2–2: Cross–Sectional Regressions of Elasticity of Capital Allocation on Stock Market Concentration … ……….……….. 29
Table 2–3: Panel Regressions of Per Capita GDP Growth on Stock Market Concentration……….… 30
Table 2–4: First–Stage Regressions: Regressions of Stock Market Concentration……….……… 31
Table 2–5: Panel Regressions of Per Capita GDP Growth on Stock Market Concentration: Endogeneity Tests ……….. 32
Table 2–6: Panel Regressions of Per Capita GDP Growth on Stock Market Concentration and Stability Measure ……….. 34
Table 2–7: Panel Regressions of Per Capita GDP Growth on Stock Market Concentration Partitioned by Corruption and Bureaucracy Indices……….. 35
Table 2–8: Panel Regressions of IPO Activities on Stock Market Concentration ……….. 36
Table 2–9: Panel Regressions of Innovation on Stock Market Concentration……….. 37
Table 2–10: Second–Stage Regressions of Per Capita GDP Growth on Estimated IPO and Innovation Activities ……….. 38
Table 3–1: Mean and median of nominal stock prices per country .……….. 64
Table 3–2: Percentage of firms whose stock prices in local currency remain in their initial tercile groups per country ……….. 65
Table 3–3: Cross–section regressions of nominal stock prices on firm’s IPO prices ……….……….. 67
Table 3–4: Cross–section regressions of nominal stock prices on firm’s initial stock prices …………..…….. 69
Table 3–5: Speed of adjustment of nominal stock prices ……….. 71
Table 3–6: Change (increase / decrease) in nominal stock price in local currency due to corporate actions per country ……….….. 73
Table 3–7: Number and percentage of decrease in nominal stock price in local currency due to corporate actions by year for euro and non–euro European countries .………..……….. 74
Table 4–1: Distribution of Total Executive Compensation ……….……….. 92
Table 4–2: Summary Statistics of the Variables ……….. 96
Table 4–3: Panel Regressions of Ln (total compensation / GDP) on Public Dummy………..………….. 100
Table 4–4: Panel Regressions of Ln (total compensation / GDP) on Public Dummy excluding the U.S. ……….……….. 102
Table 4–5: Panel Regressions of Ln (total compensation / GDP) on Public Dummy, Manager deficiency, and Brain–drain ..……….. 104
Table 4–6: Panel Regressions of Ln (total compensation / GDP) on Public Dummy, S/H suits, and Transparency ………..105
Table 4–7: Panel Regressions of Ln (total compensation / GDP) on Public and IFRS Dummies ……….….. 106
Table 4–8: Coefficients and t–statistics of Interacted Term of Public Dummy with Manager deficiency, Brain– drain, IFRS, S/H Suits, and Transparency with expanded definition of compensation and executives ……….……….. 107
viii
LIST OF FIGURES
Figure 2–1: Average Stock Market Concentration of Each Country ………..………….……….. 25
Figure 3–1: Trends of median nominal and median total return stock price, equally– and value–weighted total
return index ………..………….………. 60
Figure 3–2: Trend of median nominal stock price of euro and non–euro European countries in euro ……… 62 Figure 3–3: Trend of median absolute difference in nominal stock price in euro between firms in euro countries and their matching firms in non–euro European countries ………. 63
1
CHAPTER ONE: MOTIVATION AND INTRODUCTION
The primary goal of this dissertation is to investigate various issues in corporate finance in an international context. Specifically, I examine the role of finance on economy, managerial behavior in corporations, and the contractual mechanism of executive compensation in this study. Cross-country differences in economic development, institution and regulation, and corporate governance enable me to test those issues at either country or firm level.
In the second chapter, I investigate whether stock market development boosts economic growth. The primary function of any financial system is to faciliate the efficient allocation of capital and economic resources (Merton and Bodie, 1995). A developed financial market should allocate more capital to more productive, innovative firms. Finance researchers have commonly used financial market size in investigating the relationshp between finance and growth. They assume implicitly that financial market size is commensurate with financial market development. However, a larger financial market is not necessarily functionally more efficient. For instance, a sizeable stock market may simply allocate more capital to large, doddering firms than to small, emerging ones. This merely causes the stock market to appear larger in terms of capitalization even though it does not allocate funds efficiently. Appropriate measures that capture the functional efficiency of any financial market may need to be established first when the nexus between finance and growth is investigated.
In this chapter I introduce a new measure of stock market functionality—stock market concentration—and explore the relationship between stock market functionality and economic growth. I also investigate the channel through which stock market concentration affects growth. I provide evidence that stock market concentration is negatively associated with capital allocation efficiency, IPOs, innovation, and finally with economic growth. These findings suggest that the structure of a concentrated stock market indicates insufficient funds for emerging, innovative firms; discourages entrepreneurship; and is ultimately detrimental to economic growth.
The third chapter revisits Weld, Michaely, Thaler, and Benartzi’s (2009) observation that the average nominal share price of NYSE and AMEX stocks has been approximately $25 since the Great Depression and this “nominal price fixation is primarily a U.S. or North American phenomenon.”
We challenge their last conclusion. We term the tendency of stock prices to remain stable as “anchoring” hypothesis. Anchoring is a cognitive bias that describes the common human
2
tendency to rely excessively on the first piece of information offered (the ‘anchor’) when making decisions. Because anchoring is such a common human trait, we are skeptical that the United States is the only country whose stock markets exhibit this phenomenon.
Using a larger data set of nominal stock prices of individual firms from 38 countries around the world, we compile some evidence in support of the existence of an anchor price in most countries. The nominal price fixation does not appear to be primarily a U.S. or North American phenomenon, but rather a global phenomenon. In other words, anchors are norms, a point made in Weld et al (2009), and norms exist in all countries.
The fourth chapter investigates the executive pay gap between public and private firms. We examine whether the supply in the executive labor market, the institutional protection on shareholder’s rights against misappropriation by managers, and the introduction of stricter rules on monitoring and disclosure cause to widen the executive pay gap, noting the observation that each country has different environment in terms of labor market situation and legal, institutional background. This framework of research design enables us to test two competing hypotheses in agency theory: the entrenchment hypothesis and the competitive executive labor market hypothesis.
Conflicts of interest between executives and shareholders in modern public firms suggest two probable scenarios. First, the entrenchment hypothesis predicts that diffused ownership in public firms hinders shareholders from appropriately controlling the firm’s managers who then become powerful enough to set their own compensation high, regardless of executive labor market factors. This situation is more pronounced when legal, institutional instrument and monitoring system to protect shareholder’s rights is not in place in the country. Second, the competitive executive labor market hypothesis asserts that the firm’s managers are controlled through relevant monitoring and incentive scheme and that executive pays are determined by market forces and risk and burden they bear.
We find that the executive pay gap between public and private firms escalates when there is less supply in potential competent executives, when shareholder’s power is stronger, and when a stricter rule on monitoring and disclosure is enacted. These findings largely support the view of the competitive executive labor market hypothesis but are inconsistent with the argument of the entrenchment hypothesis.
3
CHAPTER TWO: STOCK MARKET CONCENTRATION, ENTERPRENEURSHIP, AND ECONOMIC GROWTH
Because of their role in financing new ideas, financial markets keep alive the process of “creative destruction”—whereby old ideas and organizations are constantly challenged and replaced by new, better ones. Without vibrant, innovative financial markets, economies would invariably ossify and decline. (Rajan and Zingales, 2003, p. 1)
2.1. Introduction
One of the most important functions of financial markets is to nurture entrepreneurship by facilitating funding for new, innovative firms. An effectively functioning stock market allocates capital efficiently, providing sufficient funds to emerging, productive firms, which in turn breeds competition and innovation, and ultimately fuels economic growth. However, the existing literature has not established a robust relationship between stock market development and economic growth (Zingales, 2015). 1 Previous studies have typically used stock market capitalization over GDP, or the size of a stock market, as a proxy for stock market development. But the size measure may not be a good proxy for the functional efficiency of a stock market. Nor is stock market capitalization a precise measure of the size or quantity of funds raised in the stock market, because it accounts for both the issuance of stocks and the past performance (retained earnings) of firms, and reflects expectations of their future performance (Rajan and Zingales, 1998).
In this chapter, I propose a new measure of stock market functionality which I term “stock market concentration” and examine its relationship with capital allocation efficiency, initial public offerings (IPOs), innovation, and economic growth, using data from 47 countries worldwide relating to the period 1989–2013. The extent of stock market concentration is computed annually as the sum of the stock market capitalizations of the largest five or ten firms divided by the total stock market capitalization of a country’s domestic stock exchanges. The idea is that a concentrated stock market dominated by a small number of large firms is likely to indicate the impediment to access to necessary funds for small new firms. My empirical goal for the new measure of stock market functional efficiency in this study is broadly twofold: to investigate the
1For example, Levine and Zervos (1998) find that stock market capitalization over GDP is not robustly correlated
4
relationship between stock market functionality and economic growth, and to examine the channel through which the former affects the latter.
Stock market concentration is also related to the fate of the largest businesses in an economy because the rise and persistence of the largest firms intensifies the level of concentration. Fogel, Morck, and Yeung (2008) find that big business stability is negatively associated with future economic growth. Their finding suggests that the long–lasting prosperity of the largest firms implies that old, large firms in a country are not challenged and replaced by small new firms, resulting in a slow creative destruction process and economic growth, confirming Schumpeter’s (1912) idea. Schumpeter (1912) also asserts that well–functioning financial markets are important in the real economy because they facilitate the creative destruction process by allocating funds to small new firms with innovative ideas for coping with old, large ones. Thus, according to Schumpeter (1912), whether stock market concentration captures the prosperity of the largest firms or is an inverse proxy for stock market functionality, it is expected to be negatively associated with future economic growth.
I begin the analysis by investigating the relationship between stock market concentration and capital allocation efficiency. This experiment is an important step because I should see a negative correlation between the two, to the extent that the concentration measure is a good proxy for the inverse level of stock market functionality. Following Wurgler (2000), I construct a measure that captures the efficiency of capital allocation at the industry level of each country. By regressing the growth rate of gross fixed capital formation (investment) in an industry on the growth rate of value added in that industry, I estimate the degree of efficiency in allocating capital; that is, the extent to which a country increases investment in its growing industries and decreases investment in its declining industries. I then run cross–sectional regressions of the capital allocation efficiency measure on stock market concentration. I find that stock market concentration is indeed negatively correlated with the proxy for capital allocation efficiency, suggesting that a highly concentrated stock market is less likely to allocate necessary capital to young, innovative firms that make efficient use of capital.
Next, I examine the relationship between stock market concentration and economic growth. Following the approach of King and Levine (1993), which relies on the “post hoc ergo propter hoc” (after this, therefore, because of this) argument, I regress real per capita GDP growth rates in year t on stock market concentration in year t–5 or t–10. Using lagged values of stock market
5
concentration allows me to investigate the long–term effects of concentration on economic growth and to partially address concerns over reverse causality bias. Additionally, I run two–stage least squares and country fixed–effects regressions to further address endogeneity concerns.
I find that stock market concentration is a good predictor of economic growth in the subsequent five or even ten years and has large economic implications.2 For example, a one standard deviation decrease (0.186) in stock market concentration by the top five firms in a basic regression predicts an increase of approximately 0.74 percentage points in real per capita GDP growth rates in five years. This effect is economically significant considering that the average real per capita GDP growth rate in the sample is 2.26%. The magnitude of the impact is more substantial if the effects are accumulated. Also worth noting is that the negative effect of stock market concentration on economic growth is more severe when a society is more bureaucratic or corrupt, implying that a severely concentrated stock market is more problematic if it is locked in with bad institutions.
I also examine the relationship of stock market concentration with IPOs and innovation. I hypothesize that stock market concentration adversely affects future economic growth through a negative effect on entrepreneurship by constricting the financing and innovative activities of new, innovative firms. Although a large body of literature investigates the relationship between finance and economic growth, the specific channels through which finance affects growth remain relatively unknown. Identifying the channels also affirms—at least partly—the causal link from finance to growth.
To the extent that the structure of a concentrated stock market suggests the difficulty faced by new, innovative firms in accessing the stock market and obtain necessary financing, I expect a country with high stock market concentration to have fewer IPO and innovative activities, which in turn slows its economic growth. To test this hypothesis, I run panel regressions of the IPO and innovation variables in year t on stock market concentration in year t–5 and find that stock market concentration is indeed negatively associated with IPO and innovation proxies. In the final empirical approach, I employ two–stage regressions to check the link between stock market concentration, access to funds by innovative entrepreneurs, and economic growth. I first estimate
2 Stock market concentration in year t is not negatively correlated with contemporaneous (year t) economic growth
but is negatively correlated with future (year t+5, t+10) economic growth. This finding may loosely imply a causal effect of stock market concentration on economic growth.
6
IPO and innovation activities at a certain level of stock market concentration by regressing them on concentration. Then I run real per capita GDP growth rates on the estimated IPO and innovation activities, finding that they are significantly correlated with economic growth. These results reaffirm that a dysfunctional stock market prevents small, new, but innovative firms from accessing the funds they require, which in turn hurts economic growth.
Whether finance makes a significant difference to economic growth is a classic debate. There are two opposing views on the relationship between finance and growth. The first is that financial markets are critical to economic growth; a well–functioning financial market facilitates the financing of new ideas by innovative entrepreneurs, which promotes the innovation that boosts a country’s economic growth (Schumpeter, 1912; Goldsmith, 1969; McKinnon, 1973; Miller, 1998). The other view is that the financial system is a mere sideshow, responding passively to the demands created by economic development (Robinson, 1952; Lucas, 1988). Distinguishing between the two views has enormously important implications for policymakers, particularly in developing economies. Extensive studies on this important issue assert that financial development promotes economic growth (King and Levine, 1993; Levine and Zervos, 1998; Beck, Levine, and Loayza, 2000; Rousseau and Wachtel, 2000; Beck and Levine, 2004).3 However, these studies focus mainly on the credit market and we still lack concrete evidence indicating that stock market development contributes to economic growth. Additionally, in the wake of the global credit crisis of 2008, several studies have questioned the benefits of financial (credit) market development, even suggesting that too much finance (credit) may not only not promote growth, but can even hurt it (Arcand, Berkes, and Panizza, 2012; Cecchetti and Kharroubi, 2012; Schularick and Taylor, 2012; Beck, Degryse, and Kneer, 2014; Mian and Sufi, 2014).
My study contributes to the literature in several ways. First, it introduces a new measure of the functional efficiency of the stock market, which is more relevant to theories on the role of finance. The existing literature focuses primarily on size measures (i.e., stock market capitalization over GDP for the stock market and credit amount over GDP for the credit market). Studies tend to assume implicitly that the development of a financial market is commensurate with its size. Once
3 These articles are based on country–level analysis. Jayaratne and Strahan (1996) add evidence on the positive
finance–growth nexus using state–level data for the United States. Rajan and Zingales (1998) provide industry–level evidence. Demirgüç–Kunt and Maksimovic (1998) and Guiso, Sapienza, and Zingales (2004) suggest that firm–level growth is associated with financial development. Levine (2005) provides a good survey of the literature on finance and growth.
7
this assumption is broken, there is no theoretical reason to maintain that a large financial market boosts economic growth. Second, this study provides evidence, with the new measure, indicating the positive role of a well–functioning stock market on the real economy. A large body of literature has paid attention to the credit market; the role of the stock market has not been studied extensively (Zingales, 2015). Third, this study suggests a probable channel through which finance affects growth. Its analysis shows that once a stock market is concentrated—indicating the difficulty of providing funds to small new firms—competition and innovation are discouraged. Such a situation is ultimately detrimental to economic growth.4
This chapter proceeds as follows. Section 2.2. elaborates on the data collected for the analysis, the variable constructions, and provides summary characteristics. Sections 2.3. and 2.4. examine the relationships between stock market concentration and both capital allocation efficiency and economic growth. Subsequently, Section 2.5. explores the relationships between stock market concentration and IPOs and innovation. Finally, Section 2.6. concludes.
2.2. Data and Summary Characteristics 2.2.1. Data and variables
Appendix A describes the data sources and the variable definitions used in the paper. To create stock market concentration variables, I first search for the stock market capitalization (stock price times the number of shares outstanding) of all firms listed on domestic stock exchanges in each country at the end of each year, as registered on Datastream. I sort the firms by market capitalization to identify the largest five or ten in each country in each year. I then divide the sum of the stock market capitalization of the largest five or ten firms by the total stock market capitalization of their country’s domestic stock exchanges and term the variables Mkt. Con. (top 5 (10) firms).
I compute stock market concentration from 1989 because it is from this year that reliable data are available on the market capitalization for both developed and developing economies. The computation ends in 2008 because I use five–year preceding values of stock market concentration
4 The inference that the function of financial markets is especially related to new, small firms’ financing is in accord
with Rajan and Zingales (1998) and Cetorelli and Gambera (2001). Rajan and Zingales (1998) provide the evidence that financial development promotes growth in the number of new firms rather than increasing the average size of existing ones. Cetorelli and Gambera (2001) find that bank concentration facilitates credit access to small young firms, even though bank concentration itself depresses economic growth in general by constricting the funds provided to old firms.
8
in the regressions of real per capita GDP growth rates—the main dependent variable—for which data are available up to 2013. Countries must have at least 40 listed firms in each year throughout the sample period to be included in the final sample. This restriction results in the variables being constructed for a sample of data for 47 countries from 1989 to 2008. I then collect data for these 47 countries from the same period on other financial development measures commonly used in the literature from the World Development Indicators (WDI) of the World Bank: total market capitalization for firms listed on domestic stock exchanges over GDP (Mkt. Cap. / GDP), the value of shares traded on domestic stock exchanges over market capitalization (Turnover / Cap.), and domestic credit provided to the private sector over GDP (Credit / GDP).
I create dependent variables for four different categories: economic growth, capital allocation efficiency, IPOs, and innovation. The proxy for economic growth is the annual per capita GDP growth rate ( ( ), %) in real terms, which is computed as:
( ) = ( ( ) − ( )) × 100, (1)
where per capita GDP is in constant 2005 U.S. dollars and is collected from the WDI of the World Bank. The variable is constructed for 1994–2013, the period following that of stock market concentration data with a five–year time lag.
I follow Wurgler (2000) in collecting data and measuring the elasticity of capital allocation as a proxy for the capital allocation efficiency of each country. The data come from the Industrial Statistics Database of the United Nations Industrial Development Organization (UNIDO).5 The 2013 version of the data source provides industry–level data on the amount of investment and value created by 151 manufacturing industries of 135 countries for 1991–2010, approximately overlapping with the period for data on real per capita GDP growth rates (UNIDO, 2014).
The elasticity of capital allocation ( ) is estimated using the following regression:
= + + , (2)
5The official title of the CD–ROM for the data used is “Industrial Statistics Database at the 3– and 4–digit level of
ISIC Code (Revision 3)” or “INDSTAT4 2013 ISIC Rev.3.” I use data at the three–digit International Standard Industrial Classification (ISIC) code level, following Wurgler (2000).
9
where and are gross fixed capital formation and value added in industry i of country c in year t, respectively. In regressing the growth rate of fixed capital formation (investment) in an industry on the growth rate of value added in that industry, I expect the coefficient ( ) to capture the degree of efficiency in allocating capital. That is, the coefficient should capture the extent to which a country increases investment in its growing industries and decreases investment in its declining industries.
I apply the same data screening process elaborated by Wurgler (2000). First, I require a country to have at least 50 industry–year pairs of fixed capital formation and added value. Second, I exclude data for which the absolute value of fixed capital formation growth or value–added growth is greater than one. Third, I also dismiss industry observations for which the value added is less than 0.1% of the country’s total value added in each year. This screening process results in data for 32 countries of the countries in the basic data set.
Following La Porta, Lopez–de–Silanes, Shleifer, and Vishny (1997), I create two variables as proxies for IPO activity: IPO Amount / Pop. and IPO No. / Pop.6 IPO Amount (No.) / Pop. is calculated as the natural logarithm of one plus the IPO proceeds (the number of IPOs) in a year divided by a country’s population.7 These variables capture the amount of financing by new firms and the number of new firms entering the market scaled by population.
To collect and screen the IPO data, I refer to Doidge, Karolyi, and Stulz (2013). First, I collect all equity issuance data flagged as original IPOs from the SDC Platinum Global New Issues Database of Thomson Reuters.8 Then I exclude international issuances, including American Depository Receipts (ADRs), and IPO data flagged as private placements. I also delete IPO data related to real estate investment trusts and investment funds (Standard Industrial Classification (SIC) codes: 6722, 6726, 6798, 6799), investment advice companies (6282), and special purpose finance companies (6198). In addition to the restrictions imposed by Doidge et al. (2013), I drop
6 La Porta et al. (1997) employ only one variable as a proxy for IPOs (the number of IPOs divided by a country’s
population).
7 The log transformation makes the dependent variables conform more to the normal distribution. I add one before
taking the log because there are no IPOs in some country–year observations. I make the same adjustment when creating patent proxies.
8 The database is frequently used in cross–country studies on IPOs; however, Henderson, Jegadeesh, and Weisbach
(2006) and Gozzi, Levine, and Schmukler (2010) note that the international IPO data in the SDC Platinum Global New Issues Database are incomplete before 1991. I assume that most IPO activities for the sample countries are contained in the database because the sample period in this study starts in 1994; however, due caution is deemed necessary.
10
government–related IPOs (SIC codes in the 9000s) because a government agency’s decision to pursue an IPO may not be affected by the functional efficiency of the stock market. Ultimately, this leaves me with IPO data for 46 of the countries in the basic data set for 1994–2013, the same period for the data on real per capita GDP growth rates.
Typically, cross–country studies on innovation use data on patents filed with the U.S. Patent and Trademark Office (USPTO) as a proxy for innovation (Acharya and Subramanian, 2009; Hsu, Tian, and Xu, 2014). Following Hsu et al. (2014), I utilize four innovation proxies derived from the number of patents submitted by individuals or non–government entities and approved by the USPTO, and the quality measures of the patents. The data are collected from the National Bureau of Economic Research (NBER) Patent Database, which provides detailed data on patents relating to the period 1976–2006. I aggregate various patent data at the country level in each year. Patent / Pop. is the natural logarithm of one plus the number of patent applications (subsequently approved) in a year divided by a country’s population. Citation / Pop. is the natural logarithm of one plus the number of citations received by the patents in a year divided by a country’s population. Because citations can be received beyond 2006, the number of citations is adjusted for the truncation using the weighting factors from Hall, Jaffe, and Trajtenberg (2005), as in Hsu et al. (2014). Generality / Pop. is the natural logarithm of one plus the generality level of the patents in a year divided by a country’s population. Generality measures the number of technology classes of patents that cite the submitted patent. Originality / Pop. is the natural logarithm of one plus the originality level of the patent in a year divided by a country’s population. Originality measures the number of technology classes of patents as cited by the submitted patent. Whereas Patent / Pop. represents the quantity of patents, the other three variables correspond to the quality of the patents that supplement the former. Because the measures are related to the patents approved by the USPTO, data on the United States are excluded. The result is a sample of patent variables that matched the 43 countries in the basic data set from 1994 to 2006.
2.2.2. Summary statistics
Panel A of Table 2–1 presents the average value of the financial market development proxies and the dependent variables of four different categories for 47 countries during the sample period. First, the average value of stock market concentration displays quite large variations even among developed countries. The Mkt. Con. (top 5 (10) firms) values of Finland, Ireland, and the
11
Netherlands are 0.51 (0.61), 0.58 (0.73), and 0.53 (0.69), respectively, whereas those of Canada, Japan, and the United States are only 0.14 (0.22), 0.13 (0.20), and 0.09 (0.14), respectively. Among developing economies, the Mkt. Con. (top 5 (10) firms) values of Hungary and Kenya are conspicuously large at 0.76 (0.86) and 0.54 (0.74), respectively, whereas those of Brazil and China are quite low, at 0.09 (0.12) and 0.13 (0.18), respectively. Figure 2–1 presents the average stock market concentration of the largest five (ten) firms for the sample countries during 1989–2008, allowing visualization of the significant variations in the stock market concentration of these countries.
(SEE FIGURE 2–1)
Panel A of Table 2–1 shows that the size of the financial markets of the sample countries varies significantly. The Mkt. Cap. / GDP of Hong Kong is the highest at 3.01. In contrast, that of Bangladesh is merely 0.04. The Credit / GDP is 1.96 for Japan but only 0.17 and 0.18 for Argentina and Romania, respectively.
One may expect stock market concentration to be highly negatively correlated with stock market size or liquidity. That is, it is more likely that large companies will dominate a smaller or less liquid stock market, resulting in greater stock market concentration. However, Table 2–1 shows many contrary cases. For example, Hong Kong has very large stock markets in relation to the size of its economy (Mkt. Cap. / GDP: 3.01) and they are very concentrated (Mkt Con (top 5(10) firms): 0.40 (0.53)). Switzerland also has stock markets that are large (Mkt. Cap. / GDP: 1.73) and concentrated (Mkt Con (top 5(10) firms): 0.46 (0.58)). The stock markets in the Netherlands are fairly large (Mkt. Cap. / GDP: 0.88) and liquid (Turnover / Cap.: 1.03), but also concentrated (Mkt Con (top 5(10) firms): 0.53 (0.69)).
The sample countries’ economies present different levels of economic growth, capital allocation efficiency, IPOs, and innovation. For example, China’s economy grew almost 9% per capita annually for two decades, whereas that of Italy grew a mere 0.41% per capita annually during the same period. In terms of capital allocation efficiency, the elasticities of France and Italy are 1.07 and 1.16, respectively, whereas that of Indonesia is only 0.07. With respect to IPO activity, Australia and Hong Kong show the most dynamism when scaled by their populations. In terms of innovation, Japan and Switzerland present the highest number of patent applications and citations scaled by population. Meanwhile, IPO and innovation activities in countries such as Bangladesh, Pakistan, and Sri Lanka are dormant.
12
Panel B of Table 2–1 reports the correlations between the key variables: financial market development measures and the dependent variables in four categories. The variables tagged with “at t–5” (Mkt. Con. (top 5(10) firms), Mkt. Cap. / GDP, Turnover / Cap., and Credit / GDP) are those observed five years earlier than the dependent variables.
A few interesting features are worth noting. Mkt. Con (top 5(10) firms) are only weakly negatively correlated with Mkt. Cap. / GDP (–0.04 and –0.07, respectively) and Turnover / Cap. (–0.03 and –0.05, respectively). This feature suggests that stock market concentration is a unique stock market characteristic that is different from the stock market’s size or liquidity. The most interesting point of the correlation matrix is that the stock market concentration variables are negatively associated with future per capita GDP growth, the elasticity of capital allocation, and the proxies for IPOs and innovation—representing the main finding of this paper. Intriguingly, the size variables, Mkt. Cap. / GDP and Credit / GDP, are negatively correlated with per capita GDP growth even though they are positively correlated with the IPO and innovation proxies. I now investigate these findings in greater detail using multivariate regression models.
(SEE TABLE 2–1)
2.3. Stock Market Concentration and Capital Allocation Efficiency
In this section, I regress capital allocation efficiency on stock market concentration in order to confirm that the concentration measure is a good proxy for the inverse level of stock market functionality. Specifically, I test whether a more concentrated (less diversified) stock market allocates capital less efficiently. The measure of stock market concentration could inversely reflect the level of allocation efficiency to the extent that a highly concentrated stock market is less likely to allocate the necessary capital to young, emerging firms.
Table 2–2 reports the results of cross–sectional regressions of the efficiency measure (elasticity) of capital allocation on stock market concentration and the other financial market characteristics, while controlling for per capita GDP. These regressions are analogous to the basic regression model in Wurgler (2000). I calculate the elasticity of capital allocation from 1991 to 2010 for 32 countries.9 I average per capita GDP for the same period, and average the
9 The following 15 countries lack data and are excluded in the regressions: Argentina, Bangladesh, Brazil, Canada,
13
concentration and other financial market characteristics for the period for which the data are available, 1989–2008.10
Table 2–2 shows that the financial market size variables, Mkt. Cap / GDP (stock market) and Credit / GDP (credit market), are not significantly positively associated with the capital allocation efficiency for the sample period. The coefficient of Turnover / Cap., the liquidity measure of the stock market, in specification (4) is significantly positive but loses significance when the stock market concentration variables are included. In contrast, Table 2–2 shows that stock market concentration is significantly and negatively correlated with the elasticity of capital allocation, even when the other financial market variables are included—although the significance of the coefficients of Mkt. Con. (top 10 firms) is marginal. Overall, this result confirms the hypothesis that a more concentrated stock market is associated with less efficient capital allocation. It also assures that the stock market concentration measure is a fairly good proxy for the inverse level of stock market functionality to the extent that a better–functioning stock market allocates funds more efficiently.
(SEE TABLE 2–2)
2.4. Stock Market Concentration and Economic Growth
2.4.1. Regressions of real per capita GDP growth rates on stock market concentration
A common finding in the literature on finance and growth is that the effect of finance on growth occurs over a long period of time. Comparisons of contemporaneous financial development measures and economic growth are thus seldom meaningful. I therefore regress the economic growth of country c in year t on stock market concentration and other financial development measures in year t–5 by controlling for macroeconomic variables shown by the literature to affect economic growth. Using lagged values of stock market concentration allows for an investigation into the long–term effects of concentration on growth and partially addresses concerns over reverse causality bias. Specifically, I estimate the following regression model:
ℎ , = + . ( 5 (10) ) ,
10 I want to see if the current level of stock market concentration is correlated with future capital allocation efficiency
to establish the causal relationship, but the duration of the data is short and does not permit this line of enquiry. The period for the data on concentration falls approximately into the same period as that for the elasticity measure but precedes it by two years.
14
+ . ./ , + / . ,
+ / , + ∑ , , + , (3)
Following the literature, I add the following control variables to the regressions: Initial per capita GDP, the natural logarithm of real per capita GDP in 1993; Initial Education, the natural logarithm of the average number of years of education received by individuals aged 25 and older in 1990; Gov. Spending / GDP, general government consumption divided by GDP; Inflation, inflation rates represented by the GDP deflator; and Openness / GDP, the sum of the export and import of goods and services divided by GDP.11 Following Petersen (2009), the estimated standard errors in the regressions are clustered by both country and year to draw statistical implications.12
Table 2–3 presents the output of the panel regressions of real per capita GDP growth rates on the five–year lagged variables of stock market concentration, other stock market characteristics, and the level of credit provided in a country. The signs of the macroeconomic variables are in line with the findings of previous studies. Initial per capita GDP and Gov. Spending / GDP are negatively associated with future per capita GDP growth, confirming the converging effect of economic growth and the crowding–out effect of government spending. Meanwhile, the initial levels of human capital (Initial Education) and trade openness (Openness / GDP) of a country are positively related to future growth, implying the positive effect of human capital and the openness of an economy on growth.
I find that stock market size (Mkt. Cap. / GDP) is not positively and significantly associated with economic growth five years later. This finding is consistent with Levine and Zervos (1998), who do not find robust correlation between stock market size and economic growth. However, unlike Levine and Zervos (1998), the liquidity measure (Turnover / Cap.) here is not significantly correlated with future growth, even though the signs of the coefficients are all positive. Even more intriguing is that Credit / GDP is negatively related to future economic growth, consistent with recent papers suggesting that a credit amount exceeding a certain level is disadvantageous to
11 The data on Initial Education are available only once in the ten years before the 2000s in the United Nations’
International Human Development Indicators. Therefore, I use the 1990 data as an alternative measure of the initial education level at the beginning of the regression period.
12 Standard errors based on double clustering generate more conservative t–statistics than for only country–level
clustering in all regressions in this paper. However, the double–clustering correction method does not produce stable standard errors and t–statistics of year or country dummies when included in the regressions. I subsequently use the country–level clustering correction method in year and country fixed–effects regressions.
15
economic growth.13 The issue of the appropriate credit level for the size of an economy is the subject of serious debate, particularly after the financial crisis of 2008, because more credit does not always seem to benefit an economy.14
The stock market concentration variables are consistently and statistically significant regardless of whether the other stock market characteristics of size and liquidity are included in the regressions. Stock market concentration also has large economic implications. A one standard deviation decrease (0.186) in the level of stock market concentration by the top five firms, Mkt. Con. (top 5 firms), in a basic regression (specification (1)) predicts an increase of approximately 0.74 percentage points in real per capita GDP growth rates in five years (–0.186 × –3.98). This effect is economically significant considering that the average real per capita GDP growth rate in the sample is 2.26%. The magnitude of the impact becomes more substantial if the effects are accumulated.
I run a series of robustness tests. First, I include year fixed–effects with standard errors clustered by country in the regressions. Second, I rerun the regressions excluding China because it is a definite outlier in a scatter plot of stock market concentration versus real per capita GDP growth rates. Third, I winsorize all variables at the 1% and 99% levels to formally address the concern of outliers and repeat the regression analysis. Fourth, I include bureaucracy and corruption indices retrieved from the World Competitiveness Center of the International Institute for Management Development (IMD) in the regressions to control for the effect of institutions on economic growth.15 Finally, I regress real per capita GDP growth rates on the ten–year lagged values of stock market concentration, the other stock market characteristics, and credit measures with other contemporaneous macroeconomic variables (Appendix B). Both stock market concentration variables are significant at the 1% level in all of these additional tests.
(SEE TABLE 2–3)
2.4.2. Endogeneity tests
13 For example, Arcand et al. (2012) find that the credit provided to the private sector over GDP (%) has a negative
impact on economic growth as long as it exceeds 100%.
14 An extreme case is Iceland. The credit provided to the private sector over GDP (%) in 2006 and 2007 were 320%
and 248%, respectively, whereas the average values in the sample countries in this paper in the same period were 97% and 100%, respectively. Iceland’s banking sector was blamed for providing excessive credit to its economy when the country was hit by the worldwide financial crisis in 2008.
16
Using lagged values of stock market concentration in the regressions partially addresses concerns over reverse causality bias. However, if unknown time–invariant country characteristic variables are correlated with both stock market concentration and future economic growth— causing a spurious relationship between the two variables—the endogeneity concern remains. Thus, in this section, I run two–stage least squares regressions using instrument variables and country fixed–effects regressions.
2.4.2.1. First–stage regressions
In order to employ two–stage least squares regressions, I search for exogenous instrument variables that are possibly correlated with stock market concentration but are not related to real per capita GDP growth rates other than through the effect of concentration. As a preliminary step, I delve into factors that may be correlated with stock market concentration. I look into the probable factors that can be subsumed under physical, economic, institutional, and financial grounds and formally test in a regression format whether these factors are correlated with stock market concentration.
First, as shown in Figure 2–1, large countries tend to have less concentrated stock markets. Even firms with large stock market capitalization may represent only a small portion of the entire economy of a large country. I include real GDP deflated by a GDP deflator and the territory size of a country as proxies for a country’s economic and physical size.
Second, the trade theory of comparative advantage asserts that small, open countries choose specialization and concentration because of optimal economies of scale (Dornbusch, Fischer, and Samuelson, 1977; Dixit and Norman, 1980). Strategically, these countries may have a few large companies rather than many small and medium–sized businesses, which leads to higher stock market concentration. To capture this economic feature, I consider a country’s export of goods and services over its population as a proxy for the level of its dependence on exports relative to its population.
Third, I examine the possibility that economic institutions affect the extent of a country’s stock market concentration. For example, a bureaucratic, corrupt government may provide business favors to large companies for political ends, which would elevate the level of
17
concentration. I include Gov. Spending / GDP in the regressions as a proxy for government clout and the bureaucracy index gauged by the World Competitiveness Center of the IMD.16
Fourth, La Porta et al. (1997) find that civil law countries with poorer investor protections have the least developed capital markets. To the extent that the stock market concentration variables capture the (inverse) functionality level of a stock market, the stock market concentration is correlated with a country’s legal origin and level of investor protections. Thus, I include French, German, and Scandinavian dummies that are equal to one if a country’s commercial laws originate from French, German, or Scandinavian civil law traditions, and zero otherwise.
I also include the anti–self–dealing index that measures the extent of minority shareholder protections.17 The regressions also contain Mkt. Cap. / GDP, Turnover / Cap., and Credit / GDP in consideration of the possibility that the other financial characteristics may provoke higher stock market concentration. Additionally, Ferreira and Matos (2008) find that foreign institutional investors have a strong preference for large companies. Therefore, I add to the regressions a country’s foreign portfolio equity inflows scaled by its GDP.
Table 2–4 shows that various factors, not just a single element, influence the level of stock market concentration.18 A larger country characterized by high total GDP or vast territory tends to have lower stock market concentration as predicted. International trade theory asserts that a small, open economy represented by Export / Pop. has higher stock market concentration. French and German civil law traditions, in contrast to English common law, and weaker minority investor protection (lower anti–self–dealing index) induce higher stock market concentration, as affirmed by the law and finance literatures. Portfolio equity inflows from foreign investors also increase stock market concentration. Together, all of these factors explain more than 50% of the variation in stock market concentration. Table 2–4 presents interesting findings itself and serves as the first– stage regressions in two–stage least squares regressions.
(SEE TABLE 2–4)
2.4.2.2. Second–stage instrument and country fixed–effects regressions
16 The center also provides a corruption index, but it is highly correlated with the bureaucracy index. I only include
the bureaucracy index due to the multicollinearity concern.
17 The anti–self–dealing index is retrieved from Djankov, La Porta, Lopez–de–Silanes, and Shleifer (2008).
18 The bureaucracy index is available only from 1995 and for 41 countries. The anti–self–dealing index is available
18
Among the factors that are correlated with stock market concentration, as shown in Table 2–4, I select territory size and legal origin as exogenous instruments. There is little reason to expect that larger country size or English common law origin relates directly to higher economic growth rates. Subsequently, I formally test the exogeneity of these instruments.
Specifications (1) to (4) in Table 2–5 present the output of the second–stage instrumental variable regressions. In regression specifications (1) and (2), a country’s territory size is utilized as an instrument. In regression specifications (3) and (4), both the territory size and the English legal origin dummy are used. The F–test in the first–stage regressions strongly suggests that the instruments are relevant, rejecting the hypothesis of weak instruments. More importantly, Table 2–5 shows the negative relationship between stock market concentration and future real per capita GDP growth rates in all specifications. In specifications (3) and (4), following Aggarwal, Erel, Ferreira, and Matos (2011), I inspect the exogeneity of the instruments on the dependent variable using over–identification tests because the number of instruments used is greater than the number of instrumented variables. The Hansen J–test does not reject the hypothesis that at least one of the instruments is exogenous to the dependent variable.
I also run country fixed–effect regressions to further mitigate the endogeneity concern. Specifications (5) and (6) in Table 2–5 present the results.19 The signs of the coefficients of all of the variables are similar to those of the pooled ordinary least squares (OLS) regressions in Table 2–3. Mkt. Con. (top 5 (10) firms) are significantly negatively associated with future real per capita GDP growth rates in the regressions when formally controlling for time–invariant country effects.
(SEE TABLE 2–5)
2.4.3. Stock market concentration and stability
Because stock market concentration is derived from firms’ stock market capitalizations and involves a firm’s current performance and future prospects, stock market concentration by the largest firms represents the fate of big businesses and, thus, is closely related to the stability measure of Fogel et al. (2008). They show that the stability of the largest businesses in a country (or, reversely, their turnover) is negatively (positively) associated with the country’s economic growth. Their finding supports the idea expressed by Schumpeter (1912) that “creative
19 The double–clustering correction method in Petersen (2009) does not produce stable standard errors and t–statistics
of country dummies, even though the stock market concentration variables are significant at the 5% level in an unreported table. I thus present a country–level clustering correction method in these regressions.
19
destruction”—the process through which technological innovation evolves by disavowing a battered, current regime and building a novel, new system—is critical to economic development. I investigate whether the stock market concentration measure is differentiated from the stability measure. I construct the stability measure by counting the number of firms that remain in the top five (ten) list of firms in both the current year and five years ago and divide this number by five (ten). This measure lies between zero and one, the latter corresponding to perfect stability of the biggest five (ten) firms.
The stability measure in this paper differs from that in Fogel et al. (2008) in a number of ways. First, they define a large business as the union of firms or business groups. Second, in their study, the proxy for business size is the number of employees. Third, they consider that big businesses are stable if they subsequently remain in the top business list or their employment grows no slower than the country’s GDP. Given the difference in measurement, it would be meaningless to compare the stability and concentration measures directly. In this experiment, I simply check whether stock market concentration captures a different aspect—stock market functionality—and not only the stability of the largest businesses in a country.
In Table 2–6, I add to the regressions the stability measure, in addition to other variables analyzed in Table 2–3.20 For specifications (1) to (3), the stock market concentration and stability measures are derived using the top five firms, and using the top ten firms for (4) through (6). The stability measures are negatively associated with real per capita GDP growth rates, whether constructed with the top five or ten firms, confirming the findings in Fogel et al. (2008). The stock market concentration variables remain significant when included with the stability measures in specifications (3) and (6), suggesting that stock market concentration represents a different aspect of a financial market or an economy, not just the prosperity of the largest businesses. Moreover, both stock market concentration and the stability of large businesses are related to negative economic consequences.
(SEE TABLE 2–6)
2.4.4. Stock market concentration and institution
So far, the evidence indicates a negative relationship between stock market concentration
20 The sample period in Table 2–6 is 1994–2008 because the stability measure drawn from stock market concentration
20
and economic growth. However, the negative effect of concentration is not necessarily even in all countries; assuming the diminishing benefit of marginal funds, the role of finance may be much more critical in developing countries with poorer economic institutions than in developed countries. Thus, I conjecture that the negative impact of stock market concentration on growth might be more severe in a highly concentrated stock market in a bureaucratic, corrupt country. I examine this hypothesis in the following analysis.
Table 2–7 reports the results of the regressions of real per capita GDP growth rates on stock market concentration, where the sample countries in each year are partitioned into two groups with respect to bureaucracy and corruption indices.21 The regressions are run separately for each group, and the other financial development measures and control variables in Table 2–2 are included in all regressions but are not shown in order to save space. In the first regression sets, in which the countries are divided by the bureaucracy index, stock market concentration is negatively associated with future economic growth regardless of the level of bureaucracy. However, the group with a higher level of bureaucracy (lower bureaucracy index) has more negative coefficients for the stock market concentration variables compared with the group with a lower level of bureaucracy (higher bureaucracy index). The coefficients of Mkt. Con. (top 5 (10) firms) of the group with a higher level of bureaucracy are more than twice as large in absolute value as those of the lower bureaucracy group (–6.74 (–6.21) versus –2.45 (–2.40)). The differences in the magnitude of the coefficients are statistically significant.
The regressions in which the countries are partitioned by the corruption index show a similar pattern. The stock market concentration coefficients of the group with a higher corruption level (lower corruption index) are more negative than those with lower corruption level (higher corruption index). Overall, Table 2–7 confirms the speculation that the negative impact of stock market concentration on economic growth is more severe if a society is more bureaucratic or more corrupt.
(SEE TABLE 2–7)
2.5. Stock Market Concentration, IPOs, and Innovation
21 The sample period in Table 2–6 is 1995–2013 because the bureaucracy and corruption indices are available from
1995. The indices are also only available for 41 countries. The countries excluded in this experiment are Bangladesh, Egypt, Kenya, Morocco, Pakistan, and Sri Lanka.
21
In this section, I regress the proxies for IPOs and innovation on stock market concentration. I also apply two–stage regressions where economic growth is regressed on IPO and innovation activities estimated by the level of stock market concentration. These analyses identify the specific channel through which a concentrated stock market demotes growth.
2.5.1. Stock market concentration and IPOs
A concentrated stock market structure may indicate that new, innovative firms struggle to access the stock market and obtain the financing they need. Therefore, countries with high stock market concentration experience few IPOs of new firms. To test this hypothesis, I run panel regressions of the two IPO proxies of IPO Amount / Pop. and IPO No. / Pop. on stock market concentration. The macroeconomic conditions for the 46 countries in the basic data set are controlled for in the regressions for 1994–2013.22 As in the regressions of real per capita GDP growth rates, the stock market concentration variables are lagged by five years to determine the long–term effects on IPO activity and to remedy the reverse causality bias.
Table 2–8 shows that the two size measures (Mkt Cap. / GDP and Credit / GDP) and the liquidity proxy (Turnover / Cap.) do not induce more vigorous IPO activity in the future. It also indicates that the stock market concentration variables are significantly negatively associated with both IPO activity proxies.
In specifications (3), (4), (7), and (8), I include the anti–self–dealing index because the law and finance literature emphasize the importance of institutions enforcing minority shareholders’ rights on vigorous financing activities including IPOs.23 Stronger protection of minority investors’ rights is shown to promote IPOs as predicted by the law and finance literature. More importantly, the stock market concentration variables remain significantly negative in those regressions.
In an unreported analysis, I employ other proxies for IPOs, as in Doidge et al. (2013): IPO proceeds over the one–year lagged GDP and IPO count over the one–year lagged number of listed firms. Regressing these two IPO proxies on stock market concentration generates output that is
22 IPO data for Peru are missing in the data source and, thus, are excluded in this experiment.
23 The anti–self–dealing index for Bangladesh is not available in Djankov et al. (2008); the country is excluded from
22
qualitatively the same.24 The variables are still negative when controlling for time–invariant country effects (Appendix C).25
(SEE TABLE 2–8)
2.5.2. Stock market concentration and innovation
King and Levine (1993b) prove theoretically that a better financial system improves the probability of successful innovation. Hsu et al. (2014) find empirical evidence that stock market development promotes technological innovation but also that credit market development discourages innovation. In this subsection, I investigate whether stock market concentration depresses innovation.
If young, innovative firms find it difficult to access necessary financing in a concentrated stock market, fewer innovations are expected under such a stock market structure. To test this hypothesis, I run panel regressions of the innovation proxies on stock market concentration with a five–year lag—again controlling for macroeconomic variables—for 43 countries in the basic data set for 1994–2006.26
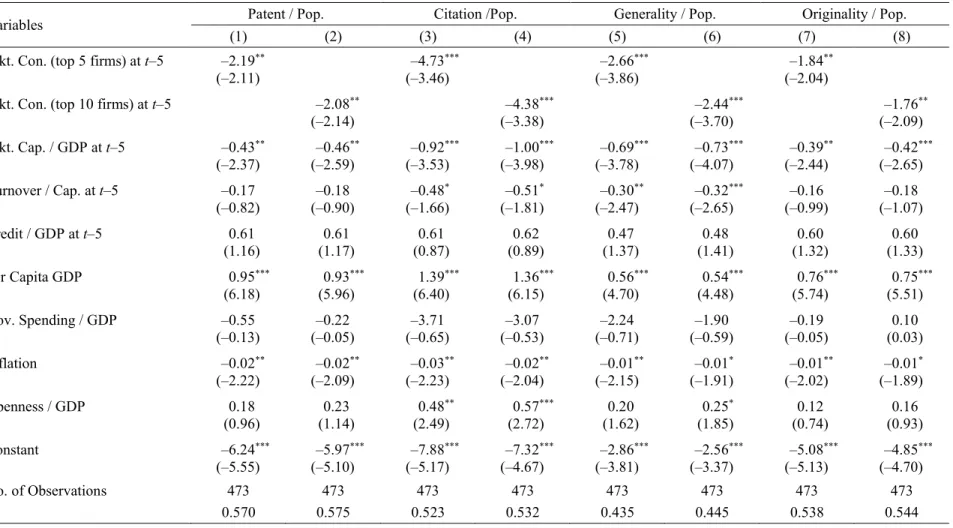
Table 2–9 presents the results of the regressions. Interestingly, Mkt. Cap. / GDP is negatively associated with all four innovation proxies, which indicates that having a large stock market does not boost a country’s innovation activity in the long run. As previously seen with IPO activity, future innovation activity is not promoted by liquidity (Turnover / Cap.) or credit amount (Credit / GDP), according to the regression analysis. Finally, both stock market concentration variables (Mkt. Con. (top 5 (10) firms)) are significantly negatively associated with not only quantity but also quality proxies of innovation.
I rerun the regressions of the innovation proxies only in manufacturing industries, as in Hsu et al. (2014), because innovation and attaining patents is more critical in manufacturing
24 Stock market concentration variables are significant at the 1% level in all regressions. I report the regressions of
IPO proceeds and count scaled by a country’s population because the other dependent variables in this paper are scaled by population.
25 I exclude the anti–self–dealing index in the regressions as I expect the country dummies to soak up all the effects
of time–invariant institutional variables.
26 Bangladesh, Pakistan, and Romania are excluded because they are missing from the patent files of the NBER.
Additionally, the United States is also excluded in consideration of home bias. The regressions end in 2006 because the data permit analysis up to this year.