ASSET PRICING AND INVESTOR RISK IN
SUBORDINATED LOAN SECURITISATION
Andreas A. Jobst
#First Version: 13 August 2003
This version: 13 April 2005
As a sign of ambivalence in the regulatory definition of capital adequacy for credit risk and the quest for more efficient refinancing sources collateral loan obligations (CLOs) have become a prominent securitisation mechanism. This paper presents a loss-based asset pricing model for the valuation of constituent tranches within a CLO-style security design. The model specifically examines how tranche subordination translates securitised credit risk into investment risk of issued tranches as beneficial interests on a designated loan pool typically underlying a CLO transaction. We obtain a tranche-specific term structure from an intensity-based simulation of defaults under both robust statistical analysis and extreme value theory (EVT). Loss sharing between issuers and investors according to a simplified subordination mechanism allows issuers to decompose securitised credit risk exposures into a collection of default sensitive debt securities with divergent risk profiles and expected investor returns. Our estimation results suggest a dichotomous effect of loss cascading, with the default term structure of the most junior tranche of CLO transactions (“first loss position”) being distinctly different from that of the remaining, more senior “investor tranches”. The first loss position carries large expected loss (with high investor return) and low leverage, whereas all other tranches mainly suffer from loss volatility (unexpected loss). These findings might explain why issuers retain the most junior tranche as credit enhancement to attenuate asymmetric information between issuers and investors. At the same time, the issuer discretion in the configuration of loss subordination within particular security design might give rise to implicit investment risk in senior tranches in the event of systemic shocks.
Keywords: securitisation, securitization, asset-backed, ABS, CLO, CDO, structured finance, default term structure
1
I
NTRODUCTION1.1
The nature of loan securitisation
Over the recent past asset securitisation – the substitution of market-based finance for credit-based finance – has developed into a versatile funding and capital management alternative for financial institutions and corporations. Conceptually, issuers of a typical asset-backed securitisation (ABS) structure achieve gains by converting classifiable cash flows from a diversified portfolio of illiquid existing or future receivables
(liquidity transformation and asset diversification process) of varying maturity and quality (integration and
differentiation process) into stratified positions (“tranches”) of varying investment risk, which are sold as negotiable capital market paper a different seniority and funding level.1 The ambivalence in the regulatory definition of capital adequacy for credit risk and the quest for more cost-efficient risk-adjusted refinancing urged banks to securitise loan exposures through collateral loan obligations (CLOs) to manage their economic and regulatory cost of capital more effectively.2 While ABS transactions typically involve large reference portfolios of fairly homogenous obligations, CLO transactions allow issuers to refinance large notional pools of limited number of highly concentrated and heterogeneous credit risk exposures, they have either originated themselves (balance sheet CLO) or bought specifically for the purpose of profitable re-packaging of investment exposures (arbitrage CLO). Issuers also value loan securitisation not only as an alternative3 financing tool but also as an expedient structure of credit risk transfer4 for reasons mainly to be found in economic capital and liquidity benefits through alternative market-based financing (financial objectives), improved diversification capabilities (hedging and risk management objectives), enhanced balance sheet management and restructuring opportunities (accounting objectives), optimisation of regulatory capital required bank regulators (regulatory objectives) and mitigation of agency costs of asymmetric information between issuers and external financiers (capital structure choice). Especially financial objectives (including tax optimisation, efficient refinancing cost and rating arbitrage) and risk management objectives (such as the diversification of default risk, liquidity risk, interest rate risk and currency risk) are probably the most prominent motives that sustain the premier status of loan securitisation in structured finance markets. By subjecting securitised asset exposures to the disciplining effect and fair asset pricing of market scrutiny loan securitisation also facilitates prudent risk management as an effective method of redistributing credit risks to investors through issued debt securities by installing capital markets as external sources of funds.5
Since loan securitisation blends asset pricing features of securitised exposures (“credit risk component”) and liquidity enhancing security design features of fixed income securities issued as contingent claims thereon (“security component”), private information from lending relationship might compromise the fair asset pricing due to the agency cost associated with adverse selection and moral hazard on the part of asset originators and issuers.6 Depending on the security design and the kind of securitised asset type, rating agencies commonly require issuers to provide credit enhancement through first loss provisions and/or other forms of credit support (e.g. default loss subordination) to cushion investor against ex ante moral hazard of poorly performing loans issuers might include in the transaction in absence of full investor information about securitised loans.7 Hence, the economic assessment of loan securitisation primarily depends on how
the transaction structure translates the performance of securitised credit risk into the default term structure of issued asset-backed securities. Since issuers can choose from a vast variety of transaction structures to subdivide and redirect cash flows and losses from the repayment of securitised assets, the transmission mechanism between the securitised asset performance and investor returns as contingent claims is acutely relevant for the valuation of CLOs.
1.2
Research objective
The main objective of this paper is to estimate the default term structure and the fair pricing of default sensitive contingent (debt) claims (tranches) held by risk-neutral investors in a typical CLO-style loan securitisation transaction on a pooled multi-asset reference portfolio of defaultable exposures. On the basis of a common CLO security design we evaluate how the loss sharing effects between issuers and investors caused by tranche subordination transposes credit risk of securitised assets into investment risk of contingent debt.8 For this approach to be viable, we equally privilege both methodological accuracy in estimating portfolio credit risk and the distinctive characteristics of securitisation. Tranche subordination creates leveraged investment, which makes the risk-return profile of CLO investment different from direct investment in the underlying portfolio. Hence, the seniority and thickness of tranches according to a specific security design imply varying degrees of credit risk leverage of each constituent tranche. Since subordination renders leveraged securitised debt highly sensitive to value changes of a precisely defined reference, it is essential to evaluate securitised debt claims at higher confidence levels (i.e. extreme quantiles) of expected loss. At the same time, efforts to diversify as much idiosyncratic risk as possible within a reference portfolio of securitised exposures make CLO tranches (with substantial systematic risk exposure) highly vulnerable to extreme event scenarios associated with systemic shocks. Consequently, the analysis of extreme loss quantiles registers as a vital step towards the accurate estimation of investment risk in loan securitisation. We postulate extreme value analysis as an appropriate complementary to the normality
paradigm of loan default to gauge credit losses at very high levels of confidence (like in stress testing) based on precise information about the tail behaviour. General limit loss distributions in many existing credit risk models rely on imprecise information about tail properties and fail to capture the empirically stylised fact of heavy-tailed loss distributions. Hence, the approximation of the probability density for very low tail probabilities requires the specification of a limit law that incorporates the occurrence of extreme values.
Extreme value theory (EVT) focuses exclusively on the asymptotic tail shape of loss distributions as a canonical theory of deriving parametric estimates as limit laws for standardised (ordered statistics) maxima of loss generating asset value processes. Moreover, in keeping with the diversified nature of securitised credit risk we marry extreme value analysis with the recent literature on credit risk models with a portfolio view, i.e. the portfolio-based estimation of loss quantiles. Our loss function is derived from parametric bootstrapping through EVT based on an infinitely granular loan portfolio, where systematic risk impacts on aggregate (uniform) default at constant between-asset correlation.
Our loss-based asset pricing model of CLO tranches as contingent claims held by risk-neutral investors on securitised credit exposures breaks down into three methodological steps. First, in keeping with the diversified nature of securitised debt and current credit risk portfolio models we specify the loss function of securitised loans on the assumption of an infinitely granular reference portfolio of defaultable debt, where systematic risk impacts on aggregate (uniform) default at constant between-asset correlation. Second, we subject Monte Carlo simulated random default losses to a simplified subordination mechanism commonly found in CLO transactions, which yields the tranche-specific default term structure of expected and unexpected losses over the specified lifetime (i.e. maturity) of the transaction. This approach allows the decomposition of a CLO transaction into a collection of simpler securities with divergent risk profiles due to subordination. Since we derive the default term structure from intensity-based simulations of default under both robust statistics and extreme value analysis, our model produces more reliable approximations of investment risk of asset-backed securities compared to previous studies. Third, the accumulated loss severity of each constituent tranche discounted by some stochastic risk-free interest rate determines the return risk-neutral investors would expect from the estimated default term structure. Since we do not control for the market risk premium of defaultable debt under the risk-neutral measure, we compute “quasi risk-neutral” returns as physical discount for expected periodic credit loss. Since the size and the seniority of tranches constitutes the subordination routine of loss allocation, the estimated default term structure and the pricing of individual tranches reflects the transmission mechanism implied by the chosen security design of securitisation. Our findings suggests a dichotomous effect of loss cascading on investment risk in loan securitisation as the most junior tranche of CLO transactions exhibits a distinctly different default tolerance compared to the remaining tranches, which might explain why issuers generally retain the most
junior tranche as credit enhancement. In advent of imminent changes to the Basle Accord on the regulatory treatment asset securitisation according to the so-called Securitisation Framework (Jobst, 2005; Basle Committee, 2004a and 2004b),9 our methodology might be instructive in how to derive a reasonable benchmark of investment risk in loan securitisation. Moreover, our model delivers a plausible rationale as to why financial institutions draw comfort by providing credit enhancement in the form of first loss coverage. So far none of the existing models has been able to explain this phenomenon on the basis of intensity-based default simulation.
2
L
ITERATURER
EVIEWAlthough there is not a single theory that exhaustively explains the economic nature of loan securitisation, research in asset securitisation has so far entertained a diverse range of corporate finance-based arguments for securitisation as an efficient means of external finance: (i) issuers exploit private information about securitised assets as a way to mitigate the regulatory capital charge and achieve greater specialisation in areas of comparative advantage (Greenbaum and Thakor, 1987); (ii) issuers avoid asset substitution and underinvestment as they appropriate partial debtholder wealth by carving out a defined portion of pooled assets to satisfy securitised debt (James, 1988; Benveniste and Berger, 1987; Stulz and Johnson, 1985); and (iii) issuers reduce the agency cost of asymmetric information if securitised debt constitutes a safer claim than other forms of external finance (Barnea et al., 1981; Myers and Majluf, 1984). However, it has not been until recently that the joint effect of the security design and the characteristics of securitised credit exposures on investment risk has sparked academic interest. Although a large number of prescriptive approaches lack comprehensive appeal and ease of implementation, it appears as if a comprehensive asset pricing methodology in this area would need to transcend models in three major areas of finance research:: (i) estimation and pricing of (portfolio) credit risk (Lo and Davis, 2001; Jarrow et al., 1997; Jarrow, 1996),10 (ii)
security design and asset liquidity (Bhasin and Carey, 1999; DeMarzo and Duffie, 1997 and 1999),11 and (iii)
information economics in asset securitisation (Jobst, 2003b; Duffie and Gârleanu, 2001 and 1999; Riddiough, 1997). DeMarzo and Duffie (1999 and 1997) assert that issuers of securitised debt can overcome the “lemons problem” (Akerlof, 1970) of asymmetric information associated with the sale of illiquid assets by bundling and re-packaging payment claims from asset exposures into a basket of different classes of subordinated tranches as collateralised contingent claims (Jobst, 2003a). Riddiough (1997) finds information benefits from subordinated security if it allows issuers to internalise some or all of the adverse selection risk and appropriate economic rents from their information advantage if they retain an equity claim on the performance of securitised assets. Childs et al. (1996) propose a structural model for pricing
commercial mortgage-backed securities (CMBS) through Monte Carlo simulation of a portfolio of individually correlated mortgages in order to derive an optimal security with asset retention by the issuer.
More recently the default-based valuation of securitised debt has benefited from the emergence of credit risk portfolio models, which assume a stochastic process of asset value change and default-correlated credit risk exposure. Past research in this area has generated a wide range of different approaches (Black and Cox, 1976; Brennan and Schwarz, 1978; Leland, 1994 and 1998), which can be broadly classified into three categories (by mathematical technique used): (i) standard intensity-based models (Egami and Esteghamat, 2003; Zhou, 2001; Lucas et al., 2001; Duffie and Singleton, 1999; Lando, 1998; Zhou, 1997), (ii) copula models
(Embrechts et al., 2001a and 2001b; Li, 2001; Schönbucher and Schubert, 2001; Schönbucher and Schubert, 2001; Nelsen, 1999) and (iii) Markov chain and contagionmodels (Kijima et al., 2002; Davis and Lo, 2001; Jarrow et al., 1997). Industrial applications have simplified these approaches into endogenous models
(e.g. credit migration approach and structural approach), actuarial models and econometric models.12 Many of these models have been used to derive a default-based valuation of asset securitisation transactions, such as an intensity-based approximation of defaults within a jump-diffusion process of a securitised loan pool (Egami and Esteghamat, 2003) or with default correlation from Moody’s diversity score (Duffie and Gârleanu, 2001). Egami and Esteghamat (2003) approximate the value of a basket of default-correlated debt assets in collateralised debt obligations (CDOs) by means of calibrating a pricing model to a pure intensity-based simulation of defaults. However, many straightforward loss-intensity-based pricing methodologies of
collateralised debt obligations (CDOs) and alternative asset pricing techniques13 are scarce or at least contentious (Fidler and Boland, 2002), mainly because the valuation of contingent claims on the performance of multi-asset portfolios defies a closed-form solution in most cases. While analytically tractable pricing models with common risk factors (Gibson, 2004) tend to be overly simplistic, simulative robust statistical analysis (of standard intensity-based models) attributes little probability to extreme loss scenarios. In this paper we tender a default-based asset pricing methodology for loan securitisation (e.g. CLOs) as one of the most recent fixed income instruments in structured finance. We offer a new and original contribution to traditional pricing models of asset-backed securities by introducing extreme events in the default profile of securitised assets to account for the high risk sensitivity of leveraged investment in subordinated debt structures.14 Although we deliberately forgo the analytical reliability of a static closed form pricing (Gibson, 2004), the richness of our methodology more than compensates for the shortcomings of a simulative approach as grants much needed analytical latitude to estimate the variation of investment leverage over time of different default scenarios (increasing and decreasing) under competing limit distributions. Assuming general dependencies of credit risk factors we simulate the intensity-based default term structure of an infinitely granular multi-asset portfolio with uniform asset
correlation to compute the compensatory return of risk-neutral investors for tranche-specific expected losses by reversing Jarrow and Turnbull (1995) and Leland and Toft (1996), who back out an arbitrage free pseudo-probability of default from the term structure of credit spreads of corporate bonds.15 In this way we decompose subordinated claims into a collection of simpler securities with divergent risk profiles and return expectations on the basis of fixed and stochastic16 risk-free discount rates.17
The rest of the paper is organised in six sections. We present the model specification of a loss-based valuation of subordinated CLO tranches as a phased integration of three essential components. First, we simulate intensity-based aggregate default losses under extreme value analysis and robust statistical analysis at constant and time-varying periodic default probability. Subsequently, we allocate estimated default losses to constituent tranches according to the subordinated security design. Finally, we derive a tranche-specific default term structure, which implies the compensatory return risk-neutral investors would expect from holding these securities. Finally, we complete a robustness check of our estimation results by analysing the relationship of expected and unexpected losses as well as the leverage of investment returns across tranches with different seniority. In our post-simulation assessment we discuss the incentive of both issuers and investors to acquire certain tranches on the theory of information asymmetries. In conclusion, we revisit important findings and propose to possible extensions.18
3
M
ODEL3.1
Loss distribution of a uniform reference portfolio
As the first component of the CLO pricing model we specify the distribution function of default losses in the securitised reference portfolio. For this purpose we resort to a normal inverse distribution and a quasi-Pareto distribution from extreme value theory to simulate the loss profile of a perfectly diversified reference portfolio of credit exposures. In keeping with past attempts to simulate credit risk of standard (bank) loan portfolios we assume individual risk to be perfectly diversified in an infinitely granular portfolio, so that we can consider the reference portfolio to be of uniform credit risk with equal pairwise asset correlation. Once we have computed expected and unexpected losses, we determine the periodic default losses for the transaction and the constituent tranches by means of a certain loss allocation routine.
As the number of loans grows to infinity the notion of a uniform portfolio with homogenous asset exposures has been the basis for credit portfolio models with normality assumptions. Vasicek (1987), Finger (1999) as well as Overbeck and Wagner (2001) derive default losses from a normal inverse distribution function NID p
(
,ρ)
with default probability p>0 as mean and equal pairwise asset correlation ρ<1 for a portfolio of h loans with equal exposure 1h for h→ +∞ and portfolio losses≤ ≤ 0 x 1 is denoted by
(
)
(
1 1)
( , , ) 1 ( ) ( ) NID x p ρ =N −ρN− x −N− p p (1)with density function
(
)
(
(
1)
)
1(
(
1 1)
)
( , , )x p 1 n N ( )x n 1 N ( )x N ( )p
φ ρ = −ρ ρ× − − × −ρ − − − ρ , (2)
where the standard deviation σ =
(
−1 −1 ρ)
− 22 ( ), ( );
N N p N p p is derived from the bivariate normal
distribution N x y2( , ; )ρ with a zero expectation vector.19 However, since the occurrence of extreme events takes a pivotal role in the accurate approximation of credit portfolio losses, we need to extend this approach to take account of the extreme tail behaviour of credit events. Alternatively to the normal inverse distribution of random variables on a uniform space, in the next section we propose extreme value theory (EVT) to model the loss distribution function of credit portfolios.
3.1.2 Extreme value theory (EVT)
Merton-based credit risk models rely on distributional assumptions that imply an underlying stochastic process of reasonable asset volatility around some mean expectation, where the frequency and the size of random observations Sn =X1+ +... Xn define quantiles as multiples of standard deviations around the mean of some probability distribution. For loss of precise information about the true probability density associated with extreme events, these general assumptions about asymptotic tail behaviour (“dependent tail behaviour”) generate limit distributions (Login, 1996). However, if one was to efficiently approximate the probability density for very high confidence levels, i.e. very low tail probabilities (Lucas et al., 2002), in stress test scenarios, one needs to specify a limit law that incorporates the occurrence of extreme values. Extreme value theory (EVT) helps translate random phenomena into a tail shape irrespective of the
distribution function by solving the right or left limit results of normalised maxima of i.i.d. events
(
1)
max ,...,
n n
M = X X or Mn =min
(
X1,...,Xn)
. Hence, the objectives of extreme value analysis and robust statistical analysis are apparently contradictory. While extreme data (outliers) are underestimated in robust statistics, these very observations receive most attention in EVT, where parametric models are fitted to exceedances over large thresholds to characterise the tail behaviour of extreme order statistics (Vandewalle et al., 2004).20 Empirical evidence about the actual loss profile of credit exposures suggests a higher likelihood of extreme portfolio losses than what would be expected if credit loss was a normally distributed random variable. For an adequate parametric description of thicker tails we resort to EVT, which attributes higher probability to extreme (credit loss) quantiles and EVT claims methodological attractiveness due to its flexibility in model calibration. In the remainder of this section we derive a loss distribution with polynomial tail decay as a specialised form of a Pareto function within the domain of attraction of the generalised extreme value distribution (GEV), where the scaled maxima are bounded by the maximum portfolio size of securitised loans in place. In this way we improve on the normal inverse distribution (NID) as a basis for the estimation of extreme quantiles consistent with Lucas et al. (2001).21We define EVT as a general statistical concept of deriving a limit law for sample maxima Rx∈ℜ (Fisher and Tippett, 1928), where the generalised extreme value distribution (GEV) (Jenkinson, 1955) establishes the domain of attraction for limit distributions of normalised maxima or minima drawn from random variables with an upper bound. Let X X1, 2,...,Xn be a sequence of i.i.d. random variables with a common unknown distribution function F
( )
. and the corresponding ascending order statistics X1,n ≤ ≤... Xn n, with normalised sample maxima Xn n, =max{
X X1, 2,...,Xn}
converging to a non-degenerate limit distribution( )
lim n n, n x n x n X b H R P R a ξ →∞ − = ≤ (3)for a sequence of constants an >0, bn ∈ℜ and n→∞. If F
( )
. satisfies this expression, it falls within the maximum domain of attraction of Hξ( )
Rx , so that F∈D( )
Hξ . Assuming stationarity and ergodicity22the limit distribution above transforms to the GEV distribution
( )
[
(
)
]
(
)
[
]
= ℜ ∈ − − > > + + − = − − 0 , exp exp 0 , 0 1 1 exp 1 ξ ξ ξ ξ ξ ξ x x x x x R R R R R H , (4)where the location parameter (“tail index”) ξ specifies the size and frequency of extreme events of asymptotic tail behaviour with a peak at x=ξ , where ξ ≥0 and ξ <0 indicate heavy and light tails respectively. The heavier the tail the slower the speed at which the tail approaches its peak x at y-value of 0 and the smaller the absolute value of the tail index parameter.23 We define the loss distribution as a generalised Pareto distribution function (GPD)24,25 within the maximum domain of attraction
( )
ξ H D
F∈ ,
with the tail behaviour of standardised maxima capped at the asset portfolio size, so that
(
)
(
)
1 1 1 for 0 ( , , ) 1 exp for 0 x G x x ξ ξ β ξ ξ β β ξ − − − + ≠ = − − = , (5)with Rx ≡−
(
x −ξ)
β , scale parameter β >0 as well as x ≥0 for ξ ≥0 and 0≤ ≤ −x β ξ for ξ <0 .26 In order to model the loss profile of finite portfolio size we expand the support of GPD to ℜ, so that(
)
(
)
(
)
(
)
(
)
(
)
1 2 2 ( , , , , ) 1 1 2 1 exp x x s L x s x ξ ξ ρ ρ ξ β ρ β δ ρ β − − × − + − + = − + × + − − . (6)Besides the scale parameter s>0 we also introduce the adjustment factor ρ∈ℜ for re-parameterisation in the subsequent mapping procedure of L x
( )
with portfolio losses 0≤ ≤x 1. Mapping the loss distribution function L(x) above onto the inverse uniform distribution 1( )
d
U− u with random variable
[ ]
0,1u∈ and x∈ −
[
d d;]
as upper and lower bounds(
min= −d, max=d)
of Ud−1( )
u yields( )
( )
( )
( )
( )
x U( )
u d L d L d L x L x Ld − − for ~ d−1 − − = .27 (7) ρ = −1( )ρu Ud is obtained through re-parameterisation, where both βand s depend on the level of d.28,29
Based the above loss distribution function we now run a Monte Carlo simulation of uniformly distributed random defaults to estimate expected and unexpected losses of the securitised loans along two dimension – time and security design. We derive periodic losses by “time slicing” estimated total default loss at maturity (i.e. investment horizon). This approach allows us to determine the residual value of the securitised reference portfolio (and the principal value of issued tranches) after periodic loan default, which is assumed to occur in arrears at the end of each period. These periodic losses are then allocated to the different tranches in order of seniority, where the “tranche thickness” implies the level of loss absorption of each tranche. This subordination mechanism of “loss cascading” is frequently found in CLO transactions as credit enhancement.
3.2.1 Monte Carlo simulation
Even though the respective density function φ( , , )x p ρ of the NID could be calculated by product folding, a closed form display of the results does not seem to be possible and warrants numerical computation (Overbeck and Wagner, 2001). In absence of reliable historical data for securitised credit losses, we generate uniformly distributed random variables x for the Monte Carlo simulation of both NID- and EVT-distributed credit losses. For instance, in the case of NID this approach requires the computation of uniformly distributed random variables Z~U(0,1) and their subsequent transformation to periodic losses for each time step j with
(
)
(
)
1( , , ) 1( ) 1( ) 1
j j j
x NID z p= − ρ =N N− p − ρ N− z − p (8)
by choosing the parameters of the loss distribution function such that the first two moments match the ones obtained from the NID. For EVT the transformation and mapping procedure in section 3.1.2 applies analogously. We ignore the effects prepayments and amortisation on the notional amount of portfolio value. The timing of defaults is assumed to take place at the end of each period j to ensure consistency in the approximation of relative portfolio losses per period against the background of a declining principal balance. We let the default probability (PD)30 for each period be either constant or time-varying (increasing vs. declining). The latter assumption of time-dependent risk exposure is fundamental to a dynamic estimation of the default term structure and its attendant effect on periodic loss cascading over life of the securitisation transaction. The PD equates to expected loss given default with initial notional portfolio size set to unity.
3.2.2 Time slicing
Assuming a discrete time grid t0 < < < <t1 tj ... tn−1<tn , the accumulated estimated loss L over the time horizon n (with portfolio losses accounted for at the end of each time period j n∈ ) can be quantified as
(
)
1 1 0 1 j n i j j i L =∑ ∏
= =− −X X , (9)with ~Xj NID x p( , , )ρ or Xj ~ ( , , , , )L x ξ β ρs for j n∈ , where Xj denotes the relative portfolio loss (on the residual exposure 1−Xi from the previous period i= −j 1) at time period j n∈ for either distribution of an uniform reference portfolio, whose notional value is set to unity at time j=0. The absolute losses per period are determined based on a periodic random draft of uniform default loss in the remaining portfolio value each period after it has been reduced by the default loss of the previous period. Aggregating these estimated periodic losses yields the absolute losses over the entire investment horizon
n.31
3.2.3 Loss cascading
Based on these aggregated losses we allocate periodic default losses to the different constituent tranches in order of seniority. This subordination mechanism of “loss cascading” is frequently found as one form of credit enhancement in CLO transactions and resembles the waterfall mechanism of damage claims in a sequence of default-correlated reinsurance contracts. In our model subordination means that portfolio losses L are allocated successively to the constituent tranches according to the level of seniority, so that tranches more senior than the lowest (i.e. most junior) tranche only bear losses once the all tranches more junior have been fully wiped out by default losses.32 In our specification investors in tranche k∈m have to bear aggregate losses up to αk% of the total default losses on outstanding notional value of the transaction, where αk signifies the notional amount of the tranche k (“tranche thickness”). Any remaining losses allocated to the more senior tranche k+1 up to the amount of αk+1%. So if one tranche k has been fully exhausted (denoted by the interval αk −αk−1 as the loss bearing capacity of tranche k), further losses are allocated to the subsequent, more senior tranche. This bottom-up cascading process perpetuates until all losses for a certain period are allotted to the relevant tranches. The tranche sizes 0≤α0 <α1<...αm−1<αm as the boundaries (i.e. attachment points) of loss allocation are time-invariant and have been chosen on the
historical basis from a weighted-average market benchmark of the typical security design of CLO transactions since 1997. The “first loss position” has been set to the interval of [0-2.4%] (Tranche 1) of notional transaction value, while “investor tranches” are represented by [2.4-3.9%], [3.9-6.5%], [6.5-9.0%], [9.0-10.5%] and [10.5-100%] (Tranches 2-6). These boundaries are time-invariant and lack the notation j
for the time period. This allocative routine determines the expected credit loss per tranche in time period j,
(
1)
(
1)
1 1 1 ( ) n n j k k k k k j k k j j x L L α α α α α f x dx + − − − = = − ∧ − = = −∑
∑∫
, (10)where the meet
(
xj αk 1)
(
αk αk 1)
+− −
− ∧ − denotes the periodic default loss in time step j as the
proportional default loss of the reference portfolio borne by tranche k. Lk and Lkj for the loss density function f(x) denote the relative loss borne by each tranche on aggregate (over life of the transaction with maturity n) and at the end of each period. The issuer commonly retains the lowest, most junior tranche (commonly termed the “equity piece”) with a default loss tolerance of α0−α1 as “first loss position” as a commitment to bear part of the losses due to expected non-performance of the reference portfolio. This prioritisation of structured claims reduces (increases) the default tolerance (investment leverage) of the successive tranches, which will be discussed later in this paper.
4
E
STIMATIONR
ESULTS4.1
Default term structure of tranches
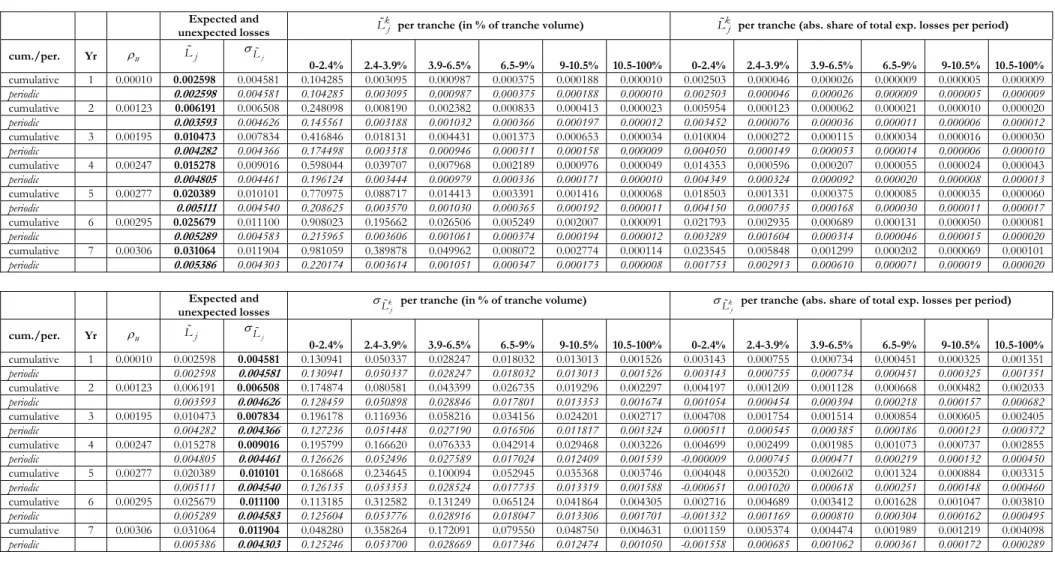
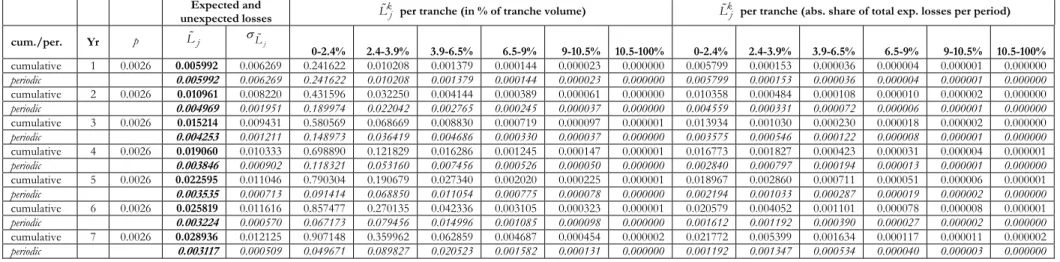
We derive the term structure of expected losses from a Monte Carlo simulation with one million iterations of relative portfolio losses Xj for j =1,...,n on the basis of two loss distribution functions – a normal inverse distribution (NID) (see section 3.1.1) and a GEV distribution from extreme value analysis (see section 3.1.2). Tabs. 4 and 7 (Appendix 1) exhibit how the subordinated transaction structure affects the development of the principal balance of a securitised reference loan portfolio over time, as periodic default losses are allocated to tranches according to seniority and loss bearing capacity. The first column denotes the year, the second the respective (forward) default rate p and the third and fourth columns list the mean and the standard deviation of the cumulative and periodic default loss of all tranches (i.e. estimated expected loss Lj and unexpected loss
j
L
expected default loss k j
L for each of the six different tranches with respect to their notional value and total periodic losses. We also provide the same breakdown for unexpected losses σk
j
L .
Both loss functions yield similar approximations of periodic portfolio losses (expected loss k j
L and unexpected loss σk
j
L ). The first moment of estimated expected loss k
j
L per tranche (slope of estimated losses) increases under both loss functions, albeit the periodic loss of the first loss piece [0-2.4%] flattens from the fifth year onwards as accumulated losses begin to exhaust the notional amount of the most junior tranche (see section 3.2.3). As tranches gain in seniority the default term structures under the chosen loss distributions deviate from each other at an increasing rate, especially in the mezzanine tranche [6.5-9.0%]. Although the cumulative tranche-based loss allocation increases monotonously, we observe a distinctive dichotomy of default tolerance between the most junior (equity) tranche (reflected in the first tranche [0-2.4%] 1
j
L ) and the remaining “investor tranches” (see Appendix 2, Fig. 1 for EVT and Fig. 2 for NID). While the expected loss for the first tranche follows a linear function, expected losses of more senior tranches increase in an exponential fashion over time The disparate loss profiles of tranches are attributable to the gradual erosion of the loss absorbing capacity of the most junior tranche, which in turn is caused by the security design of subordination and, to a lesser degree, by the distribution of default losses. Since the cumulative incidence of credit losses is skewed towards the extreme end of the distribution, an EVT-based loss function seems to reflect the “loss reality” more truthfully than the Gaussian assumptions of generalised asymptotic tail behaviour in standard limit distribution functions.33,34 The proposed specialised form of a generalised extreme value distribution emphasizes extreme loss scenarios, which increase the default rates for more senior “investor tranches”. The first loss position under EVT is almost entirely exhausted by estimated default losses, while more moderate loss events under NID leave a good part of the most junior tranche untouched.
4.2
Variable portfolio quality – default losses of all tranches
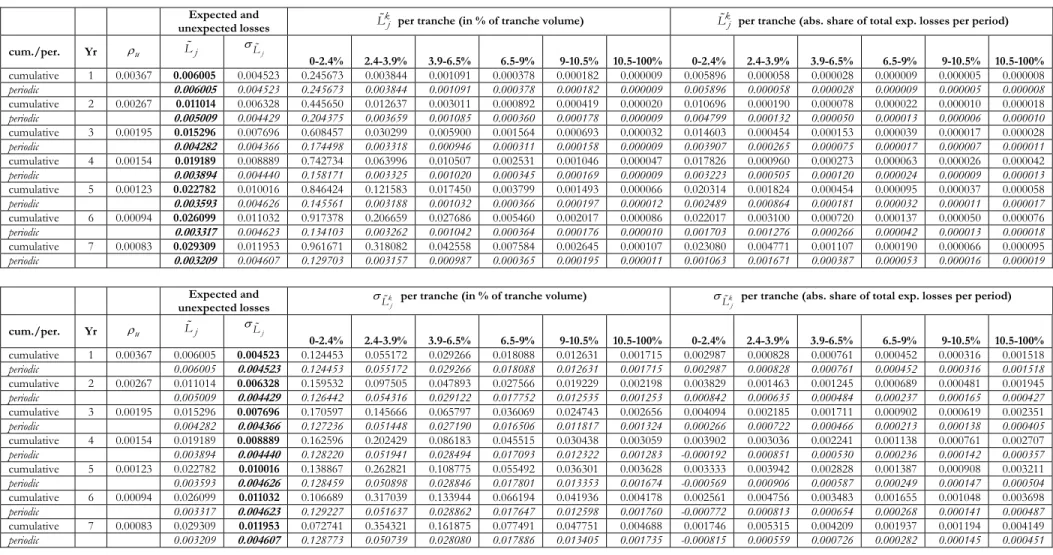
In cognisance of time-dependent variation of default risk we also consider variable portfolio quality at a sequential upward and downward drift of one-year default probabilities under both distribution functions. These scenarios of impetuously improving and decreasing portfolio quality have been modelled in a way that the weighted-average default probability matches the periodic default probability for the case of a
constant rate of portfolio losses over the life of the transaction. For a deteriorating (improving) portfolio quality the initial default probability is lower (higher) than in the case of a constant default probability. In the following section we investigate the (tranche-specific) default term structure for a strictly deteriorating asset portfolio (“back loaded”) and a strictly improving portfolio (“front loaded”) as two extreme cases of how changes in securitised asset risk translate into expected and unexpected losses. Tabs. 5-6 (EVT) and Tabs. 8-9 (NID) in Appendix 1 and Figs. 10-13 in Appendix 2 display our estimation results and the corresponding plots of a deteriorating and improving portfolio.
In section 4.1 we saw that periodic expected losses subside asymptotically for a constant default rate under both EVT and NID loss distributions, mainly because accumulated losses almost fully exhaust the notional amount of the most junior tranche before subsequent tranches bear any losses. This property is reflected in the concave shape of the default term structure curve for cumulative default losses. We find that a gradual increase of the periodic default rate partially reverses the term structure of the most junior (equity) tranche during the first three periods in the case of NID, but finally follows the term structure for a constant default probability. Under EVT periodic expected losses allocated to the equity tranche [0-2.4%] and the investor tranche [2.4-3.9%] are positively concave (but remain constant under NID) for an overall deteriorating portfolio quality. The main investor tranches [3.9-6.5%], [6.5-9%], [9-10.5%] and [10.5-100%] maintain an almost constant periodic default profile under both EVT and NID. In contrast, improving portfolio quality induces a negatively convex term structure of periodic losses for the most junior (equity) tranche [0-2.4%] under both loss distributions. The periodic default term structure of the subsequent tranche [2.4-3.9%] changes from being positively convex to positively concave after three periods for NID, while it remains negatively convex for EVT throughout all periods of the simulation. We observe a constant periodic default loss of more senior investor tranches [3.9-6.5%], [6.5-9%], [9-10.5%] and [10.5-100%] for a decreasing portfolio default rate, too. These periodic loss profiles of constituent tranches for time-varying default rates translate into a default term structure of cumulative losses, which differs significantly from our findings in the case of a constant annual default rate (see Appendix 2, Figs. 1-3). While the first moment of cumulative losses borne by the first tranche gradually builds up over time, the more senior [2.4-3.9%] and [3.9-6.5%] tranches have to shoulder a disproportionately higher degree of default loss under both EVT and NID. Especially the rapid increase of expected losses carried by the [3.9-6.5%] tranche compared to the next senior [6.5-9%] tranche (particularly for NID-distributed losses, less so for EVT) warrants particular attention as to the implications of a varying default rate on the simulated term structure. At a continuously decreasing loan default rate high initial cumulative loss burden by the first loss tranche precludes high loss allocation during later periods, so that the default term structure begins to flatten half way through the life of the transaction. At the same time, especially the [2.4-3.9%]
tranche picks up most of the loss exposure, leaving less expected losses to more senior [3.9-6.5%] and [6.5-9%] tranches.
Generally, relatively high (low) levels of early (late) loss absorption for a “front loaded” (“back loaded”) default profile of improving (deteriorating) and deteriorating time-varying portfolio quality induces negative second moments of cumulative expected loss allocated to the most junior (equity) tranche. In both cases of varying portfolio quality we discern a stark contrast between the lowest tranche and more senior investor tranches, which is explained by rapid exhaustion of limited loss absorbing capacity of the former. Although varying periodic default drives a wedge between the loss tolerance of the issuer and investors, nonetheless, it is less pronounced in the case of a varying periodic default rate compared to a constant default rate over the life of the transaction (see section 4).
4.3
Leverage effect
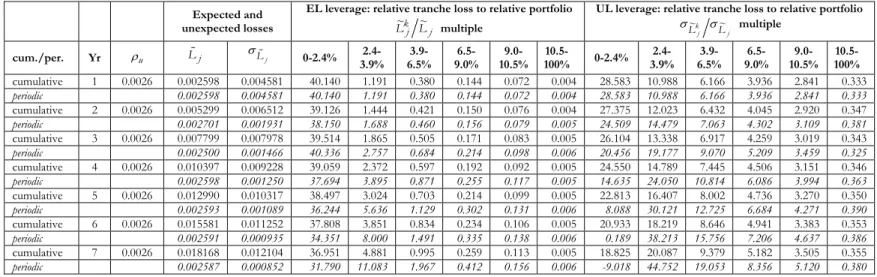
The estimated default term structure testifies to the structural risk sharing arrangement of loss allocation through the subordination of tranches in CLOs and other types of ABS transactions, which concentrates expected losses in a small first loss position, which bears the majority of the credit exposure, shifting most unexpected risk to larger, more senior tranches. Most importantly, however, this security design-induced
leverage effect imposes on the most junior tranches higher relative (expected and unexpected) losses than relative portfolio losses, which also implies higher exposure to unexpected risk of more senior tranches. Such a leverage effect assumes a typical three-tier securitisation structure of junior, mezzanine and senior tranches, where senior tranches represent about 80-90% of the entire notional amount of securitised debt (tranches). In Tabs. 10-15 (Appendix 1) we illustrate the leveraged exposure by tranche seniority as the ratio of relative expected and unexpected losses to relative portfolio losses for each period. As opposed to the static closed form, CDO pricing model (with one common risk factor-based default) in Gibson (2004) our approach is not limited to a one-period loss scenario of expected and unexpected losses. We can also analyse the time dimension of leveraged exposure for a both a cumulative and periodic default term structure based on two different intensity-based simulations (EVT and NID) of time-varying default (increasing and decreasing). Since most of the investment in the loan securitisation is “buy and hold” especially the time variation of leverage to portfolio losses is highly relevant to investors and regulators alike.
We find that tranche leverage decreases (increases) by absolute measure the higher (lower) the level of seniority, with all tranches but the most junior tranche exhibiting higher multiples for unexpected losses than for expected losses. These different degrees of leverage support our previous claim of extreme value
analysis to be most amenable for modelling the highly risk sensitive nature of securitised debt as leveraged investment. The computation of investment risk in securitised debt becomes even more intricate at lower (higher) loss sensitivity (leverage) of more senior tranches to expected losses if we take into account that the ratio of unexpected to expected losses for each tranche increases with seniority. As the volatility of expected loss contributes the lion’s share to total investment risk in more senior tranches, investors in these tranches also experience higher leveraged exposure from unexpected losses than they would on expected losses. We find that if the default probability is kept constant the leverage ratio of unexpected and expected losses increases over time across all tranches but the most senior and the most junior tranche. The multiples of unexpected and expected losses decrease in the case of the lowest tranche and remain nearly constant through time for the most senior tranche. If we let the default probability vary over time all “investor tranches” but the most senior tranche gain appreciably in expected loss leverage (and less so for unexpected losses leverage). The expected loss leverage of the most junior and the most senior tranche are close to invariant to either a deteriorating or improving portfolio quality. This also applies to unexpected loss leverage of the most senior tranche but not to the most junior tranche. So mezzanine investors seem to bear the brunt of adverse effects on investment leverage from varying portfolio quality. Interestingly, “investor tranches” exhibit a higher first moment of leverage for periodic expected losses than periodic unexpected losses. So the time dimension of periodic loss leverage qualifies our earlier observation of highly leveraged unexpected loss exposure in more senior tranches. An optimal low leverage strategy over the short holding period would prescribe short-term investment in more junior tranches (due to low leverage on expected losses during the initial periods and a higher portion of expected losses than unexpected losses) until a higher first moment of expected loss leverage warrants switching the investment to more senior tranches, were unexpected losses claim a greater share of investment risk and their leverage is subject to lower periodic changes over time.
5
P
RICING OFCLO T
RANCHESF
ORR
ISK-N
EUTRALI
NVESTORSBased on the simulated default term structures under different default scenarios we propose a simple pricing method to value CLO tranches at a riskless term structure in order to foster informed investment about this structured finance technology. In keeping with Jarrow et al. (1997) we compute the hypothetical spread over the risk-free rate risk-neutral investors would normally expect as compensation for expected default losses allocated periodically to each tranche according to the designated subordination mechanism. The expected loss associated with a time-varying, physical default probability reduces the notional tranche amount (i.e. expected cash flows) over time. The risk premium of each individual tranche solves for the rate of return that offsets periodic losses of a certain default term structure so that the net present value of
the residual principal portfolio balance discounted at a (fixed and stochastic) risk-free rate yields the riskless term structure35 that satisfies
(
)
(
)
(
)
(
)
(
)
(
(
)
)
(
(
)
)
1 1 1 1 1 1 1 1 1 1 1 1 1 1 1 1 1, 1 1 1 l 1 l l l m k n k m k n k n j k j k n j k j j j j j m n n n m f f m l f l f l l L r L r L r L r r r r − = = = = = = = = = = − − + − − + = + = ∏ + ∏ + + +∑
∑
∑
∑
∑
∏
∏
∑
(11) where∑
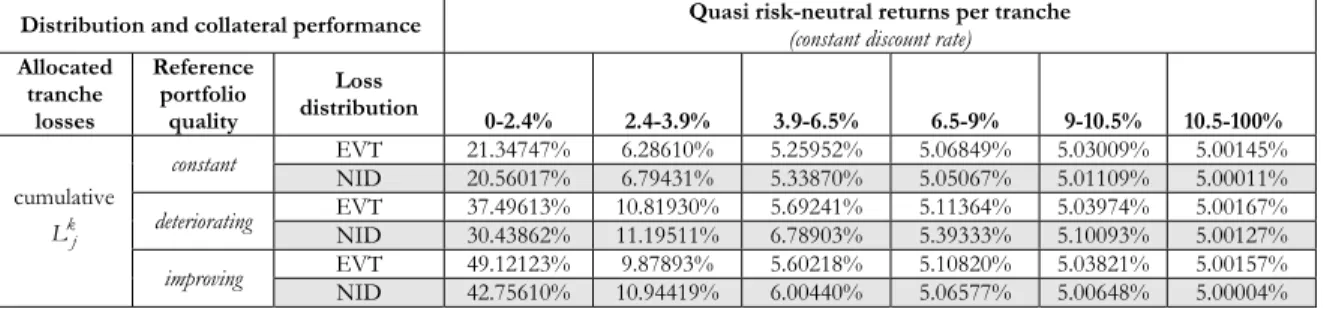
m=1 k jj L denotes the accumulated expected loss in the tranche k up to year j =7 and risk-free forward rate rf (fixed or stochastic). Note that our calculated return for risk-neutral investors is not inclusive of a market risk premium and only represents the fair rate of return as compensation for the physical default term structure of securitised tranches. Since our tranche returns are not derived as risk premia under the risk-neutral measure, we will use the term “quasi risk-neutral returns” for the remainder of the paper. Tab. 1 below reports tranche-specific risk-adjusted returns under both NID- and EVT-based loan default at a constant, a increasing and decreasing periodic default rate according to our estimated default term structures in Tabs. 4-9 (see Appendix 1) and constant risk-free rate rfl =rf =5.0%. The most junior [0-2.4%] tranche absorbs most of the periodic losses over the life of the transaction and commands a quasi risk-neutral return of 21.35% (EVT) and 20.56% (NID) for cumulative average annual losses with constant periodic default probability. Successive tranches claim lower investment returns as their decreasing default tolerance of accumulated credit loss induces quasi risk-neutral returns ranging from 6.29% (EVT) and 6.79% (NID) for the [2.4-3.9%] tranche to almost the risk-free rate of return for the most senior [10.5-100%] tranche.36
We find that the estimated investor returns vary significantly by the type of loss function. Since extreme value theory assigns higher probability to rare events with high loss severity (“thick tail”), EVT-simulated losses yield higher quasi risk-neutral returns than NID-based credit losses at a constant forward rate of default in the most senior “investor tranches” [6.5-9.0%], [9.0-10.5%] and [10.5-100%]. Conversely, the equity tranche [0-2.4%] and the mezzanine “investor tranches” [2.4-3.9%] and [3.9-6.5%] exhibit lower returns under the EVT approach than under the NID approach due to high initial loss absorption of the most junior tranches. However, we cannot infer a higher degree of estimated default for the first loss position under the EVT approach than under the NID approach unless we extend the exposition of expected quasi risk-neutral returns per tranche to the case of deteriorating and improving portfolio quality.
Distribution and collateral performance Quasi risk-neutral returns per tranche(constant discount rate) Allocated tranche losses Reference portfolio quality Loss distribution 0-2.4% 2.4-3.9% 3.9-6.5% 6.5-9% 9-10.5% 10.5-100% EVT 21.34747% 6.28610% 5.25952% 5.06849% 5.03009% 5.00145% constant NID 20.56017% 6.79431% 5.33870% 5.05067% 5.01109% 5.00011% EVT 37.49613% 10.81930% 5.69241% 5.11364% 5.03974% 5.00167% deteriorating NID 30.43862% 11.19511% 6.78903% 5.39333% 5.10093% 5.00127% EVT 49.12123% 9.87893% 5.60218% 5.10820% 5.03821% 5.00157% cumulative k j L improving NID 42.75610% 10.94419% 6.00440% 5.06577% 5.00648% 5.00004%
Tab. 1. Quasi risk-neutral returns for the various tranches under two different default distributions (EVT and NID) at cumulative constant, increasing and decreasing forward rates of loan default.
The stark contrast between quasi risk-neutral returns of the most junior tranche retained by issuers and mezzanine and senior tranches held by outside investors persists also for varying portfolio quality. A varying periodic forward rate of defaults entails higher returns for almost all tranches, irrespective of whether the first moment of the terms structure is positive or negative, and decreases in the seniority of a tranche. The equity tranche commands quasi risk-neutral returns well beyond 30% (40%) per period for a deteriorating (improving) portfolio quality, which reduces the yield associated with lower default exposure by mezzanine and senior tranches accordingly. For mezzanine and senior tranches returns are lower under improving rather than deteriorating portfolio quality (under both EVT and NID) as expected.
Although the level of quasi risk-neutral returns (especially the equity tranche) is mainly driven by the security design of the securitisation transaction (i.e. the relative thickness and seniority of constituent tranches), the specification of the loss profile for varying portfolio quality explains the plausibility of this counterintuitive result. As opposed to a constant portfolio quality, our simulated default term structure of an improving portfolio involves a higher than average default probability (and higher quasi risk-neutral returns) during the initial periods. This relationship gradually reverses as the transaction matures. The same logic applies to deteriorating portfolio quality. Since the high initial default rate of an improving portfolio is not discounted less heavy during the initial periods, the early exhaustion of most junior tranche translates into higher quasi risk-neutral returns in all junior and mezzanine tranches up to the [6.5-9.0%] tranche. Conversely, a low initial default rate in case of a deteriorating default term structure should result in quasi risk-neutral returns similar to the returns observed in the case of a constant default rate, mainly because increased default loss goes hand in hand with higher periodic discounting. Since higher back-loaded default losses for a deteriorating portfolio are subject to higher discount rates than front-loaded default losses of similar degree for an improving portfolio, a deteriorating portfolio produces lower compensation for default losses over time and, thus, should display lower quasi risk-neutral returns than an improving portfolio. Nonetheless, both cases induce higher quasi risk-neutral premium than a constant rate of decline
in portfolio quality according to our model set-up. According to these specifications a deteriorating portfolio quality is more favourable for bearers of most junior tranche, which requires a lower default tolerance (and lower quasi risk-neutral returns per period) for a deteriorating than for an improving portfolio. This effect is pronounced by the tail behaviour of the EVT-based loss function, which attributes higher probability to extreme losses and increases the chances of the equity tranche becoming fully exhausted by default loss early on. Overall the returns of the small equity tranche are most sensitive to changes in the portfolio quality and stochastic interest rates, whereas the largest nominal share of the transaction held by the most senior [10.5-100%] tranche is hardly sensitive to varying levels of periodic default loss.
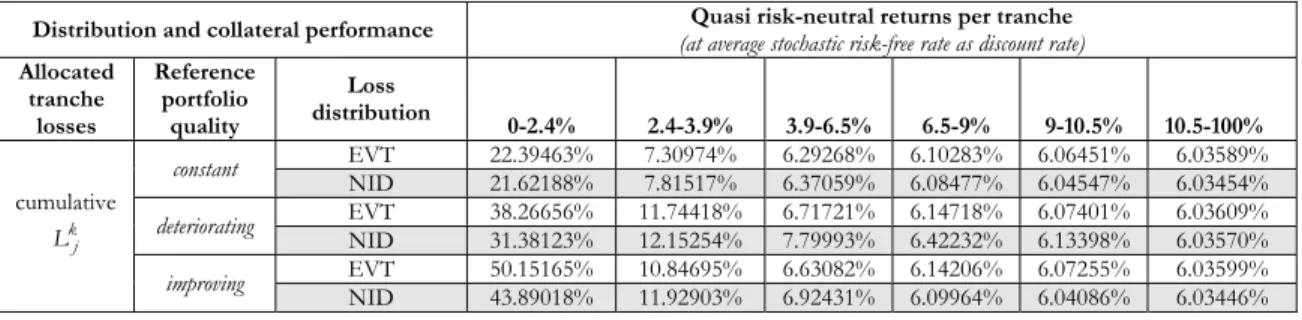
We further refine our findings be introducing a varying risk-free interest rate per period to the above pricing formula. We distinguish between two cases: (i) a stochastic risk-free interest rate and (ii) a constant risk-free rate as a stochastic average (level) of a fitted distribution of observed daily 12-month LIBOR rates over an eight-year period, which have been transformed to end-of-the week quotes. We adapt the interest rate model proposed by Hull and White (1995) for logarithmic interest rates at weak level stationarity (Yule-Walker estimator). On the basis of a maximum likelihood (ML) estimation of the probability distribution for AR(1) we simulate one million paths of estimated over seven years, i.e. 350 time increments. Subsequently, we estimate the quasi risk-neutral returns per tranche (see Tabs. 2-3 below) for a stochastic risk-free interest rate for both loss distributions (EVT and NID) at varying portfolio quality.
As opposed to the case of a fixed risk-free rate rfl per period (see section 5), now introduce stochastic interest rates. Although the summation of stochastic interest rates equates to the summation of constant risk-free interest rates due to mean reversion for t→ ∞ in general and m→ ∞ in our model, the variation of stochastic interest rates over time results in ≠ +
1
l l
f f
r r . If we substitute stochastic periodic interest rates
for constant risk-free interest rates rfl, the discount factor
∏
=(
+)
1 1 l
m f
l r is generally smaller for stochastic interest rates and yields lower quasi risk-neutral investor returns. The effect of a lower periodic discount rate will also become more pronounced as the CLO transaction matures. This has a significant bearing on the distinctive term structures of tranches, where the first loss position displays constant expected losses per period as opposed to “investor tranches”, which exhibit a non-linear increase of expected losses per period. In the case of stochastic interest rates returns for the first loss position will decline more than for mezzanine and senior tranches. Consequently, a stochastic interest rate, be it periodic or average-weighted, would lead to a marginal increase of the periodic discount rate and higher calculated returns of tranches than in the case of constant interest rates.
Distribution and collateral performance Quasi risk-neutral returns per tranche
(at average stochastic risk-free rate as discount rate)
Allocated tranche losses Reference portfolio quality Loss distribution 0-2.4% 2.4-3.9% 3.9-6.5% 6.5-9% 9-10.5% 10.5-100% EVT 22.39463% 7.30974% 6.29268% 6.10283% 6.06451% 6.03589% constant NID 21.62188% 7.81517% 6.37059% 6.08477% 6.04547% 6.03454% EVT 38.26656% 11.74418% 6.71721% 6.14718% 6.07401% 6.03609% deteriorating NID 31.38123% 12.15254% 7.79993% 6.42232% 6.13398% 6.03570% EVT 50.15165% 10.84695% 6.63082% 6.14206% 6.07255% 6.03599% cumulative k j L improving NID 43.89018% 11.92903% 6.92431% 6.09964% 6.04086% 6.03446%
Tab. 2. Expected quasi risk-neutral returns per tranche based on the average variable (stochastic) risk-free rate as constant discount rate.
Distribution and collateral performance Quasi risk-neutral returns per tranche(at stochastic risk-free rate as discount rate) Allocated tranche losses Reference portfolio quality Loss distribution 0-2.4% 2.4-3.9% 3.9-6.5% 6.5-9% 9-10.5% 10.5-100% EVT 22.62031% 7.45478% 6.43406% 6.24347% 6.20499% 6.17623% constant NID 21.84458% 7.96229% 6.51219% 6.22531% 6.18585% 6.17488% EVT 38.56835% 11.90002% 6.85962% 6.28793% 6.21451% 6.17644% deteriorating NID 31.65209% 12.31435% 7.94590% 6.56384% 6.27462% 6.17605% EVT 50.54813% 11.00315% 6.77326% 6.28283% 6.21305% 6.17634% cumulative k j L improving NID 44.25293% 12.09255% 7.06783% 6.24022% 6.18122% 6.17480%
Tab. 3. Expected quasi risk-neutral returns per tranche based on the periodically variable (stochastic) risk-free rate.
6
R
OBUSTNESSC
HECK: R
ATIO OF ESTIMATED AND UNEXPECTED LOSSESEmpirical evidence indicates that CLO tranches actually offer investors higher returns (Batchvarov et al., 2000) and defy the above assumption of a risk-free term structure of CLO tranches. This observation is not all too surprising given the inherent complexity of securitisation structures and the degree of simplification used in the proposed pricing model. For instance, investors might command higher returns for CLO tranches as liquidity premium or as premium for the leveraged exposure of tranches to changes in underlying portfolio quality as the degree of unexpected loss increases at a higher rate relative to expected loss (see section 4.3). In this section we investigate the relationship between unexpected and expected loss as a margin of error in the estimation of default losses to check the robustness of quasi risk-neutral returns.
EVT estimates of expected losses seem to reduce their margin of error much faster than estimates based on NID (see Appendix 2, Fig. 4). The different results for EVT and NID in Tabs. 16-18 (Appendix 1) stem from the EVT-based emphasis on the limiting behaviour of normalised maxima, which assigns more weight to credit losses of extreme events to be absorbed by the most junior tranche, which reduces the default risk of more senior “investor tranches”. The asymptotic development of unexpected losses borne
by the most junior tranche complements a strong decrease of unexpected losses relative to expected losses and a flattening of the default term structure. All k
j
k j L L
σ ratios decrease over time but differ
considerably in orders of magnitude of decline. In contrast to the whole portfolio and the first loss position [0-2.4%], which yield a balanced ratio on the basis of cumulative losses, the second tranche [2.4-3.9%] exhibits a k
j
k j L L
σ ratio in the order of 10, while in the remaining, more senior tranches σk j
L grows roughly twice as fast as k
j
L over time. In general, we find that the impact of σk j
L on the default term structure declines as the CLO transaction matures, whereas the variation of unexpected losses around the expected value increases with seniority. The term structure of unexpected losses vis-à-vis expected losses has critical implications for the analysis of the security design of securitisation transactions. Our results support the notion that issuers, who usually retain the most junior tranche as a first loss position in the transaction, are only exposed to a constant first moment of expected losses, while investors holding mezzanine (and senior) claims on the reference portfolio might face the prospect of a non-linear increase of losses over time due to an “implicit transfer” of unexpected losses by issuers.
7
C
ONCLUSIONThe main objective of this paper was the estimation of the default term structure and the pricing of subordinated, default sensitive debt claims (tranches) in CLO-style securitisation with loss cascading. In a general valuation model we investigated how loss sharing between issuers and investors through subordination effects the way securitisation translates securitised credit risk exposure into leveraged investment risk of issued tranches as an attractive investment and refinancing instrument. We first completed an intensity-based (parametric) simulation of periodic random default losses of an uniform loan portfolio based on two types of loss distribution functions (extreme value theory (EVT) and normal inverse distribution (NID)). Subsequently, we modelled the loss cascading mechanism to derive the periodic and cumulative default term structure of each tranche as well as the corresponding quasi risk-neutral rates of return.
Our results clearly flag a dichotomy of expected losses per tranche (and quasi risk-neutral returns) between the first loss position (equity tranche) and more senior “investor tranches”, mainly because the subordination of tranches concentrates expected losses in the small first loss position, shifting most unexpected risk to the larger, more senior tranches. The default term structure of cumulative loan loss allocated to the first tranche increases linearly and appears to be more sensitive to varying default rates of the underlying
reference portfolio than the more senior “investor tranches”, which exhibit a non-linear increase of default losses over time. Also relative loss volatility increases exponentially for tranches beyond the first loss position, where lower unexpected losses (i.e. the loss volatility of modelled periodic credit losses) engender a more accurate quasi risk-neutral calculation of tranche returns. Considering the potential agency problems between issuers and investors in securitisation structures, our results plausibly explain that issuers commonly retain the most junior tranche as first loss position as an effort choice to mitigate agency costs of asymmetric information about securitised assets. The retention of the lowest tranche is tantamount to the acceptance of a calculable “sure loss”, which allows issuers to implicitly transfer most of the loss volatility associated with securitised loans to investor tranches.
Since empirical evidence suggests higher stochastic weight associated with extreme events in corporate and retail loan portfolios (“thick tails”), the gulf between the default term structures of the most junior tranche and the remaining tranches is expected to widen in stress scenarios. Hence, the precise knowledge about the tail behaviour of default losses makes an EVT-based approach superior to other limit distributions, which merely assume moderate deviations around expected losses. Irrespective of the specific loss distribution function the effect of subordination remains most distinctive for the most junior tranche; yet, the EVT-based approach concentrates more expected cumulative losses on the most junior tranche (especially for a changing default rate to reflect time-varying reference portfolio quality) than a normal distribution function, with marginal periodic losses declining asymptotically. So if issuers properly account for expected losses by providing optimal first loss protection at a certain projected default profile, they benefit from an almost complete removal of unexpected losses from securitised loans. Since between 60% to 98% of expected losses are concentrated in the most junior tranche according to our simulation results, issuers offload most unexpected losses to investors.
The implications of the presented security design on the cumulative/periodic loss burden for extreme quantiles and the associated quasi risk-neutral return expectation per tranche underscore the significance of the transaction structure for the marketability of credit risk via loan securitisation. The retention of first losses from securitised loans seems to be largely motivated by incentives that extend beyond an effort choice to mitigate the agency cost of asymmetric information associated with the “credit component” of loan securitisation (e.g. information constraints of lending relationships). The subordinated tranching supports an efficient placement of debt securities within a security design, which enables issuers to subdivide and redirect cash flows from securitised loans into new investment instruments at an essential level of liquidity similar to “ordinary” fixed income securities as the “security component” of loan securitisation. At the same time, the significant decline of marginal unexpected losses over time in the first
loss position affords issuers more predictable investment risk than capital market investors, who hold the mezzanine and senior tranches (investor tranches). However, issuers have to be carefully manage unexpected risk in the selection of the credit risk of securitised loans as it influences their structural discretion to devise loss tolerance of each tranche within a particular security design. As unexpected risk becomes a more important component of investment risk than expected losses more senior investors also experience higher leveraged exposure from unexpected losses than they would on expected losses. We find that the lower the level of seniority (i) the higher the leverage of relative expected and unexpected losses per tranche to relative portfolio losses, (ii) the lower the ratio of unexpected to expected losses, and (ii) the higher the share of expected losses out of overall portfolio losses carried by the respective tranche.
Given the inherent ambiguity of securitised asset quality in CLO markets (especially in bank-based financial systems with relationship lending characteristics), our analysis highlights the importance of a careful review of how loss sharing provisions governing the allocation of beneficial interest and security design impact on the risk assessment and pricing of securitised loans. Our approach presents a first straightforward attempt at an instructive loss-based pricing methodology for CLO tranches based on the estimation of the default term structure of securitised loans. In extension to our model more comprehensive asset pricing models might allow for a flexible security design of CLO transactions, which would certainly further enhance investor understanding of loss sharing in structured finance products and promote informed investment in the bid to sustain a sufficiently liquid market for securitised loans.
8
R
EFERENCESAkerlof, G. A. (1970), “The Market for Lemons: Quality Uncertainty and the Market Mechanism,”
Quarterly Journal of Economics, Vol. 84, 488-500.
Adler, R. J., Feldman, R. E. and M. S. Taqqu (1998). A Practical Guide to Heavy Tails, Statistical Techniques and Applications. Birkhäuser, Boston-Basle-Berlin.
Allen, F. (1990), “The Market for Information and the Origins of Financial Intermediation,” Journal of Financial Intermediation, Vol. 1, 3-30.
Allen, F. and D. Gale (1995), “A Welfare Comparison of Intermediaries and Financial Markets in Germany and U.S.,” European Economic Review, Vol. 39, 179-209.
Altman, E. I. and A. Saunders (1998), “Credit Risk Measurement: Developments Over the Last 20 Years,”
Journal of Banking and Finance, Vol. 21, 1721-42.
Altrock, F. and S. Rieso (1999), “Why Asset Backed Securities ?” Die Betriebswirtschaft, Vol. 59, No. 2, 279-82.
Artzner P. and F. Delbaen (1994), “Default Risk Insurance and Incomplete Markets,” Working Paper, Institut de Recherche Mathématique Avancée Université Louis Pasteur et CNRS, et Laboratoire de Recherche en Gestion, Strasbourg.
Bank of England (1989), “Notice to Institutions Authorised Under the Banking Act 1987, Loan Transfers and Securitisation,” No. BSD/1989/0.
Barnhill, T. M. and W. F. Maxwell (2002), “Modelling Correlated Market and Credit Risk in Fixed Income Portfolios,” Journal of Banking and Finance, Vol. 26, 347-74.
Bär, H. P. (1998). Asset Securitisation - Die Verbriefung v