(IJSBAR)
ISSN 2307-4531
(Print & Online)
http://gssrr.org/index.php?journal=JournalOfBasicAndApplied
---
275
Nigerian Banks’ Specific Factors and Market Share Price
Nexus: A Cointegration Approach
Shamisudeen O. Badmus
a*,
Matthew A. Abata (PhD)
b, Yusuf A. Soyebo
caPhD Candidate, London Metropolitan University, 84 Moorgate, London, EC2M 6SQ, United Kingdom bAssociate Professor, Department of Accounting, Faculty of Management Sciences, Lagos State University, Ojo,
Lagos, Nigeria
cLecturer, Department of Banking and Finance, Faculty of Management Sciences, Lagos State University, Ojo,
Lagos, Nigeria a Email: olb0204@my.londonmet.ac.uk b Email: matthew.abata@lasu.edu.ng cEmail: yusuf.soyebo@lasu.edu.ng Abstract
In modern banking operations, reports on banks’ failure, classified loans and the size of assets, as well as erratic share-price movements, have stirred the interest of various stakeholders in Nigerian banking industry. This study investigates the long-run relationship between Nigerian banks’ specific factor and market share prices using the Pedroni cointegration approach – based on data from 11 out of 15 quoted banks between 2003 and 2015. The specified variables cointegrated for panel analysis and the observed long-run relationship were estimated using Dynamic Ordinary Least Square (DOLS). The result shows a negative relationship between return on assets and market price of shares. Thus, it is recommended that banks should initiate a bad debt reduction policy and diversify their loan portfolios to less risky sectors. Similarly, an optimum asset holding policy should be formulated by banks’ managers for easy classification of assets as either performing or relinquished ones. In addition, investors should diversify their investment holdings optimally across bank assets, non-bank assets, and government stocks.
Keywords: Banks;Non-Performing Loans; Market Price; Performance.
--- * Corresponding author.
276
1.IntroductionThe banking sector’s developmental role in the modern economy cannot be exaggerated, as it accelerates and facilitates economic growth attainment through purposeful financial intermediation activities. This essential function saddles bank managers with the enormous task of evaluating and financing the most viable business proposal/loan request based on their perception of a business prospect. This is in the face of information asymmetry which exposes the bank to adverse selection and moral hazards in the loan contract and creates Non-Performing Assets (NPA) and Non-Non-Performing Loans (NPL) on their balance sheet.
The NPA are assets in bank balance sheets which have ceased to generate regular income for the bank, while NPL is loans and advances whose interest and/or principal repayment have remained largely unpaid for a certain period [1]. NPL is an important parameter in bank financial performance analysis, as high NPL provision decreases liquidity, profitability and threatens bank asset quality and survival [2]. NPL is a measure of the possibility of credit defaults, which require provisions that reduce overall profitability and shareholder value [3]. Equally, a continuous increase in the size of the banking sector NPA can create financial and economic degradation – which affects the stock market and general investment climate due to the central roles of banks in the economy.
Similarly, stock market performance depends on various dynamics that are highly vulnerable to domestic economic and political conditions, as stock market activities strength stimuli real sectors activities such as consumption, investment and public confidence [4]. Thus, a high stock market index is an indicator of future prosperity and a good signal of increased bank loan supply, since it reflects economic conditions. Once an economy is growing, the output will increase, and firms will experience increased profitability, which makes their shares more attractive to the investing public due to higher potential returns. Conversely, the possibility of a recession will crash stock markets through a profit decline, lower dividends, and firm bankruptcy prospects. This will adversely affect investor time preference and perceptions through price movement, which affects volume and returns magnitude [5, 6].
Although the Nigerian stock market offers a wide range of opportunities to investors, they remain averse in terms of patronage due to high volatility and irregularity arising from limited information on quoted firms, capital controls, political changes, civil unrest, accounting controls, corruption, a weak regulatory framework, and poorly enforced contracts and investor rights [7]. While banks remain a key player in the stock market due to their relevance in fund mobilization, their NPL is used as an indicator for financial stability and serve as a guide on asset quality, credit risk and efficiency resources’ allocation to productive sectors.
Thus, the nexus between NPL and the macroeconomy can be explained based on loan portfolio quality (ratio of non-performing loans to total gross loans) influenced by systemic risks arising from exposures to macroeconomic risk factors across banks – as an increase in NPL reflects poor banking sector results which signal a danger for bank management and the regulator [8]. On the other hand, a decline in NPL signals sound and productive loan portfolio management in the financial system [9]. In line with these submissions, this study seeks to examine the long-run influence of the specific factors of some banks relative to their market price in
277
Nigeria.
The remaining sections comprise the literature review, research methods, results, conclusion and implications.
2.Literature Review
Most studies on banks specifics state that report earnings like Earning Per Share (EPS), Dividend Per Share (DPS), Return on Equity (ROE), and Book Value (BV) often influence firm’s market price [10, 11, 12, 13]. Similarly, other studies stated that macroeconomic factors such as interest rate and inflation rate affected market price [11]. Reference [14] showed the relevance of BV and EPS to the company stock value on the Indonesian Stock Exchange, while [15] revealed that accounting information like EPS and net asset value per share, explained a high portion of stock price movements in the Swedish stock market. [16] observed that book value of share and EPS had a statistically significant influence on the market price of the stock. Also, it was observed that BV and stock price movement are positively linked in various developed and developing countries, except in the Dhaka Stock Exchange where a negative relationship was observed due to irrational retail investor behaviour which caused the market crash in 2011.
Similarly, Reference [17] examined the influence of NPL on stock prices in Nepali commercial banks and observed that factors like NPL affected stock market prices between 2003 and 2010. [18] analysed the NPA level in public and private sector banks in India to estimate the trend in NPA. The result revealed that both internal and external factors influenced the size of bank NPA – which drained bank capital and weakened their financial strength. [6] examined the relationship between stock price and trading volume on the Bombay Stock Exchange (BSE) between 1996 and 2003 and observed that stock price is weakly exogenous in the high volatility regime, while volume is weakly exogenous in the low volatility regime.
Reference [16] studied the relationship between accounting numbers and market prices in the Pakistani-listed cement industry and observed a positive causal relationship between accounting numbers and market prices, while EPS had a statistically significant influence on market prices on the Pakistani stock market between 2005 and 2014.
Reference [19] studied Deposit Money Banks (DMB) credit administration and bad loans incidence in Nigeria and reported that credit risk is a major concern for banks and other financial institutions – due to its position as a critical risk factor in financial institutions. Reference [20] examined credit management and bad debt in Nigerian commercial banks and reported that credit risk led to financial loss due to default in borrower conformity with the terms of the loan agreements. Similarly, Reference [21] analysed the impact of non-performing loans on the financial performance of microfinance banks in Kenya and found a moderately strong and positive relationship between credit risk and the financial performance of MFB. This illustrates that when credit risk of borrowers rises, the financial performance of the MFB is likely to be negatively affected – meaning that the rise of credit risk causes increased default rates and hence increasing non-performing loans.
The level of NPA indicates the efficiency of banker’s credit risk management and allocation of resources. The measures incorporated to manage NPA can be classified as precautionary and curative measures. Precautionary
278
measures focus on strengthening the credit-risk management system and continuous risk-assessment systems of the bank. This will reduce the instances of fresh NPA which have been generated. The curative measures are reactionary and focused on recovering from NPA accounts. This includes measures initiated by RBI, such as setting up Asset Reconstruction Companies (ARC), Debt Recovery Tribunals (DRT), the Securitization Act, and Compromise Settlement Schemes [22].
The literature reviewed above suggests the distressing role of NPA in banking sector stability and growth. Even though many studies focused on explaining the trend in the movement of the NPA, the analytical parts mostly concentrated on ratio analysis, correlation, and regression, using a shorter study period.
3. Research Methodology
In this study, a cross-section of 11 Nigerian banks was selected between 2003 and 2015. The specific factors employed were: market price, return on asset, classified credit to total credit ratio, and classified assets to total assets ratio. Data on these variables were obtained from the financial reports and accounts of selected banks, while the baseline specification follows [23]. However, the dimension framework is calibrated and expressed as:
0 1 1 2 3 4
it it it it it
mps
=
a
+
l
mps
−+
l
roa
+
l
npatt
+
l
npltl
+
ε
(1)Where:
mps
it,mps
it−1,roa
it,npatt
it andnpltl
are levelled market price per share, first lagged market per share, return on asset, non-performing assets to total assets, and non-performing loans to total loans respectively, andε
it is described as a stochasticdisturbance term. If equation 1 is a pooled OLS regression equation,ε
it does not contain individual effects. This assumption barely holds in a panel setting, and thereforeε
it is a sum of two components: individual variance (u
i) and idiosyncratic term (v
it), which is defined as:it
u
iv
itε = +
;u
i:
GWN
(0, )
h
;v
it:
GWN
(0, )
h
(2) The expression in equation 2 is based on a random effects’ assumption, in which case both the individual effects and idiosyncratic term follow an unconditional Gaussian process. In equation 1, the left-hand variable is represented byy
itand all the right-hand variables byx
it' . We then have:' 0
it it i it
y
=
a
+
l
x
+ +
u
v
(3) Equation 3 is referred to as a One-Way Error Component Model and must be subjected to appropriate transformation before it can be estimated.A Lagrange-Multiplier (LM) test based on the residual method was introduced by [24]. The underlying assumption of this technique is that the variance of the random work is not different from zero. This implies that in each of the cross-sectional units, the time series is ergodic in the region of a non-stochastic drift. Hydri’s
279
parameterization can be replicated as:
'
it it it it
y
= Γ +
z
w
+
e
(4) Where:y
it is the investigated variable for a presence of a unit root, andz
it' is the non-stochastic drift,w
it is the random work, ande
it the stationary process.w
it can be expressed as:1
;
(0, )
it it it it
w
=
w
−+
ψ ψ
:
GWN
h
(5)Thus, equation 4 can be rewritten as:
'
1
t
it it j ij it
y
= Γ +
z
∑
=ψ
+
e
(6)The last two terms on the right-hand side of equation 6 can be represented by
η
it. That is:1 t
it j ij
e
itη
=
∑
=ψ
+
(7) Hence equation 6 can be restated as:'
it it it
y
= Γ +
z
η
(8) The autocorrelation characterized byη
it can be eliminated only if the long-run variance inherent inη
it can be wiped out. This can be expressed as:$
$
2$$
' 1 2 21
1
2
(
)
1
1
it T K T it t it J t j ith
BJK
T
T
η=
=η
+
= +η η
−−
∑
∑
−
∑
(9)Where:
BJK
is the Bartlett weight chosen to ensure thath
$
ηit is not negative always. BJK can be calculated as:1
1
j
BJK
k
= −
+
(10)Where: k is the bandwidth optimally chosen to ensure that the long-run variance is always positive.
The partial sum process (
psp
it) can be defined in terms of the residual in equation 8 as:$
1 t it j itpsp
=
∑
=η
(11)280
Therefore, the LM statistic can be expressed as:
$
2 2 1 11
1
i it t N T i tpsp
N
T
L
h
M
η = ==
∑
∑
(12) The null hypothesis of non-ergodicity is rejected, only when the calculated LM statistic is larger than the critical LM statistic. Rejection of the null assumption automatically suggests a level relationship among variables being investigated.Similarly, the study adopted the [25] cointegration test, which proposed seven residual-based cointegration tests with seven statistics which are classified as “within dimension” and “between dimension” panel tests. The former comprises panel-v, panel-ρ, semi-parametric panel-t and parametric panel-t, while the latter includes group-ρ, semi-parametric group-t, and parametric group-t statistics.
The long-run regression equation that is premised on the stationarity of a deviational term is not tractable using the OLS estimator. This is because the literature has revealed that the estimator of the OLS exhibits two types of biases: endogeneity and non-centrality, which are basically referred to as second-order bias. The endogeneity bias means that the I(1) regressor variables may become endogenous, while the non-centrality bias indicates that the error term may be strongly serially correlated. Therefore, to make this problem tractable, a parametric Dynamic Ordinary Least Squares (DOLS) model was simultaneously initiated by [26] and [27]. It was later popularized by [28] by introducing leads and lags of the first differenced I(1) included variables. Thus, the DOLS model can be expressed as:
' 1
'
1 it i it it it ity
= +
a
x b
+
w
≡
d v
+
w
(13) 2 it itx
w
∆ =
(14) Where:d
=
(
a b
i') ';
v
it=
(1 ) ';
x
it'w
it=
(
w w
1it' ) '
2it is based on the regularity condition given in [27], and1it
w
in panel data can be expressed as:'
1 2
j
it j ij it j it
w
=
∑
=∝=−∝g w
−+
e
(15)Inserting equation 15 into 13, we have:
2 1 ' j k ' it it i it j k j it j
y
= +
a
x b
+
∑
=−=g
∆
x
−+
e
r
(16) Where: it it ij' 2it j j ke
=
e
+
∑
>g w
−r
281
based on the OLS estimator of b in equation 16. According to [27], equation 16 is efficient, and hence it is free from second-order bias. Thus:
(
)
1(
$
)
1'
1 1 dol N T N T it it it it i t i i tb
v v
v y
− + = = = ==
∑ ∑
∑ ∑
$
(17)Where:
v
it=
2(
k
+
1) 1
X
vector of regressors, and it is obtained asx
it−
x
i,
∆
x
it k−,...,
∆
x
it k+Since the residual term
e
itr
in equation 16 is an orthogonal error, DOLS has been made asymptotically unbiased and an efficient estimator of a long-run regression equation. Therefore, it can be applied as the residual based cointegration to estimate the long-run parameter.
4. Results
Prior to the discussion of results, we examined the level data and first difference behaviour. Figures 1 and 2 (below) showed the peculiarities of these series, at these levels.
0 10 20 30 40 50 1 - 03 1 - 08 1 - 13 2 - 05 2 - 10 2 - 15 3 - 07 3 - 12 4 - 04 4 - 09 4 - 14 5 - 06 5 - 11 6 - 03 6 - 08 6 - 13 7 - 05 7 - 10 7 - 15 8 - 07 8 - 12 9 - 04 9 - 09 9 - 14 1 0 - 0 6 1 0 - 1 1 1 1 - 0 3 1 1 - 0 8 1 1 - 1 3 m ps 0 5 10 15 20 25 30 1 - 03 1 - 08 1 - 13 2 - 05 2 - 10 2 - 15 3 - 07 3 - 12 4 - 04 4 - 09 4 - 14 5 - 06 5 - 11 6 - 03 6 - 08 6 - 13 7 - 05 7 - 10 7 - 15 8 - 07 8 - 12 9 - 04 9 - 09 9 - 14 1 0 - 0 6 1 0 - 1 1 1 1 - 0 3 1 1 - 0 8 1 1 - 1 3 NPATTA 0 10 20 30 40 50 1 - 03 1 - 08 1 - 13 2 - 05 2 - 10 2 - 15 3 - 07 3 - 12 4 - 04 4 - 09 4 - 14 5 - 06 5 - 11 6 - 03 6 - 08 6 - 13 7 - 05 7 - 10 7 - 15 8 - 07 8 - 12 9 - 04 9 - 09 9 - 14 1 0 - 0 6 1 0 - 1 1 1 1 - 0 3 1 1 - 0 8 1 1 - 1 3 NPLTTL -30 -20 -10 0 10 20 1 - 03 1 - 08 1 - 13 2 - 05 2 - 10 2 - 15 3 - 07 3 - 12 4 - 04 4 - 09 4 - 14 5 - 06 5 - 11 6 - 03 6 - 08 6 - 13 7 - 05 7 - 10 7 - 15 8 - 07 8 - 12 9 - 04 9 - 09 9 - 14 1 0 - 0 6 1 0 - 1 1 1 1 - 0 3 1 1 - 0 8 1 1 - 1 3 ROA
Figure 1: Level data on Market Price per Share, Non-performing Asset to Total Asset, Non-performing Loan to Total Loan and Return on Asset
Figure 1 shows the level data trend in Market Price per Share, performing Asset to Total Asset, Non-performing Loan to Total Loan and Return on Asset, and are examined for 11 deposit money banks in Nigeria which are arranged in alphabetical order:
Access Bank Plc(1), Diamond Bank Plc(2), FCMB Nigerian Plc(3), Fidelity Bank Plc(4), First Bank Nigeria Plc(5), IBTC Bank Plc(6), Skye Bank Plc(7), Sterling Bank Plc(8), UBA Plc(9), Union Bank Plc(10) and Wema
282
Bank Plc(11). UBA has the highest market price per share, followed by Union Bank – while Fidelity Bank has the lowest market price per share. Almost all the banks have exhibited an occasional negative return on assets, except for Access Bank, Fidelity Bank, First Bank and IBTC Bank – where the return on assets is positive but dwindles over time. Union Bank and Wema Bank have the highest and lowest return on assets respectively.
The ratio of classified credit to total credit is higher in Union Bank than other banks, but lower in Wema Bank where it approaches zero; IBTC has the highest classified asset to total asset ratio. In sum, the movements of all these variables are random and not mean reversible. Therefore, there is a need to differentiate these data to a first-order derivative, as shown in figure 2 (below).
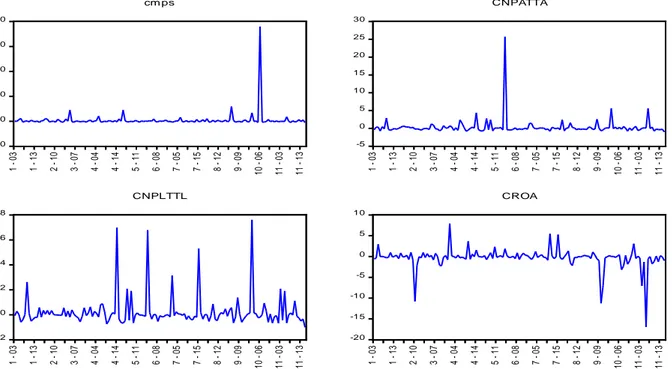
-20 0 20 40 60 80 1 - 03 1 - 13 2 - 10 3 - 07 4 - 04 4 - 14 5 - 11 6 - 08 7 - 05 7 - 15 8 - 12 9 - 09 1 0 - 0 6 1 1 - 0 3 1 1 - 1 3 cm ps -5 0 5 10 15 20 25 30 1 - 03 1 - 13 2 - 10 3 - 07 4 - 04 4 - 14 5 - 11 6 - 08 7 - 05 7 - 15 8 - 12 9 - 09 1 0 - 0 6 1 1 - 0 3 1 1 - 1 3 CNPATTA -2 0 2 4 6 8 1 - 03 1 - 13 2 - 10 3 - 07 4 - 04 4 - 14 5 - 11 6 - 08 7 - 05 7 - 15 8 - 12 9 - 09 1 0 - 0 6 1 1 - 0 3 1 1 - 1 3 CNPLTTL -20 -15 -10 -5 0 5 10 1 - 03 1 - 13 2 - 10 3 - 07 4 - 04 4 - 14 5 - 11 6 - 08 7 - 05 7 - 15 8 - 12 9 - 09 1 0 - 0 6 1 1 - 0 3 1 1 - 1 3 CROA
Figure 2: First Differenced Data on Market Price per Share, performing Asset to Total Asset, Non-performing Loan to Total Loan and Return on Asset
As shown in figure 2, all the variable series have become mean reversible after the first-differenced transformation – meaning that the data series have been punched from the unit root. This is further justified by the [24] test for stationarity, under the assumption of no unit root in the panel.
4.1 Panel Unit Root Test
We conducted the Hydri test on the panel unit root using the first differenced series of the market price per share, a classified asset to total assets, classified credit to total credit, and return on asset. The results of the test are summarized in Table 1 (below).
283
Table 1: Unit Root Test Results on the Series of MPS, NPATTA, NPLTTL and ROA
All the data series are tested at the 5% level of significance and they are the corresponding p values displayed above
The hydri LM statistics, as shown in Table 1, are very insignificant, with associated asymptotical large p values. All the p values are respectively larger than the alpha value at 5%. This suggests that the null hypothesis that all the panels are stationary, cannot be rejected. In this regard, there is evidence that market price per share, a non-performing asset to total assets, non-non-performing loan to total loans and return on the asset are I(1) variables. Therefore, there is a need to answer the question of whether the linear combination of these variables or the deviation is stationary at all level? To address this question, we conducted Pedroni’s cointegration test.
4.2 Pedroni’s Cointegration Test
The focus of the study is to employ [25] panel cointegration test for investigating the long-run link between market value and some bank-specific factors. Table 2 provides a summary of the test results. In the first column of the table is the within-dimension with four statistics and between dimension statistics with three statistics, and in the second and third columns are the calculated statistics and p values respectively.
Table 2: Test of Long-Run Relationship of MPS, NPATTA, NPLTTL and ROA
Note: The results shown in the table is with constant but no deterministic trend; * denotes the rejection of the null hypothesis of no cointegration at the 1% significant level which corresponds to a p-value of 0.00
In line with the objective of this study, the Pedroni’s cointegration test results on the long-run relationship between market value, return on asset, classified asset to total asset, and classified credit to total credit, are
284
reported in Table 2 above.
Two out of the four statistics under within-dimension reject the null hypothesis of no cointegration, while two out of the three statistics under between-dimensions reject the hypothesis of no cointegration. It simply means that most of the within and between dimensions’ test statistics reject the assumption of no level relationship. Therefore, this implies that market value, return on asset, classified asset to total asset, and classified credit to total credit are cointegrated for the panel of all banks and for the panels of bank groups. By implication, it means that in the Nigerian banking sector the four variables move together in the long run. Since we have established the presence of long relationship, it is convenient to estimate the long-run coefficients using DOLS which we had earlier discussed in this paper.
4.3 Long Run Coefficient Estimation-based DOLS Technique
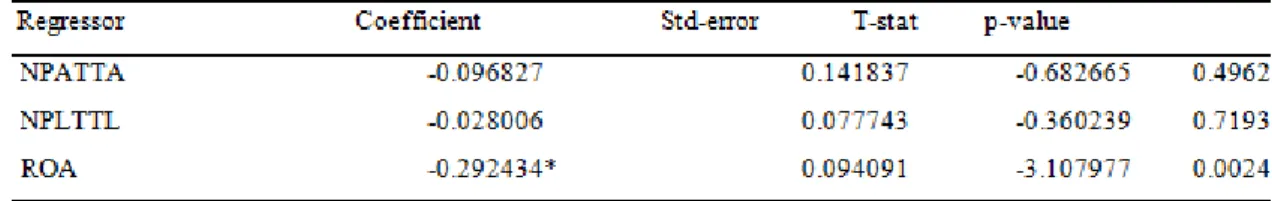
The cointegrating vectors in the long-run regression equation developed in this study are estimated using the DOLS estimator. Thus, Table 3 shows the coefficients and the associate t statistics of the long-run equation.
Table 3: Panel Cointegrating Estimation based on DOLS
Note that * indicates significant at 1% given the p-value 0.002
The long-run coefficients in Table 3 are -0.096827, -0.028006 and -0.292434 respectively – for NPATTA, NPLTTL and ROA. It is somewhat surprising that all the coefficients are negative; in view of this, we establish that in the long run there is a negative relationship between these variables and market value. This implies that a 1% increase in the ratio of a non-performing asset to total asset, the ratio of non-performing loan to total loan and return on asset, leads to about a 109%, 3% and 29% respectively fall in the market price of shares in the banking industry. Return on asset is supposed to be positively related to value, but we found that it does exhibit a negative relationship in the context of Nigerian banks. This is a puzzle which demands further investigation. However, it is only the return on an asset that maintains a significant relationship among the three variables.
5. Conclusion and Implications
This study estimated a long-run relationship among return on asset, classified credit to total credit, classified asset to total asset and market price per share in Nigerian banking sector, using Pedroni’s approach to cointegration. The result indicates a long-run influence running from return on asset, the ratio of a classified asset to total asset, the ratio of classified credit to total credit to market value. This implies that banks’ market value can be predicted in the long-run situation, based on the level of asset return, the ratio of toxic loan to total loan, and a bad asset to total asset. However, the study was not without constraints, thereby limits the effects of
285
Nigerian banks specific factors on banks’ performance. First is the general limitation which cuts across the Nigerian economy, these include among others, a weak regulatory framework; corruption; civil unrest; and political changes. Second, a specific limitation that affects individual bank differently. These are limited information about quoted firms; capital control and its different risk exposures across banks; specific firms policies and accounting controls affecting contract enforcements, investors’ rights, and how the likes of NPL and NPA are defined. These limitations have adverse effects on stock market patronage despite its wide range of opportunities to the investors. Long-run effect of specific factors among Nigerian banks is evaluated here relative to the market price which is opined to be influenced by policies and accounting controls on EPS, DPS, ROE, and BV as well as interest and inflationary rates. Therefore, banks’ policy-makers should initiate a bad debt reduction policy by diversifying their loan portfolios to less risky sectors such as manufacturing and education. Furthermore, banks should formulate an optimum asset holding policy, in which classified assets can either be transmuted to readily performing ones or relinquished.
The presence of an indirect relationship between market value and return on asset implies that an increase in the market price of the stock does not translate to a rise in return on investment. Hence, investors should diversify their investments optimally across bank assets, non-bank assets, and government stocks. Similarly, an inverse relationship between market value and the ratio of toxic credit to total credit implies that an increase in the size of the toxic loan to total loan leads to a decline in market value. Thus, the Central Bank of Nigeria (CBN) should monitor monetary policy and make it effective through the appropriate imposition of sanctions on infringing banks.
References
[1]. D. D. Dubey & P. Kumari. Impact of non-performing assets on stock market performance of listed bank stocks in India: An empirical assessment of how the two stocks - NPA and Share are related. IOSR Journal of Economics and Finance, pp. 16-22, (2016).
[2]. D. Sahoo & P. Mishra. Structure, conduct and performance of Indian banking sector. Review of Economic Perspectives, vol. 12(4), pp. 235-264, (2012).
[3]. R. S. Pradhan & A. Pandey. Bank specific and macroeconomic variables affecting non-performing loans of Nepalese commercial banks. Retrieved from http://ssrn.com/abstract= 2793495, (2016).
[4]. S. Almutair. Dynamics of the relationship between bank loans and stock prices in Saudi Arabia. International Business & Economics Research Journal, vol. 14(3), pp. 439-452, (2015).
[5]. B. Lee & O. M. Rui. The dynamic relationship between stock returns and trading volume: Domestic and cross-country evidence. Journal of Banking and Finance, vol. 26, pp. 51-78, (2000).
[6]. K. Chaudhuri & A. Kumar. A Markov-switching model for Indian stock price and volume. Journal of Emerging Market Finance, vol. 14(3), pp. 239-257, (2015).
286
[7]. M. H. Ibrahim. Stock prices and bank loan dynamics in a developing country: The case of Malaysia. Journal of Applied Economics, vol. 9(1), pp. 71-89, (2006).
[8]. J. P. S. Sheefeni. The impact of macroeconomic determinants on non-performing loans in Namibia. International Review of Research in Emerging Markets and the Global Economy (IRREM), vol. 4(1), pp. 612-632, (2015).
[9]. M. Badar & A. Y. Javid. Impact of macroeconomic forces on nonperforming loans: An empirical study of commercial banks in Pakistan. wseas Transactions on Business and Economics, vol. 10(1), pp. 40-48, (2013).
[10].E. Svensson & A. Larsson. Value Relevance of Accounting Information- A Swedish Perspective. Gothenburg: School of Economics and Commercial Law at Gothenburg University, (2009).
[11].F. N. Al-Shubiri. Analysis the determinants of market stock price movements: An empirical study of Jordanian commercial banks. International Journal of Business and Management, vol. 5(10), pp. 137-146, (2010).
[12].S. Sharma. Determinants of Equity Share Prices in India. Journal of Arts Science and Commerce, vol. 2(4), pp. 51-60, (2011).
[13].P. Bhatt & J. K. Sumangula. Impact of Earning Per Share on Market Value of An Equity Share: An Emprical Study on Indian Capital Market. Journal of Finance, Accounting and Management, vol. 3(2), pp. 1-14, (2012).
[14].Andriantomo & F. Yudianti. The Value Relevance of Accounting Information at Indonesia Stock Exchange. In International Conference on Business, Economics, and Accounting, (2013).
[15].E. Halonen, P. Pavlovic & R. Persson. Value relevance of accounting information and its impact on stock prices: Evidence from Sweden. Journal of Contemporary Accounting & Economics, vol. 9(1), pp. 47-59, (2013).
[16].S. Riaz, Y. Liu & H. Khan. Exploring the relationship between market value and accounting numbers of firms in Pakistan. Asian Journal of Finance and Accounting, vol. 7(1), pp. 230-238, (2015).
[17].N. R. Shrestha. Non-performing loans and stock prices: A case of Nepali commercial banks. Nepal Journal of Management, vol. 4(1), pp. 92-101, (2011).
[18].A. L. Joseph & M. Prakash. A study on analyzing the trend of NPA level in private sector banks and public-sector banks. International Journal of Scientific and Research Publications, vol. 4(7), pp. 1-9, (2014).
287
bad loans: An empirical investigation. Afe Babalola University, (2010).
[20].O. C. Agu & B. S. Okoli. Credit management and bad debt in Nigeria commercial banks – Implication for development. IOSR Journal of Humanities and Social Sciences, vol. 12(3), pp. 47-56, (2013).
[21].D. K. Wangai, N. Bosire & G. Gatogo. Impact of non-performing loans on financial performance of microfinance banks in Kenya: A survey of microfinance banks in Nakuru town. International Journal of Science and Research, vol. 3(10), pp. 2073-2078, (2014).
[22].A. K. Srivastava & A. Srivastava. Non-performing assets and its role in India perspective (A study of public, private and foreign sector banks). Retrieved from
http://www.indianmba.com/Faculty_Column/FC1576/fc1576.html, (2014).
[23].A. W. Babayemi, B. K. Asare, G. L. Onwuka, R. V. Singh & T. O. James. Empirical relationship between the stock markets and macroeconomic variables: Panel cointegration evidence from African stock markets. International Journal of Engineering Science and Innovative Technology, vol. 2(4), pp. 394-410, (2013).
[24].K. Hydri. Testing for stationarity in heterogeneous panel data. Econometric Journal, vol. 3, pp. 148-161, (2000).
[25].P. Pedroni. Critical values for cointegration tests in heterogeneous panels with multiple regressors. Oxford Bulletin of Economics and Statistics, vol. 61, pp. 653-678, (1999).
[26].P. C. B. Phillips & M. Loretan. Estimating long-run economic equilibria. Review of Economic Studies, vol. 58, pp. 407-436, (1991).
[27].P. Saikkonen. Asymptotically efficient estimation of cointegration regressions. Econometric Theory, vol. 7, pp. 1-21, (1991).
[28]. J. H. Stock & M. W. Watson. A simple estimator of cointegrating vectors in higher order integrated systems. Econometrica, vol. 61, pp. 783-820, (1993).