National Environmental Research Institute
Ministry of the Environment . Denmark
Projection Models 2010
Danish emissions of SO
2, NO
x, NMVOC and NH
3National Environmental Research Institute Ministry of the Environment.Denmark
Projection Models 2010
Danish emissions of SO
2, NO
x, NMVOC and NH
3NERI Technical Report No. 414
2002
Jytte Boll Illerup
Katja Birr-Pedersen
Mette Hjorth Mikkelsen
Morten Winther
Steen Gyldenkærne
Henrik Gundorph Bruun
National Environmental Research Institute
Jørgen Fenhann
Data sheet
Title: Projection Models 2010
Subtitle: Danish emissions of SO2, NOx, NMVOC and NH3
Authors: Jytte Boll Illerup1, Katja Birr-Pedersen1, Mette Hjorth Mikkelsen1, Morten Winther1, Steen
Gyldenkærne1
, Henrik Gundorph Bruun1
, Jørgen Fenhann2
Departments: 1)Department of Policy Analysis, National Environmental Research Institute
2)
Department of System Analysis, Risø National Laboratory
Serial title and no.: NERI Technical Report No. 414
Publisher: National Environmental Research Institute
Ministry of the Environment
URL: http://www.dmu.dk
Date of publication: December 2002
Editing complete: October 2002
Referees: Hanne Bach, Karin Jønch-Clausen
Financial support: The Danish Environmental Protection Agency
Please cite as: Illerup, J.B., Birr-Pedersen, K., Mikkelsen, M.H., Winther, M., Gyldenkærne, S., Bruun, H.G. & Fenhann, J. 2002: Projection Models 2010. Danish emissions of SO2, NOx, NMVOC and NH3.
National Environmental Research Institute, Denmark. 192 pg - NERI Technical Report No. 414. Reproduction is permitted, provided the source is explicitly acknowledged.
Abstract: Models for projection of SO2-, NOx-, NMVOC- and NH3-emissions to the atmosphere have been
developed and the Danish emissions have been projected until 2010 from a basis scenario in-cluding all implemented and planned measures. The projections of the four pollutants indicate that it may be difficult to achieve the emission ceilings given in the Gothenburg Protocol and the EU directive on national emission ceilings in 2010. In addition to the basis scenario, 8 sion reduction scenarios for different sectors have been analysed in order to estimate the emis-sion saving potential and financial and welfare-economic consequences of each scenario.
Keywords: Projection, emission(s), SO2, NOx, NMVOC, NH3, reduction scenarios, welfare-economics
Layout and drawings: Ann-Katrine Holme Christoffersen and Graphical Group, DMU
ISBN: 87-7772-695-2
ISSN (print): 0905-815X
ISSN (electronic): 1600-0048
Paper quality: Cyclus Office
Printed by: Schultz Grafisk
Environmentally certified (ISO 14001) and Quality certified (ISO 9002)
Number of pages: 192
Circulation: 200
Price: DKK 100,- (incl. 25% VAT, excl. freight)
Internet-version: The report is also available as a PDF-file from NERI’s homepage
http://www.dmu.dk/1_viden/2_Publikationer/3_fagrapporter/rapporter/FR414.pdf
For sale at: Miljøbutikken or at: Miljøbutikken
Læderstræde 1-3 On-line bookstore:
1201 København K www.mim.dk/butik
Tlf. 33 95 40 00 [email protected]
Contents
Preface 7
Summary 8
Introduction 8
The projection models 9 Energy 9
Industry 10 Transport 11 Agriculture 13 Pollutants summary 14
Emission reduction scenarios 15
Financial and welfare-economic analysis 17 Financial analysis 18 Welfare-economic analysis 18
Sammenfatning 22
Introduktion 22 Fremskrivningsmodeller 23 Energi 23 Industri 24 Transport 25 Landbrug 26 Emissionsfremskrivninger 28 Emissionsreduktionsscenarier 29Budget- og velfærdsøkonomisk analyse 31 Budgetøkonomiske analyse 32 Velfærdsøkonomisk analyse 32
1
Introduction 37
1.1 Obligations 37
1.2 Environmental problems 38 1.3 Historical emission data 39
2
Projection of emissions 43
2.1 Combustion in stationary plants 44 2.1.1 Sources 44 2.1.2 Activity data 44 2.1.3 Emission factors 46 2.1.4 Emissions 48 2.1.5 Projections 48 2.1.6 Model description 51 2.2 Industry 53
2.2.1 Oil and gas extraction 53 2.2.2 Use of solvents 59 2.2.3 Other Industries 63 2.3 Transport 64
2.3.1 Road Transport 64 2.3.2 Other mobile sources 71
2.3.3 NMVOC emissions from gasoline distribution 72 2.3.4 Emission results 73
2.3.5 Model structure for road traffic 78 2.4 Agriculture 83
2.4.1 Assumptions 84 2.4.2 Husbandry manure 85 2.4.3 Crops 93
2.4.4 Artificial fertilisers 95 2.4.5 Ammonia treated Straw 97 2.4.6 Sewage sludge 97 2.4.7 Projections 98 2.5 Pollutants summary 103 2.5.1 SO2 103 2.5.2 NOx 104 2.5.3 NMVOC 105 2.5.4 NH3 105
3
Financial and welfare economic analysis of emission reduction
measures 109
3.1 Introduction 109
3.2 The accounting-price method 110
3.3 Emission reduction measures in the industrial sector 114
3.3.1 Reduction of NMVOCs from car painting workshops 114 3.4 Emission reduction measures in the energy sector 118
3.4.1 Large offshore wind turbine farms 118
3.4.2 Reduction of NOx emissions from large power plants (>25MW) 125
3.4.3 Reduction of SO2 emissions from large power plants (>25MW) 127
3.5 Emission reduction measures in the transport sector 130
3.5.1 Emission reductions from the introduction of electrical vehicles 130 3.5.2 Exhaust Gas Recirculation (EGR) for heavy duty vehicles 136 3.6 Emission reduction measures in the agricultural sector 148
3.6.1 Increased grazing of dairy cows during the summer months 148 3.6.2 Application of slurry and manure within one hour after spreading
on the field 156
3.7 Comparison of results across sectors 162 3.7.1 Cost conclusions (financial analysis) 162 3.7.2 Results of welfare economic calculations 162
3.8 Monetary valuation of environmental benefits from emission reduction initiatives 167 3.8.1 Introduction 167
3.8.2 Including monetary values in the welfare economic analyses 171 3.8.3 Summary of results 181
4
Conclusions 184
4.1 Emissions 184
4.2 Financial and welfare economic analysis 185
References 187
National Environmental Research Institute NERI Technical Reports
Appendixes -
only available in electronic format from NERI’s homepage: http://www.dmu.dk/1_viden/2_Publikationer/3_fagrapporter/rapporter/FR414 EnergyAppendix 2.1.1 The Energy Model
Industry
Appendix 2.2.1 The Offshore Model Appendix 2.2.2 Use of Solvent
Transport
Appendix 2.3.1 Vehicle layers
Appendix 2.3.2 Vehicle numbers per layer Appendix 2.3.3 Vehicle age distributions Appendix 2.3.4 Hot emission factors
Appendix 2.3.5 Reduction factors for future vehicle types
Appendix 2.3.6 Deterioration factors per layer for catalyst vehicles
Appendix 2.3.7 Cold:Hot ratios per layer for passenger cars and light duty vehicles Appendix 2.3.8 β-factor reductions per layer for catalyst vehicles
Appendix 2.3.9 Evaporation emission factors for gasoline vehicles Appendix 2.3.10 Fuel use and emissions for road traffic 1985-2010
Appendix 2.3.11 Fuel use and emissions for other mobile sources 1985-2010
Agriculture
Appendix 2.4.1 Revising of ammonia emission from the agricultural sector 1985-1999 Appendix 2.4.2 Livestock Production
Appendix 2.4.3 Stable types
Appendix 2.4.4 Emission coefficients for husbandry manure Appendix 2.4.5 Application time and methods
Appendix 2.4.6 Emission from the agricultural sector 2000-2010
Financial and welfare economic analysis
Appendix 3.1 Annual mileage in km per vehicle driven
Appendix 3.2 Fleet development of heavy duty vehicle equipped with EGR
7
Preface
This report contains a description of models for projection of SO2,
NOx, NMVOC and NH3 for Denmark. The emissions are projected
from a basis scenario until 2010 and a number of measures are ana-lysed in order to estimate the potential emissions reductions and the financial and welfare-economic consequences of the different meas-ures.
The Department of Policy Analysis of the National Environmental Research Institute (NERI) and the Department of System Analysis of Risø National Laboratory have carried out the work. The project has been financed partly by the Danish Environment Protection Agency (EPA) and NERI.
The steering committee of the project consisted of the following members:
Ulrik Torp (chairman, EPA), Per B. Suhr (EPA), Lisbeth Strandmark (EPA), Jytte Boll Illerup, (NERI), Morten Winther (NERI), Jørgen Fen-hann (RISØ), Jesper Schou, (NERI), and Thomas C. Jensen, (The En-ergy Agency).
The authors would like to thank:
• The Energy Agency for providing the energy consumption fore-cast.
• Bo Ekman, the Danish Road Directorate, for providing the fleet and mileage data used in the road traffic part.
• Freddy Jensen, E N Danmark, and Flemming Bak, the Danish
Technological Institute, for many fruitful discussions regarding the construction of the EGR scenario.
• Flemming Møller, NERI, for providing comments and assistance to the chapter on financial and welfare-economic analysis of emis-sion reduction measures.
• The Danish Agricultural Advisory Centre for providing data.
• Johnny M. Andersen, The Danish Farmer’s Union for providing
Summary
Introduction
The objective of the present project has been to develop Danish models for projection of SO2-, NOx-, NMVOC- and NH3-emission to
the atmosphere until 2010 and to make an estimate of the emissions in 2010 of the four pollutants. The emission projection models for these four pollutants cover the following economic sectors: Energy, industry, transport and agriculture.
In Europe the regional air pollution is regulated by a number of pro-tocols under the UNECE Convention on Long-Range Transboundary Air Pollution (CLRTAP). The objectives of the new protocol – the Gothenburg Protocol – are to control and reduce the emissions of SO2,
NOx, NMVOC and NH3. Contrary to the former protocols the parties
to the convention are not obliged to comply with certain reduction ratios compared with a baseline year. Instead emission ceilings have been based on knowledge of critical loads and environmental impact on ecosystems within the geographical area of Europe. Table 1 shows the emission ceilings for Denmark in 2010. The same emission ceil-ings are given in the EU directive: Directive 2001/81/EC of the European Parliament and of the Council of 23 October 2001 on na-tional emission ceilings for certain atmospheric pollutants.
Table 1. Emission ceilings for Denmark in 2010 (tonnes).
Pollutants SO2 NOx NMVOC NH3*
Emission ceilings 55000 127000 85000 69000
* The NH3 emission ceiling excludes emission from straw treatment and crops.
The developed projection models can be used to calculate the ex-pected emissions of the four pollutants in 2010 given an estimate of the development in each of the four sectors. The models can further-more be used to calculate the effects of various emission reduction measures. By investigating a suitable range of emission reduction measures and the associated financial and welfare-economic costs, the models can be used as a guidance to find the most cost-effective strategy meeting the emission ceilings.
The Danish emissions have been projected from a basis scenario in-cluding all implemented and planned measures. In addition to the basis scenario, 8 emission reduction scenarios for different sectors have been analysed in order to estimate the emission saving poten-tials and financial and welfare-economic consequences of each sce-nario. The 8 emission reduction scenarios were chosen as likely examples of measures covering all four economic sectors and are used to demonstrate the capabilities of the developed models. The results are summarised in Table 2. The chosen reduction scenarios do not fully account for the projected deficit based on the assumptions
9 is not possible to choose only the cheapest measure as every measure has a maximum emission reduction capacity associated with the ac-tual activity (e.g. the number of large power plants where a SCR unit can be installed). The results shown in Table 2 illustrate how the models can be used to find an emission reduction strategy that is technically feasible on the one hand and cost-effective on the other. Table 2. Projected emissions in 2010 according to the basis scenario compared with the emission ceilings and the effects of the investigated reduction scenarios. The costs are calculated as welfare-economic costs.
SO2 NOx NMVOC NH3 Costs pr. tonne
1000 tonnes 106 DKK per tonne Projected emission 2010 56.05 146.37 83.01 82.78 -Emission ceiling 2010 55.00 127.00 85.00 69.00 -Deficit 1.05 19.37 - 13.77
-The emission reduction scenarios 1. Car painting work shops: water-based paint
0.00 0.00 0.75 0.00 NMVOC: 0.126 2. Offshore wind turbine farm (replaces
coal-fired power plant)
0.51 0.23 0.01 0.00 SO2: 0.264
NOx: 0.586
NMVOC: 19.157 3. SCR (de-NOx) unit installation at large
power plant
0.00 6.46 0.00 0.00 NOx: 0.013
4. Desulphurisation unit at large power plant 2.29 0.00 0.00 0.00 SO2: 0.005
5. Electrical vehicles (70,000 in 2010) 0.02 0.05 0.20 0.00 SO2: 34.428 NOx: 13.501
NMVOC: 3.460 6. EGR-filter installation (heavy duty
vehi-cles<10 yr.)
0.00 2.84 0.61 0.00 NOx: 0.766
NMVOC: 3.456 7. Increased grazing of dairy cows 0.00 0.00 0.00 3.30 NH3: 0.026
8. Manure application within one hour after spreading
0.00 0.00 0.00 1.31 NH3: 0.029
Reduction total 2.82 9.58 1.57 4.61
-Emission including reductions 53.23 136.79 81.44 78.17
The projection models
EnergyThe projection of the emissions from combustion in stationary plants is estimated in a new model developed in this project. The energy consumption data in the model is based on the energy forecast car-ried out by the Danish Energy Agency (DEA) according to the follow up on the Danish energy plan ‘Energy 21’. The energy consumption is calculated based on the fuel expected to be combusted in Danish plants and the emissions are therefore not corrected for international electricity trade. From 2004 the Danish export of electricity is as-sumed to increase with about 90 PJ compared with a national con-sumption of fuel of 410 PJ in stationary combustion plants.
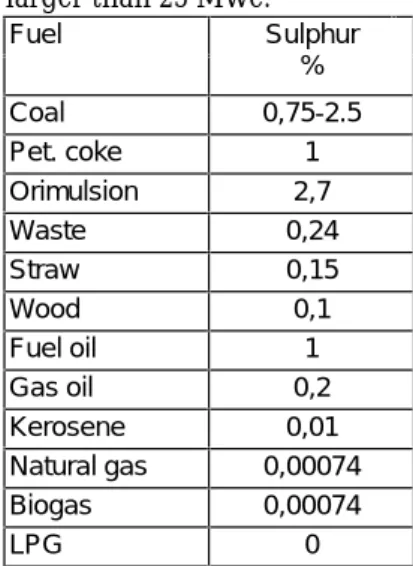
The fuel consumption from plants larger than 25 MWe is specified for each plant together with information on abatement technology, sul-phur content in the fuel, degree of desulsul-phurisation and emission factors. The emission factors for large combustion plants are based on the assumptions made by the Danish power stations concerning
sul-phur content in the fuel, sulsul-phur retention in the ash and degree of desulphurisation. For plants smaller than 25 MWe the emission fac-tors are estimated from permit limit values for sulphur content in fuels given in the Danish legislation and from information given by the Danish power stations and other Danish companies. Measure-ments have shown that NOx emission factors for gas turbines and
stationary gas engines are significantly higher than for boilers. The structure of the emission model makes it possible to change the pa-rameters for both large and small combustion plants.
The most important SO2 emission source is power- and district
heat-ing plants followed by industrial combustion plants and non-industrial combustion plants. The SO2 emissions from the two latter
sources are almost constant throughout the period from 2001 to 2010 while the emissions from the power and heat production reflect the variation in the fuel consumption. For NOx as for SO2 the most
im-portant emission sources are power- and district heating plants. In the years until 2006 the NOx emissions and the fuel consumption will
develop correspondingly. From 2007 Selective Catalytic Reactors (SCR) are expected to be installed on some of the large combustion units and this will cause a significant decrease in the emissions. Con-trary to the SO2 and NOx emissions the largest NMVOC emission
source is non-industrial combustion plants. Especially combustion of wood in the residential sector contributes to the NMVOC emission. The emissions from the large combustion plants contribute with about 80% and 60% for SO2 and NOx respectively of the projected
total emissions from power- and district heating plants.
Industry
The projected emissions from the industrial sector mainly include oil and gas extraction and use of solvents. The most important pollutant from the industrial sector is NMVOC and the largest emission sources are use of solvents, extraction of oil and gas and processes in the petroleum industry.
0 10000 20000 30000 40000 50000 60000 70000 0 10000 20000 30000 40000 50000 60000 70000 80000 SO 2 emissions (tonnes) NO x emissions (tonnes) 2001 2002 2003 2004 2005 2006 2007 2008 2009 2010 2001 2001 2003 2004 2005 2006 2007 2008 2009 2010
Power- and district heating plants Non-industrial combustion plants
Industrial combustion plants Total
Figure 1. Projected SO2 emissions from the energy
sector.
Figure 2. Projected NOx emissions from the energy
11 from the Joint EMEP/EEA Atmospheric Emission Guidebook. Espe-cially fugitive emissions, emissions from loading of oil into ships and emissions from the natural gas network contribute to the NMVOC emissions.
The most important sectors for industrial use of solvents are: Car re-pairing and treatment, the chemical industry, paint application in the iron and steel industry, paint manufacturing, the plastic industry, the food industry, preservation of wood and the printing industry. For these sectors the Government and the industries agreed to reduce the emissions of NMVOC by 40 % from 1988 to 2000. As a part of the agreement the industry has collected activity and emission data for the relevant sectors. The model for calculating industrial emissions of NMVOC is based on these data. At present no projection of Danish activity and emission data for industrial use of solvent is available from 2001 to 2010. Instead it is assumed that the emissions will de-crease by 57% from 1990 to 2010, the same reduction as assumed in a European project.
No detailed Danish inventory exists for domestic use of solvents. The recommended emission factor in the Joint EMEP/EEA Atmospheric Emission Guidebook is therefore used in the projections. The emis-sion is estimated by multiplication of the emisemis-sion factor and the projected population number.
Transport
For road traffic a detailed model has been developed in this project to simulate the emissions from operationally hot engines, during cold start and fuel evaporation. The emission effect of catalyst wear is also included in the model. Input data for vehicle stock and mileage is obtained from the Danish Road Directorate, and is grouped accord-ing to average fuel consumption and emission behaviour. For each group the emissions are estimated by combining vehicle and annual mileage numbers with hot emission factors, cold:hot ratios and
NMVOC emissions (tonnes) Production of gas and oil
Petroleum refining plants
Extraction and distribution of fossil fuels
Production of oil (mio m3)
Production of natural gas (mia Nm3) Industrial use of solvent
Domestic use of solvent
2001 2002 2003 2004 2005 2006 2007 2008 2009 2010 2001 2001 2003 2004 2005 2006 2007 2008 2009 2010 0 2000 4000 6000 8000 10000 12000 14000 16000 0 5 10 15 20 25
Figure 3. Projected NMVOC emissions from the main industrial sources.
evaporation factors. Consistency with historical emission figures is ensured by using background data from the European COPERT III model currently used to produce the annual Danish road traffic in-ventories. In this way COPERT III supplies the forecast model with e.g. hot baseline emission factors, reduction factors for future vehicle groups, catalyst deterioration factors and cold:hot ratios.
A new model has also been developed for off road working machines and equipment in the following sectors: Inland waterways, agricul-ture, forestry, industry and household and gardening. In general the emissions are calculated by combining information on the number of different machine types and their respective load factors, engine sizes, annual working hours and emission factors. Future emission reductions for diesel machinery are taken into account by simulating the implementation of a two-stage EU emission legislation directive. For the remaining types of machinery no real emission improvements are expected. Emission projections are made by using the latest his-torical fuel related emission factors in combination with the DEA en-ergy use forecast.
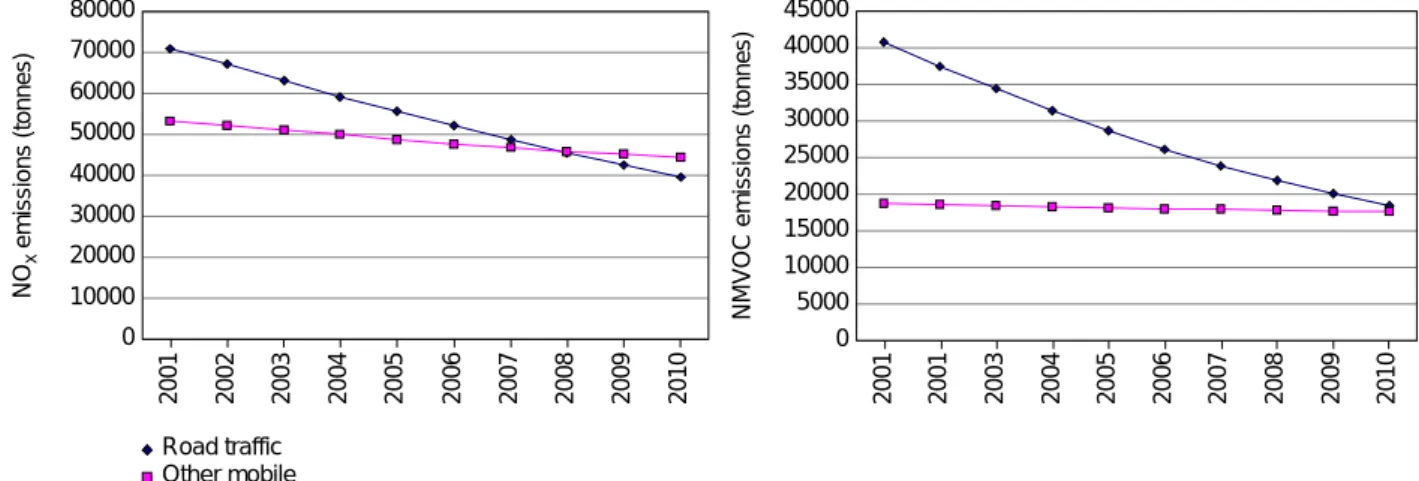
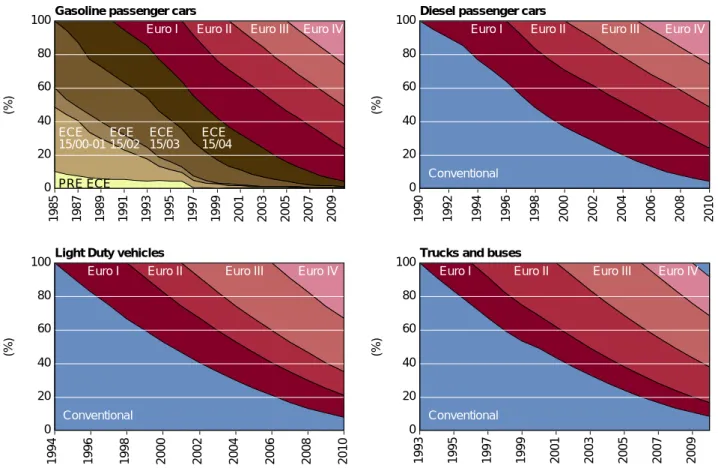
The emission of NOx and especially NMVOC from private cars has
shown a constant lowering trend since the introduction of catalyst pri-vate cars in 1990. The total emission reductions are fortified by the in-troduction of new gradually stricter EURO emission standards for all other vehicle classes. This development is expected to continue in the future. The NOx and NMVOC emission reduction pace for road traffic
is expected to be higher from 2001 to 2010 compared with the other mobile sources. From 2001 to 2010 the projected NOx and NMVOC
shares for road traffic go from 57 and 68% respectively, to 47 and 51%. A side effect of the introduction of catalytic converters is a dramatic increase in the emissions of NH3. However the emissions are still small
compared with the agricultural NH3 emission totals. The pace in which
the NH3 emissions increase slows down at the end of the forecast
pe-riod together with the catalyst vehicle penetration rate. The already low sulphur content of around 50 ppm in gasoline and diesel fuels is
NO
x
emissions (tonnes)
NMVOC emissions (tonnes)
Road traffic Other mobile 2001 2002 2003 2004 2005 2006 2007 2008 2009 2010 2001 2001 2003 2004 2005 2006 2007 2008 2009 2010 0 10000 20000 30000 40000 50000 60000 70000 80000 0 5000 10000 15000 20000 25000 30000 35000 40000 45000
Figure 5. Projected NOx emissions from road traffic and other mobile sources.
Figure 6. Projected NMVOC emissions from road traffic and other mobile sources.
13 going vessels which use residual oil have a very dominant share from now and onwards of the SO2 emission total for all mobile sources.
Agriculture
The NH3 emission projections for the agricultural sector cover five
different sources; livestock manure, artificial fertilisers, emissions from crops, enteric fermentation of straw and sewage sludge depos-ited on agricultural soil. The size of the emission depends on a num-ber of activity parameters for each source. Among others are the number of animals, the stable type, area with crops and the amount of sewage sludge deposited. The emission is estimated as activities multiplied with emission factors.
The main part of data for agricultural activities and emission factors originates from the Danish Agricultural Advisory Centre and The Danish Institute of Agricultural Sciences. Furthermore data from The Royal Veterinary and Agricultural University, the Ministry of Envi-ronment, the Danish Plant Directorate and the Danish Forest and Landscape Research Institute has been used. The emission projection is based on the development over the last 10 years and legislative measures when these are expected to result in changes in future agri-cultural activities.
As part of the efforts to reduce the ammonia emission in Denmark the Ammonia Action Plan and the Action Plan on the Aquatic Envi-ronment II have been worked out. It is expected that the Plan will be incorporated in the revision of the Statutory Order Of Livestock. The projection therefore also accounts for the effects of 1) a prohibition on broad-spreading of manure, 2) the time it takes for manure to be in-corporated into the soil when reduced from present 12 to 6 hours and 3) an implementation of a prohibition of ammonia treated straw. The increased awareness of environmental matters in the farm holding, particularly in relation to production expansion, implies that techni-cal measures must be expected to contribute to emission reduction in the future. It is however difficult to estimate the full consequences of the technical measures and therefore the emission impacts of these have not been included in the present projections.
NH 3 emissions (tonnes) NH 3 emissions (tonnes) Sum emissions
Excl. crops ans amm. treated straw
2001 2002 2003 2004 2005 2006 2007 2008 2009 2010 2001 2001 2003 2004 2005 2006 2007 2008 2009 2010 Pigs Cattle Poultry Fur farming Horses
Sheeps and goats 0 20000 40000 60000 80000 100000 120000 0 5000 10000 15000 20000 25000 30000 35000 40000 45000
Figure 7. Projected NH3 emissions from agricultural activities.
Figure 8. Projected NH3 emissions from husbandry manure.
On the basis of the projection of livestock production and the other activities within the agricultural sector the emission in 2010 is expected to be 91,800 tonnes NH3. The emission exclusive crops and ammonia
treated straw will be 79,100 tonnes NH3. This total corresponds to a
reduction of 10% compared with the year 2000. The major part - nearly 80% - of the ammonia emission from agriculture comes from livestock manure and mainly from cattle and pigs. The emission from hus-bandry manure is expected to decrease with 8% despite the increase in the pork and poultry production. The main reason for this reduction is an expected change in the way manure is spread. It is assumed that a greater part of the slurry will be incorporated in the soil and the time between spreading of manure and ploughing down is foreseen re-duced. The emission from other sources in 2010 is also expected to be reduced mainly due to a decrease in the agricultural area.
Pollutants summary
SO
2The Danish SO2 emission ceiling of 55 ktonnes in 2010 is almost
achieved according to the basis scenario in which the emission is 56.1 ktonnes or only 1.1 ktonnes above the target (Table 3). The largest source of the emission of SO2 is public power and district heating
plants and the most important parameters for the projected emissions are: the degree of desulphurisation, the content of sulphur in the fuels and the amount of electricity exported. In the present projection the estimates of the sulphur content in the fuels rely on conservative as-sumptions and a large export of electricity from 2004 is assumed.
NO
xThe projected NOx emission of 146.3 ktonnes in 2010 is somewhat
higher than the emission ceiling of 127 ktonnes. The three largest – and almost equivalent in size – sources are power and district heating plants, road transport and other mobile sources. It may be difficult to achieve this target and one of the main reasons is the large electricity export envisaged in the fuel consumption forecast from the DEA.
NMVOC
The NMVOC emission projection lies slightly below the emission ceiling of 85 ktonnes. The largest emission sources of NMVOC are road traffic, other mobile sources, use of solvents, non-industrial combustion plants and offshore activities. The projected emissions for NMVOC are very uncertain. Especially the emission estimates from use of solvents and offshore activities are attached with large uncer-tainties and the estimated emissions might change substantially should more research be made within this area.
NH
3The projected emissions in 2010 are estimated to be 83 ktonnes (ex-cluding emissions from crops) and compared with the emission ceil-ings of 69 ktons the ceiling is expected to be exceeded with about 14 ktonnes. Almost all emissions of NH3 result from agricultural
pro-15 Table 3. Projected emissions in the basis scenario.
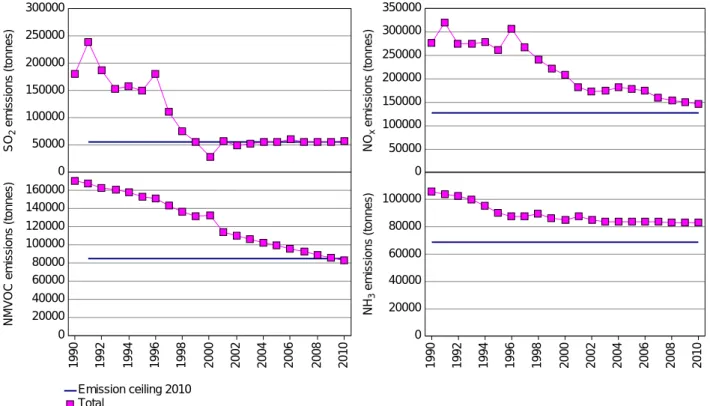
2001 2002 2003 2004 2005 2006 2007 2008 2009 2010 Emission ceilings SO2 (tonnes) 56697 48981 51349 55163 54528 60747 55774 55620 55841 56054 55000 NOx (tonnes) 181723 172992 173192 181627 177249 174561 158030 153865 150214 146369 127000 NMVOC (tonnes) 113356 109920 106367 102640 99211 95204 91995 88483 85644 83012 85000 NH3 (tonnes) 103108 99650 97763 96956 96732 96622 96361 96091 95776 95427 *NH3 (tonnes) 87812 85060 83877 83776 83640 83618 83446 83264 83037 82777 69000
*Agriculture excl. emissions from crops and straw treatment with NH3
Figure 9 shows the emission trends from 1990 to 2000 and the pro-jected emissions from 2001 to 2010. For all four pollutants significant reductions are seen from 1990 to 2000.
Emission reduction scenarios
The emission projections of SO2, NOx, NMVOC and NH3 show that the
respective emission ceilings for Denmark will not necessarily be reached in all cases. In addition to the already implemented and planned measures included in the basis calculations it is therefore of interest to investigate the potential emission savings for selected emis-sion reduction options in the different sectors. Technical measures have been chosen. It was outside the scope of this project to further examine the effect of changes in behaviour resulting from economic or political regulation or due to an increased environmental awareness in the public. In general the measures were selected from the sectors and activities that contribute with the larger emissions. Eight measures
SO 2 emissions (tonnes) NO x emissions (tonnes)
NMVOC emissions (tonnes) NH
3 emissions (tonnes) Emission ceiling 2010 Total 1990 1992 1994 1996 1998 2000 2002 2004 2006 2008 2010 1990 1992 1994 1996 1998 2000 2002 2004 2006 2008 2010 0 50000 100000 150000 200000 250000 300000 0 50000 100000 150000 200000 250000 300000 350000 0 20000 40000 60000 80000 100000 120000 140000 160000 0 20000 40000 60000 80000 100000
were analysed in order to determine their emission reducing capacity and the associated financial and welfare-economic costs.
Table 4. Additional emission reduction measures.
Reduction options not included Option Accum. Option Accum. Option Accum. Option Accum. in the reference scenario SO2 kt/year NOx kt/year NMVOC kt/year NH3 kt/year 1. Car-painting workshops:
water-based paint
0.00 0.00 0.00 0.00 0.75 0.75 0.00 0.00 2. Offshore wind turbine farm
(replaces coal-fired power plant)
0.51 0.51 0.23 0.23 0.01 0.76 0.00 0.00 3. SCR (de-NOx) unit installation
at large power plant
0.00 0.51 6.46 6.69 0.00 0.76 0.00 0.00 4. Desulphurisation unit at large
power plant
2.29 2.80 0.00 6.69 0.00 0.76 0.00 0.00 5. Electrical vehicles (70.000 in
2010)
0.02 2.82 0.05 6.74 0.20 0.96 0.00 0.00 6. EGR-filter installation (heavy
duty vehicles < 10 yr.)
0.00 2.82 2.84 9.58 0.61 1.57 0.00 0.00 7. Increased grazing of dairy cows 0.00 2.82 0.00 9.58 0.00 1.57 3.30 3.30 8. Manure application within one
hour after spreading
0.00 2.82 0.00 9.58 0.00 1.57 1.31 4.61 2010 emission:
In the reference scenario 56.05 146.37 83.01 82.78
Extra reductions included 53.23 136.79 81.44 78.17
ECE goals (Emission ceilings) 55.00 127.00 85.00 69.00
Regarding the industry the substitution of solvent-based paint with a water-based alternative in all Danish car-painting workshops is an option (1). In the energy sector the building of an offshore wind tur-bine farm was considered in two cases substituting electricity pro-duced on a natural gas and a coal-fired power plant (2). Installations of De-NOx and desulphurisation units at large power plants were also
examined (3 and 4 respectively). EGR (Exhaust Gas Recirculation) installations on heavy duty vehicles were analysed for three situa-tions: The first two options combine the retrofitting of EGR on vehi-cles less than 10 or 5 years old, respectively, with line installation on new vehicles, while the third option only considered new vehicles (5). The effect of replacing a) yearly new sales of 10,000 small gasoline cars and b) all new sales of small gasoline cars from 2004 to 2010 with electrical vehicles was also examined (6). The effects of increasing the amount of grazing days for dairy cows (7) and changes in the appli-cation of manure (8) were investigated for the agricultural sector. It is important to emphasise that the measures selected do not repre-sent a complete picture of all existing emission reduction options in the different sectors. The options should be considered only as possi-ble measures and not as a complete list of measures necessary to achieve the emission ceilings. In Table 4 the emission reduction measures considered in this project are listed along with the emission ceilings and the emission reductions achieved for each of the options. The SO2 target could be achieved by implementation of the
desul-phurisation option (reducing with 2.29 ktonnes). Use of fuels with lower content of sulphur than assumed in the basis calculations would also lead to further reduction of the emissions. It may be
diffi-17 plementing the options shown in Table 4. Especially the de-NOx unit
(SCR) and Exhaust Gas Recirculation (EGR) on all heavy-duty vehi-cles less than 10 years old would reduce the emission substantially. The potential emission savings of NMVOC from car painting work-shops are in the order of 0.75 ktonnes. The NMVOC emission reduc-tion estimated in the transport sector opreduc-tion is 0.81 ktonnes leading to a NMVOC emission total even further below the emission ceiling. Table 4 illustrates that the implementation of the two extra measures in the agricultural sector could reduce the emission gap with about 4.6 ktonnes NH3. The reduction of the NH3 emission needs to be
con-siderable in order to achieve the emission ceiling. However, the NH3
projections do not include future technical measures in relation to production expansion and these might potentially be sufficient to meet the emission goal. Examples of future technical solutions could be improved feeding methods and technology, slurry separation technologies and stable system improvements. However, at present no detailed knowledge exists about the potential for emission reduc-tions and costs involved for the introduction of these measures. Some of the assumptions made in the basis scenario have to be ana-lysed further in order to conclude whether new environmental regula-tions of the sectors are necessary. Especially the consequences of the European directive for Large Combustion Plants should be considered along with the future technical measures in the agricultural sector.
Financial and welfare-economic analysis
The additional emission reduction measures result in extra costs for the private entities implementing them (e.g. companies, private con-sumers, energy producing utilities, etc.) and for the society as such. In this project these extra costs have been valuated through a financial and welfare-economic analysis.
The financial (or budgetary) cost-benefit analysis calculates the finan-cial costs and benefits from the point of view of single actors or sub-groups of the population in an economy: the state, the private inves-tor, or the consumer. The prices used are the market prices either paid on the market for inputs in the form of producer or consumer goods or obtained on the market for selling products, including all non-refundable taxes and subsidies.
The welfare-economic evaluation seeks to determine the improve-ment in welfare for the population of a country by calculating the benefits and costs from the point of view of the country as a whole. The evaluation is based on so-called applied welfare economics (in this study the “accounting-price”-method is used). It considers that society’s resources are limited and that the use of these resources in one situation causes opportunity costs in terms of foregone benefits from the next best alternative usage.
The welfare economic analysis accounts for the value/benefit of the avoided environmental impacts. This is not considered in the finan-cial analysis.
Table 5. Financial costs for the investigated reduction measures.
Reduction options not included in the reference scenario
Primary sector affected
Investment costs
Annual costs SO2 NOx NMVOC NH3-N MDKK MDKK/yr 1000 DKK/tonne
1.Car-painting workshops: water-based paint
Industry 123.5 78.5 104.7
2. Offshore vind turbine farm (re-places coal-fired power plant)
Energy 1599.0 96.0 189.0 420.0 13700.0 3. SCR (de-NOx) unit installation at
large power plant
Energy 350.0 62.7 9.7
4. Desulphurisation unit at large power plant
Energy 60.0 9.2 4.0
5. Electrical vehicles (70.000 in 2010)
Households 3511.1 -266.3 -13300.0 -5200.0 -1300.0 6. EGR-filter installation (heavy
duty vehicles < 10 yr.)
Transport 8350.0 1619.9 570.0 2640.0 7. Increased grazing of dairy cows Agriculture 176.7 98.1 22.9 8. Manure application within one
hour after spreading
Agriculture 0.0 33.1 30.7
Financial analysis
The financial analysis shows the investment costs and the annual costs. The calculations demonstrate the costs for the primary sectors affected for each reduction option. It has not been possible to calcu-late the distributional effects for the remaining society, e.g. in case the energy sector passes on the costs to the consumers.
The results of the financial calculations (Table 5) show that the elec-trical vehicle option is the cheapest way of reducing SO2, NOx and
NMVOC emissions, since the annual extra cost is lower than the cost of the gasoline. This is, however, seen only from the viewpoint of the consumer whereas it is the most expensive option seen for the society as a whole (see Table 6 below). The de-NOx and desulphurisation options have relatively low costs, but since almost all large power plants already have or is planned to have these SO2 and NOx
emis-sion reducing installations, the impact will be small. For the low cost option of reducing NMVOC at car painting workshop there could be a large potential also in other industrial branches using solvents and paints. Increasing the amount of grazing days for dairy cows is a little cheaper than manure application within one hour after spreading.
Welfare-economic analysis
Ideally a welfare-economic analysis would include estimates of the different environmental and health effects (positive and negative) and other non-market effects associated with the implementation of a project. Given the high uncertainty associated with placing a mone-tary value on those non-market effects, their reporting is often re-stricted to physical units, e.g. tonnes of emissions reduced. In the main part of the analyses in this report welfare-economic cost-effectiveness measures in terms of costs-per-tonnes have been
calcu-19 below shows a first ranking of initiatives based on their cost-effectiveness estimates for the different emissions.
Table 6. Contribution of the different measures to emission reductions in 2010, ranking based on costs per tonne emission reduced (welfare-economic prices).
Ranking SO2-emissions
MDKK/ton Amount 2010 (tonnes) 1. 4. Desulphurisation unit at large power plant 0.005 2292 2. 2. Offshore wind turbine farm (replaces coal-fired power plant) 0.264 508 3. 5. Electrical vehicles (70.000 in 2010) 34.428 20
NOx-emissions
MDKK/ton Amount 2010 (tonnes) 1. 3. SCR (de-NOx) unit installation at large power plant 0.013 6460 2.a 2. Offshore wind turbinefarm (replaces natural gas-fired power plant) 0.259 236 2.b 2. Offshore wind turbine farm (replaces coal-fired power plant) 0.586 229 3.a 6. EGR-filter installation (heavy duty vehicles < 10 yr.) 0.766 2838 3.b 6. EGR-filter installation (heavy duty vehicles < 5 yr.) 0.785 1850 3.c 6. EGR-filter installation (heavy duty vehicles; only new) 0.870 692 4. 5. Electrical vehicles (70.000 in 2010) 13.501 51
NMVOC emissions
MDKK/ton Amount 2010 (tonnes) 1. 1. Car-painting workshops: water-based paint 0.126 750 2.a 6. EGR-filter installation (heavy duty vehicles; only new) 2.646 227 2.b 6. EGR-filter installation (heavy duty vehicles < 5 yr.) 3.205 453 3. 5. Electrical vehicles (70.000 in 2010) 3.460 199 6. EGR-filter installation (heavy duty vehicles < 10 yr.) 3.546 613 4.a 2. Offshore wind turbine farm (replaces natural gas-fired power
plant)
6.103 10
4.b 2. Offshore wind turbine farm (replaces coal-fired power plant) 19.157 7 NH3 emissions
MDKK/ton Amount 2010 (tonnes)
1. 7. Increased grazing of dairy cows 0.026 3299
2. 8. Manure application within one hour after spreading 0.029 1309
The two offshore wind turbine farm scenarios and the three different scenarios calculated for EGR-filter installations are mutually exclu-sive.
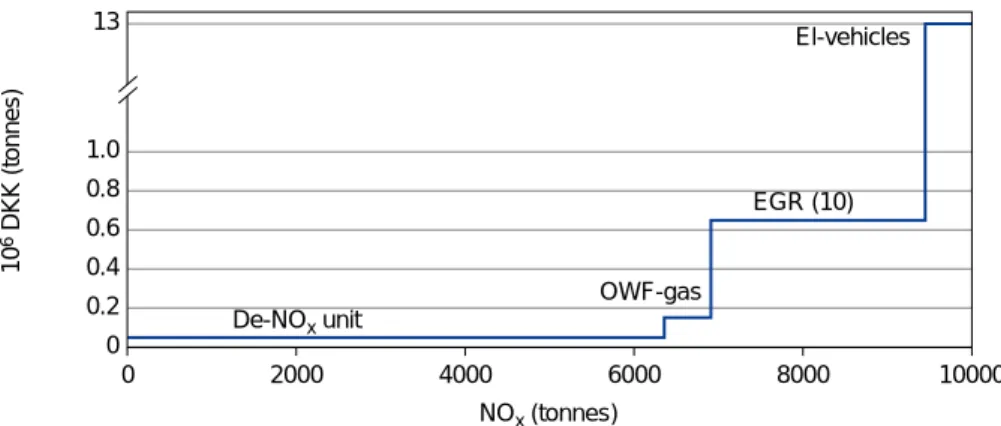
Based on the cost-effectiveness estimates summarised in Table 6 mar-ginal cost curves for emission reductions of SO2, NOx, NMVOC and
NH3 can be constructed, and as an example the marginal cost
func-tion for reducing NOx emissions is shown in Figure 10. Total costs of
implementing the present options are found as the area under the marginal cost function. The marginal cost function could serve as an inspiration to achieve certain emission reductions in the most cost-effective way.
The welfare-economic calculations have been based on a social time preference rate of 3%. This time preference rate has been applied for the calculations of present value costs, capital recovery factors and return on investment factors. Altering the social time preference rate to 6% would lead to a reduction of annual costs for the different measures. However, applying a social time preference rate of 6% in-stead of 3% does not change the ranking of initiatives based on their cost-effectiveness measures. Cost reductions per tonne of emission reduced range from 1.9% to 32% and are highest for those measures that require extremely high up-front investments (i.e. building an offshore wind turbine farm) or investments over a longer period of time, e.g. the replacement of conventional vehicles with electrical ones in the time period 2004 – 2010. Cost savings per tonne emission reduced are only modest for those measures that require relatively small investments (e.g. fencing equipment for increased grazing) or where modest investment expenses results in high emission savings, e.g. the installation of de-NOx and desulphurisation units at large
power plants.
The reduction measures suggested in this report also contribute to the reduction of other emission components such as particulates, CO2 and
CH4. These side benefits are included in a separate welfare-economic
cost-effectiveness analysis, using basis, minimum and maximum es-timates per tonne of emission published in a Danish inter-ministerial report. The estimates are regarded as extremely uncertain (especially the potential damage costs for CO2) and the analysis should therefore
solely be seen as an illustrative example. With respect to the ranking of measures based on their cost-effectiveness the inclusion of mone-tary values primarily effects the NOx- and NMVOC reducing
initia-tives. Building an offshore wind turbine farm will replace de-NOx
unit installations as the least expensive measure reducing Danish NOx
emissions. The offshore wind turbine farm emission reduction option is also the most cost-effective measure for NMVOC emission reduc-tion, although the total emission reduction in this case will be rather small: 10 or 7 tonnes per year respectively, depending on which type of conventional power production will be replaced.
Many emission reduction measures reduce more than one type of emission covered under the UNECE Convention on Long-Range
0 2000 4000 6000 8000 10000 De-NOx unit OWF-gas EGR (10) El-vehicles NOx (tonnes) 10 6 DKK (tonnes) 13 1.0 0.8 0.6 0.4 0.2 0
21 this report also contribute to the reduction of non-UNECE emission, i.e. particulates, CO and CO2. For a consistent comparison of the
cost-effectiveness of the different types of emission reduction initiatives it would therefore be useful to include monetary values for these envi-ronmental benefits. The valuation is however very uncertain and a sensitivety analysis has been conducted to illustrate this.
Including monetary values for environmental and health effects can have an impact on the final result of the analysis and the ranking of different emission reduction measures. Valuation of non-market goods and services can thus serve as an indication of where other side effects should be taken into consideration, when making policy decision about implementing different measures. However, it is also essential to keep in mind that any valuation attempt due to its inher-ent uncertainty and lack of ability to cover all non-market effects only provides an incomplete picture of all positive and negative side ef-fects associated with a particular measure.
Table 7 shows a ranking of the different measures according to their benefit-cost ratios. As can be seen, installing desulphurisation unit at large power plants yields the highest benefits per DKK invested. For each DKK invested in the installation society gets about DKK 6.48 worth of benefits, in terms of the monetary value of emissions re-duced by these measures. The replacement of conventional vehicles with electrical ones, on the other hand, produces only DKK 0.07 in benefits for each DKK invested.
Table 7. Ranking of measures according to their benefit-cost ratios.
Costs Benefits Benefit/cost
MDKK/year ratio Desulphurisation unit at large power plant 12.2 79.1 6.48
SCR (de-NOx) unit installation 82.1 216.4 2.64
Offshore wind farm (replaces natural gas-fired power plant) 61.0 106.6 1.75 Offshore wind turbine farm (replaces coal-fired power plant) 134.1 139.72 1.04 Car-painting workshops: water based paint 94.2 38.1 0.40 EGR-filter installation (< 10 years) 2173.4 405.1 0.19 EGR-filter installation (only new vehicles) 601.7 108.2 0.18 EGR-filter installation (< 5 years) 1451.4 257.9 0.18
Sammenfatning
Introduktion
Formålet med nærværende projekt har været at udvikle danske mod-eller til fremskrivning af SO2-, NOx-, NMVOC- og NH3-emissionerne
til atmosfæren frem til 2010 og at estimere emissionerne i 2010 for de fire stoffer. Emissionsfremskrivningerne dækker følgende økonomi-ske sektorer: Energi, industri, transport og landbrug.
I Europa reguleres den regionale luftforurening af en række proto-koller under FN’s konvention om langtransporteret, grænseoverskri-dende luftforurening (United Nations Economic Commission for Europe Convention on Longe Range Transboundary Air Pollution (CLRTAP)). Formålet med den nye protokol – Gøteborg-protokollen – er at kontrollere og reducere emissionerne af SO2, NOx, NMVOC og
NH3. I modsætning til de tidligere protokoller er parterne i
protokol-len ikke forpligtede til at reducere emissionerne med en bestemt pro-cent i forhold til emissionerne i et basisår. I stedet er der for hvert land fastlagt emissionslofter, bestemt ud fra den viden der findes om kritiske belastninger og miljømæssige påvirkninger indenfor Europas geografiske område. Tabel 1 viser emissionslofterne for Danmark i 2010. De samme emissionslofter er givet i EU-direktivet: Directive 2001/81/EC of the European Parliament and of the Council of 23 October 2001 on national emission ceilings for certain atmospheric pollutants.
Tabel 1. Emissionslofter for Danmark i 2010 (tons).
Stoffer SO2 NOx NMVOC NH3*
Emissionslofter 55.000 127.000 85.000 69.000
* NH3 emissionsloftet er eksklusiv emissioner fra afgrøder og ammoniakbehandlet halm.
Projektets modeller kan bruges til at beregne de forventede emis-sioner af de fire stoffer i 2010 udfra antagelser om udviklingen inden-for hver af de fire sektorer. Modellerne kan også anvendes til at beregne effekten af forskellige emissionsreduktionsscenarier. Ved at undersøge de mulige reduktionstiltag og de tilhørende budget- og velfærdsøkonomiske omkostninger kan modellen anvendes som et redskab til at finde den mest omkostningseffektive strategi for at nå emissionslofterne.
Emissionerne er fremskrevet på baggrund af et basisscenarium, som inkluderer alle implementerede og planlagte tiltag. Udover basissce-nariet er otte ekstra scenarier blevet analyseret for at estimere poten-tielle emissionsreduktioner og de budget- og velfærdsøkonomiske konsekvenser af hvert scenarium. De 8 emissionsreduktionsscenarier indeholder sandsynlige reduktionstiltag indenfor alle 4 sektorer og bruges til at demonstrere modellens anvendelighed. Resultaterne er sammenfattet i tabel 2. Udfra de givne forudsætninger vil de
23 tiltag da alle tiltag har en maksimal emissionsreduktionskapacitet (fx antallet af anlæg hvor det er muligt at installere de-NOx-anlæg).
Re-sultaterne i tabel 2 indikerer de muligheder der er for at anvende modellen til at finde en reduktionsstrategi, der samtidig er teknisk mulig og mest omkostningseffektiv.
Tabel 2. Emissionsfremskrivningerne i 2010 på baggrund af basisscenariet sammenlignet med emissionslofterne og konsekvenserne af de undersøgte reduktionsscenarier. Omkostningerne er beregnet som velfærdsøkonomiske omkostninger.
SO2 NOx NMVOC NH3 Omkostninger pr. ton
1000 tons Mill. DKK pr. ton Fremskrevne emissioner 2010 56,05 146,37 83,01 82,78 -Emissionslofter 2010 55,00 127,00 85,00 69,00 -Manko 1,05 19,37 - 13,77 -Emissionsreduktionsscenarierne
1. Autolakerere: vandbaseret maling 0,00 0,00 0,75 0,00 NMVOC: 0,126 2. Havvindmølleparker (erstatter
kulfy-rede kraftværker)
0,51 0,23 0,01 0,00 SO2: 0,264 NOx: 0,586 NMVOC: 19,157 3. SCR (de-NOx)-anlæg på stort
kraft-værk
0,00 6,46 0,00 0,00 NOx: 0,013 4. Afsvovlingsanlæg på stort kraftværk 2,29 0,00 0,00 0,00 SO2: 0,005
5. Elektriske biler (70.000 i 2010) 0,02 0,05 0,20 0,00 SO2: 34,428 NOx: 13,501
NMVOC: 3,460 6. EGR-filter installation (tunge køretøjer
< 10 år gamle)
0,00 2,84 0,61 0,00 NOx: 0,766
NMVOC: 3,456 7. Forøget antal græsningsdage for
malkekøer
0,00 0,00 0,00 3,30 NH3: 0,026 8.Nedfældning af gødning inden for en
time efter spredning
0,00 0,00 0,00 1,31 NH3: 0,029
Reduktion total 2,82 9,58 1,57 4,61
-Emissioner inklusiv reduktionerne 53,23 136,79 81,44 78,17
Fremskrivningsmodeller
EnergiFremskrivningen af emissionerne fra stationære forbrændingsanlæg er estimeret ved hjælp af en ny model udviklet i nærværende projekt. Energiforbruget i modellen er baseret på Energistyrelsens fremskriv-ning af energiforbruget i henhold til opfølgfremskriv-ningen på den danske energiplan ’Energi 21’. Emissionsfremskrivningen er baseret på den mængde brændsel som forventes at blive forbrændt på danske værker og er altså ikke korrigeret for international handel med elek-tricitet. Fra 2004 er der antaget at den danske eksport af elektricitet stiger med ca. 90 PJ således at det totale brændselsforbrug på sta-tionære forbrændingsanlæg stiger til 410 PJ.
For værker større end 25 MWe er brændselsforbruget specificeret tillige med oplysninger om emissionsbegrænsende foranstaltninger, svovlindhold i brændsler, afsvovlingsgrader og emissionsfaktorer. Disse oplysninger er baseret på elværkernes antagelser om de fremti-dige forhold for hvert enkelt blok. For anlæg mindre end 25 MWe er emissionsfaktorerne beregnet udfra emissionsgrænseværdier i bek-endtgørelser og vejledninger, oplysninger fra elværkerne og andre danske virksomheder. Målinger har vist at NOx-emissionsfaktorerne
er højere for gasturbiner og stationære gasmotorer end for kedler. Modellen er opbygget så det er muligt at ændre alle vigtige parame-tre for såvel små som store forbrændingsanlæg.
De vigtigste kilder til SO2-emissionen er kraft- og fjernvarmeværker
efterfulgt af industrielle- og ikke-industrielle forbrændingsanlæg. SO2-emissionen fra de to sidstnævnte kilder er næsten konstante i
hele perioden fra 2001 til 2010. Emissionerne fra kraft- og fjernvarme-produktionen følger brændselsforbruget for denne sektor, og den øgede eksport fra 2004 resulterer i en stigning i emissionen fra dette år. For NOx-emissionen er den vigtigste kilde – ligesom for SO2
-emissionen – kraft- og fjernvarmeværker. Fra 2006 ses et brat fald i emissionen, da de-NOx-anlæg forventes at blive installeret på nogle af
de store kraftværksblokke. I modsætning til SO2- og NOx
-emission-erne er den største kilde til NMVOC-emissionen ikke-industrielle forbrændingsanlæg. Specielt forbrænding af træ i hus-holdningssektoren bidrager til NMVOC-emissionen. SO2- og NOx
-emissionerne fra kraftværker større end 25 MWe bidrager med hen-holdsvis 80% og 60% af de totale emissioner fra kraft- og fjernvar-meværker.
Industri
De fremskrevne emissioner fra industrisektoren omfatter hoved-sageligt emissioner fra olie- og gasudvinding og brug af opløsnings-midler. NMVOC er det stof der emitteres i størst mængde og de vig-tigste kilder er brug af opløsningsmidler, udvinding af olie og gas samt produktionsprocesser på raffinaderier. Beregning af emissionerne fra olie- og gasindustrien er baseret på Energistyrelsens fremskrivning af olie- og gasproduktionen samt emissionsfaktorer fra den europæiske vejledning til beregning af emissioner (the Joint EMEP/EEA Atmospheric Emission Guidebook). Specielt emissioner fra produktionsprocesserne, emissioner fra lastning af olie til skibe og emissioner fra naturgasnettet bidrager til NMVOC-emissionerne. Anvendelse af opløsningsmidler i industrien finder i stor
ud-0 10000 20000 30000 40000 50000 60000 70000 0 10000 20000 30000 40000 50000 60000 70000 80000 SO 2 emission (tons) NO x emission (tons) 2001 2002 2003 2004 2005 2006 2007 2008 2009 2010 2001 2001 2003 2004 2005 2006 2007 2008 2009 2010 Kraft- og fjernvarmeværker Ikke industrielle forbrændingsanlæg
Industrielle forbrændingsanlæg Total
Figur 1. Fremskrivning af SO2-emissionen for ener-gisektoren.
Figur 2. Fremskrivning af NOx-emissionen for ener-gisektoren.
25 metalindustrien, ved fremstilling af maling, i plastindustrien, i nærings- og nydelsesmiddelindustrien, ved anvendelse af træbeskyttelse og i den grafiske branche. For disse områder aftalte regeringen og de relevante brancher at reducere emission af NMVOC med 40% fra 1988 til 2000. Som en del af aftalen har industri-brancherne indsamlet emissionsdata for de forskellige industrier. Modellen til beregning af de industrielle emissioner er baseret på disse data. Der findes ingen fremskrivninger af danske aktivitets- og emissionsdata for industriel brug af opløsningsmidler, og det er der-for antaget at emissionerne vil falde med 57% fra 1990 til 2010 hvilket er den samme reduktion som antaget i et europæisk projekt.
Der findes ingen detaljeret opgørelse over husholdningers brug af opløsningsmidler. Den anbefalede emissionsfaktor fra den euro-pæiske vejledning til beregning af emissioner er derfor anvendt ved emissionsfremskrivningen. Emissionerne er estimerede ved at gange emissionsfaktoren med de fremskrevne befolkningstal.
Transport
Vejtrafikkens emissioner fra biler hvor motorerne er blevet varme, koldstart og fordampning af brændstof er beregnet med en ny model udviklet i dette projekt. Modellen inkluderer også emissionseffekten af katalysatorslid. Trafik- og bestandsdata er oplyst af Vejdirektoratet og er efterfølgende samlet i grupper med samme gennemsnitlige emissioner og energiforbrug. For hver køretøjsgruppe beregnes emis-sionerne ved at kombinere antallet af køretøjer og årskørslen med emissionsfaktorer for varme motorer, forholdet mellem emissioner fra kolde og varme motorer og faktorer for fordampning. Konsisten-sen mellem emissionsprognoKonsisten-sen og de historiske emissionsopgørelser opnås ved at bruge baggrundsdata fra den europæiske COPERT III emissionsmodel, der bruges til at opgøre de årlige danske emissioner. På denne måde anvendes COPERT III prognosemodellens emissi-onsdata såsom basisemissionsfaktorer for varme motorer, reduktions-faktorer for fremtidige køretøjsteknologier, forværrelsesreduktions-faktorer for katalysatorbiler og kold:varm forhold.
NMVOC emission (tons) Produktion af gas og olie
Raffinaderier
Udvinding og distribution af fossile brændsler
Olie (mio m3) Naturgas (mia Nm3) Industriel brug af opløsningsmidler
Husholdningers brug af opløsningsmidler
2001 2002 2003 2004 2005 2006 2007 2008 2009 2010 2001 2001 2003 2004 2005 2006 2007 2008 2009 2010 0 2000 4000 6000 8000 10000 12000 14000 16000 0 5 10 15 20 25
Figur 3. Fremskrivning af NMVOC-emissionen for de vigtigste kilder.
En ny model er også udviklet til beregning af emissionerne fra fritids-fartøjer, landbrugsmaskiner, skovbrugsmaskiner, industrikøretøjer samt have- og husholdsredskaber. Ved beregningerne kombineres oplysninger om bestanden af forskellige maskiner og deres respekti-ve motorstørrelser, belastningsfaktorer, årlige driftstimer og emissi-onsfaktorer. Fremtidige emissionsreduktioner tages i betragtning i modellen ved at inkludere effekten af to EU emissionsdirektiver. For de resterende transportkategorier forventes ingen reelle emissionsre-duktioner. Emissionsprognosen for disse beregnes ved at bruge de seneste historiske emissionsfaktorer sammen med Energistyrelsens energifremskrivning.
Personbilernes NOx- og NMVOC-emissioner er faldet konstant siden
1990, hvor katalysatorkravet blev indført for benzinbiler. De totale emissionsreduktioner er siden blevet forstærket med nye gradvist skrappere emissionskrav for alle køretøjskategorier. Denne udvikling forventes at fortsætte i fremtiden. Den relative emissionsændring fra 2001 til 2010 forventes for NOx og NMVOC at være større for
fikken end for de øvrige transportsektorer. I perioden falder vejtra-fikkens NOx og NMVOC andele fra hhv. 57 og 68% til hhv. 47 og 51%.
Brugen af katalysatorbiler gør, at NH3-emissionen stiger markant.
Stigningstakten bliver mindre i slutningen af prognoseperioden, hvor næsten alle konventionelle benzinbiler er erstattet med katalysator-biler. Den allerede lave svovlprocent på 50 ppm for benzin og diesel forventes yderligere nedsat til 10 ppm i 2005. Som en følge heraf vil SO2-emissionen fra skibe der bruger svær olie udgøre en stigende
andel af transportsektorens totale emission.
Landbrug
Ammoniakemissionen fra landbruget stammer hovedsaglig fra fem forskellige kilder: Husdyrgødning, handelsgødning, afgrøder, am-moniakbehandlet halm til foder og spildevandsslam udledt på land-brugsjord. For hver af kilderne er der en række aktiviteter, der har betydning for omfanget af fordampningen så som antal dyr,
stald-NO
x
emission (tons)
NMVOC emission (tons)
Vejtrafik Andre mobile 2001 2002 2003 2004 2005 2006 2007 2008 2009 2010 2001 2001 2003 2004 2005 2006 2007 2008 2009 2010 0 10000 20000 30000 40000 50000 60000 70000 80000 0 5000 10000 15000 20000 25000 30000 35000 40000 45000
Figur 5. Fremskrivning af NOx-emissionen for
vej-trafik og andre mobile kilder.
Figur 6. Fremskrivning af NMVOC-emissionen for vejtrafik og andre mobile kilder.
27 moniakemission opgøres som summen af aktiviteterne multipliceret med emissionsfaktoren for hver aktivitet.
Aktiviteter og emissionsfaktorer er hovedsageligt baseret på oplys-ninger fra Landbrugets Rådgivningscenter og Dansk Jordbrugsfor-skning. Derudover er anvendt informationer fra Landbohøjskolen, Plantedirektoratet, Forskningscenteret for Skov- og Landskab og Miljøstyrelsen. Fremskrivningen er fortrinsvis estimeret udfra udvik-lingstendenserne de seneste ti år. Lovmæssige tiltag som forventes at medvirke til ændringer i den fremtidige landbrugsdrift, er ligeledes inddraget.
I Danmark er der gennemført en række tiltag for at reducere ammo-niakemissionen, hvilket er udmøntet i Ammonaikhandlingsplanen og Vandmiljøplan I og II. Det forventes at Ammoniakhandlingsplanen vil blive implementeret i forbindelse med revideringen af husdyr-bekendtgørelsen. I fremskrivningen er der således taget højde for 1) forbud mod bredspredning af husdyrgødning 2) reduktion af henlig-getiden fra 12 til 6 timer, 3) forbud mod ammoniakbehandling af halm. Den stigende fokusering på miljøhensyn og særlig i forbindelse med udvidelse af husdyrproduktionen betyder, at fremtidige tek-niske foranstaltninger vil medvirke til en reduktion af ammoniakfor-dampningen. Det er dog vanskeligt at vurdere, hvor stor effekten vil være for den samlede emission. Fremskrivningen er derfor baseret på den nuværende teknologi der anvendes i landbruget og inddrager således ikke effekten af mulige fremtidige ammoniakreducerende tekniske foranstaltninger.
På baggrund af fremskrivningen af husdyrproduktionen og de øvrige aktiviteter i landbrugssektoren forventes ammoniakemissionen i år 2010 at udgøre 91.800 tons NH3. Emissionen eksklusiv emissionen fra
afgrøder og ammoniakbehandlet halm udgør 79.100 tons NH3. Det
betyder en forventet reduktion på 10% sammenlignet med år 2000. Den største andel af ammoniak kommer fra håndtering af hus-dyrgødning – svarende til ca. 80% og omfatter hovedsageligt gødning fra kvæg og svin. Det forventes at emissionen fra husdyrgødning vil falde med 8% på trods af en stigning i produktionen af slagtesvin- og slagtefjerkræ. En af de væsentligste årsager til reduktionen skyldes
NH 3 emission (tons) NH 3 emission (tons) Total emission
Excl. afgrøder og ammoniakbehandlet halm
2001 2002 2003 2004 2005 2006 2007 2008 2009 2010 2001 2001 2003 2004 2005 2006 2007 2008 2009 2010 Svin Kvæg Fjerkræ Pelsdyr Heste Får og geder 0 20000 40000 60000 80000 100000 120000 0 5000 10000 15000 20000 25000 30000 35000 40000 45000
Figur 7. Fremskrivning af ammoniakemissionen for landbruget.
Figur 8. Fremskrivning af ammoniakemissionen for husdyrgødning.
forventningen om, at der vil ske en ændring i udbringningspraksis. En større del af gyllen vil blive nedfældet og henliggetiden vil blive reduceret betydeligt. Emissionen fra de øvrige kilder forventes lige-ledes at blive reduceret i år 2010, hvilket skyldes et fald i det dyrkede areal.
Emissionsfremskrivninger
SO2Det danske SO2 emissionsloft på 55 ktons er næsten nået. Emissionen
er på baggrund af basisscenariet estimeret til 56,1 ktons eller kun 1,1 ktons over målet (tabel 3). Den største kilde til SO2-emissioner er
kraft- og fjernvarmeværker og de faktorer der har størst indflydelse på de fremskrevne emissioner er: svovlindholdet i brændslerne, afsvovlingsgraden og mængden af elektricitet der eksporteres. I nær-værende fremskrivning er der regnet med forholdsvis høje svovlpro-center og en stor eksport af elektricitet fra 2004.
NOx
Den fremskrevne NOx-emission på 146,4 ktons i 2010 er noget højere
end emissionsloftet på 127 ktons. De tre største og næste lige store kilder er kraft- og fjernvarmeværker, vejtrafik og andre mobile kilder. En af hovedårsagerne til at det kan blive vanskeligt at nå målet er den store eksport af elektricitet, der er regnet med i Energistyrelsens en-ergifremskrivning.
NMVOC
NMVOC-emissionsfremskrivningen ligge lige under emissionsloftet på 85 ktons. De største kilder til emissionen er vejtrafik, andre mobile kilder, opløsningsmidler, brændeovne og offshore-aktiviteter. De estimerede emissioner er meget usikre. Det gælder specielt for emis-sionsberegningerne for brug af opløsningsmidler og offshore-aktiviteter og emissionsfremskrivningerne vil kunne ændres en del, hvis der opnås mere viden inden for disse områder.
NH3
De fremskrevne emissioner i 2010 er estimeret til 83 ktons (eksklusiv emission fra afgrøder) og sammenlignet med emissionsloftet på 69 ktons er dette 14 ktons over målet. Næsten hele emissionen stammer
fra landbruget og hovedkilden er husdyrgødning. I NH3
-fremskrivningen er der ikke taget højde for fremtidige tekniske tiltag, da det på nuværende tidspunkt ikke har været muligt at beregne de emissionsmæssige konsekvenser af disse.
29 Tabel 3. Emissionsfremskrivninger på baggrund af basisscenariet.
2001 2002 2003 2004 2005 2006 2007 2008 2009 2010 Emissions-lofter SO2 (tons) 56697 48981 51349 55163 54528 60747 55774 55620 55841 56054 55000 NOx (tons) 181723 172992 173192 181627 177249 174561 158030 153865 150214 146369 127000 NMVOC (tons) 113356 109920 106367 102640 99211 95204 91995 88483 85644 83012 85000 NH3 (tons) 103108 99650 97763 96956 96732 96622 96361 96091 95776 95427 *NH3 (tons) 87812 85060 83877 83776 83640 83618 83446 83264 83037 82777 69000
*Landbrug eksklusiv emissioner fra afgrøder og ammoniakbehandlet halm.
Figur 9 viser emissionsudviklingen fra 1990 til 2000 samt de fremskrevne emissioner fra 2001 til 2010. For alle fire stoffer ses en signifikant reduktion af emissioner fra 1990 til 2000.
Emissionsreduktionsscenarier
Emissionsfremskrivningerne af SO2, NOx, NMVOC og NH3 viser at
emissionslofterne i visse tilfælde overskrides. Det er derfor interes-sant at undersøge de mulige emissionsreduktion der kan opnås for udvalgte reduktionsscenarier for de forskellige sektorer i tilgift til de allerede implementerede og planlagte begrænsningstiltag. Kun tek-niske tiltag er undersøgt, da det har været uden for dette projekts rammer at opstille scenarier for adfærdsmæssige ændringer som re-sultat af økonomisk eller politisk regulering eller pga. en stigende miljøbevidsthed i befolkningen. Generelt er reduktionstiltagene ud-valgt ud fra hvilke sektorer og aktiviteter der har de største emis-sionsandele. Otte tiltag er undersøgt for at finde emissionsbesparel-sen og de tilknyttede budget- og velfærdsøkonomiske omkostninger.
SO 2 emission (tons) NO x emission (tons)
NMVOC emission (tons) NH
3 emission (tons) Emissionsloft 2010 Total 1990 1992 1994 1996 1998 2000 2002 2004 2006 2008 2010 1990 1992 1994 1996 1998 2000 2002 2004 2006 2008 2010 0 50000 100000 150000 200000 250000 300000 0 50000 100000 150000 200000 250000 300000 350000 0 20000 40000 60000 80000 100000 120000 140000 160000 0 20000 40000 60000 80000 100000
Tabel 4. Reduktionsscenarier yderligere undersøgt i projektet.
Reduktionsscenarier Scen. Akkum. Scen. Akkum. Scen. Akkum. Scen. Akkum. SO2 (kt/år) NOx (kt/år) NMVOC (kt/år) NH3 (kt/år)
1. Autolakerere: vandbaseret maling 0,00 0,00 0,00 0,00 0,75 0,75 0,00 0,00 2. Havvindmølleparker (erstatter
kulfy-rede kraftværker)
0,51 0,51 0,23 0,23 0,01 0,76 0,00 0,00 3. SCR (de-NOx)-anlæg på stort
kraft-værk
0,00 0,51 6,46 6,69 0,00 0,76 0,00 0,00 4. Afsvovlingsanlæg på stort kraftværk 2,29 2,80 0,00 6,69 0,00 0,76 0,00 0,00 5. Elektriske biler (70.000 in 2010) 0,02 2,82 0,05 6,74 0,20 0,96 0,00 0,00 6. EGR-filter installation (tunge
køretøjer < 10 år gamle)
0,00 2,82 2,84 9,58 0,61 1,57 0,00 0,00 7. Forøget antal græsningsdage for
malkekøer
0,00 2,82 0,00 9,58 0,00 1,57 3,30 3,30 8. Nedfældning af gødning inden for en
time efter spredning
0,00 2,82 0,00 9,58 0,00 1,57 1,31 4,61 2010 emission:
Basisfremskrivning 56,05 146,37 83,01 82,78
Medregnet yderligere emissionsreduk-tioner
53,23 136,79 81,44 78,17
ECE mål (emissionslofter) 55,00 127,00 85,00 69,00
For industrisektoren er der set på effekter af at erstatte oliebaseret maling med vandbaseret maling ved autolakering (1). I et scenarie for energisektoren overvejes det at opføre en havvindmøllepark hvis elproduktion kan erstatte elproduktionen på et naturgas- og et kulfy-ret kraftværk (2). Installation af de-NOx- og afsvovlingsanlæg på store
kraftværker er også undersøgt (3 og 4). For transportsektoren er tre EGR (Exhaust Gas Recirculation) scenarier opstillet: De første to tiltag inkluderer eftermontering af EGR på ældre køretøjer (hhv. mindre end 10 og 5 år gamle) mens det tredje tiltag udelukkende beregner effekten af EGR på nye køretøjer (5). Et andet transporttiltag under-søger effekten af at lade elbiler erstatte a) et årligt nysalg på 10.000 små benzinpersonbiler og b) alle små benzinpersonbiler fra 2004 til 2010 (6). For landbrugssektoren indeholder scenarierne (7) en øgning af antallet af dage på græs for malkekvæg og (8) en ændret gødning-spraksis hos landmændene.
Det skal understreges at de udvalgte tiltag ikke giver et komplet billede af mulighederne for emissionsbesparelser i de forskellige sektorer. Scenarierne skal kun ses som mulige tiltag og er altså ikke en komplet liste over tiltag, der er nødvendige for at nå emis-sionslofterne. I tabel 4 er de otte tiltag og deres mulige emissions-reduktioner vist sammen med emissionslofterne.
SO2 loftet kan opnås ved at implementere tiltaget med
afsvovlings-anlæg på store kraftværker (reduktion: 2,29 ktons). Brug af brændsler med et lavere svovlindhold end forudsat i basisfremskrivningen vil også give lavere emissioner. Med de givne forudsætninger bliver det vanskeligt at overholde emissionsloftet for NOx. Omkring halvdelen
af den overskydende NOx-emission (19,4 ktons) kan fjernes ved at
implementere de otte reduktionstiltag (9,6 ktons). Specielt installation
af de-NOx-anlæg (SCR) på store kraftværker og EGR på tunge
køretøjer, der er mindre end 10 år gamle, vil bidrage til at reducere NO-emissionen.
31 Den potentielle NMVOC-emissionsbesparelse for autolakering er omtrent 0,75 ktons. Emissionsbesparelsen for EGR-tiltaget er 0,81, hvilket bringer den totale NMVOC-emission ned på 81,44.
Indførelsen af de to landbrugstiltag kan reducere NH3-emissioner med
4,6 ktons NH3 (jvf. tabel 4), men NH3-emissionen skal reduceres
yder-ligere, hvis emissionsloftet skal overholdes. Det gælder dog, at NH3
-fremskrivningen ikke inkluderer fremtidige teknologiske løsninger i forbindelse med produktionsudvidelse og disse er måske tilstrække-lige til at NH3-emissionsmålet kan nås. Eksempler på fremtidige
teknologiske tiltag er mere effektive fodermetoder og -teknologier, metoder til gylleseparering samt forbedrede staldtypesystemer. På nuværende tidspunkt findes der ingen detaljeret viden om potentialet for emissionsreduktion og omkostningerne forbundet med at indføre disse teknologiske muligheder.
Visse af antagelserne i basisfremskrivningen skal analyseres nærmere før det kan konkluderes om nye miljøreguleringer er nødvendige i de enkelte sektorer. Specielt konsekvenserne af EU-direktivet for store forbrændingsanlæg skal vurderes sammen med de fremtidige teknologiske reduktionsmuligheder for landbruget.
Budget- og velfærdsøkonomisk analyse
De ekstra reduktionstiltag medfører yderligere omkostninger - både for de forskellige sektorer (såsom selskaber, den private forbruger, energiproducerende foretagender osv.) og for samfundet i det hele taget. I dette projekt er disse ekstra omkostninger belyst via en budget- og velfærdsøkonomisk analyse.
Den budgetøkonomiske analyse omfatter de finansielle omkostninger og gevinster set ud fra de enkelte aktørers eller befolkningsgruppers synsvinkler; dvs. staten, den private investor eller forbrugeren. De priser, der bruges er markedspriser, som enten betales på input-markedet i form af produktions- eller forbrugsvarer eller som opnås på markedet for produktsalg, inklusiv alle ikke-refunderbare skatter og subsidier.
I den velfærdsøkonomiske vurdering forsøger man at bestemme vel-færdsudviklingen for et lands befolkning ved at beregne omkost-ninger og gevinster for landet som helhed. Vurderingen er baseret på velfærdsøkonomisk teori og i denne undersøgelse er ”beregningspris-metoden” anvendt. Denne metode bygger på at samfundets resurser er begrænsede og det forhold, at resurser anvendt i én situation med-fører alternativomkostninger ved at samfundet mister mulige gevin-ster ved en anden anvendelse.
Gevinster ved reducerede påvirkninger af miljøet er taget i betragt-ning i den velfærdsøkonomiske analyse.
Tabel 5. Budgetøkonomiske omkostninger for de ekstra reduktionsscenarier.
Reduktionsoptioner som ikke er inkluderet i reference scenarium
Sektor der primært påvirkes Investerings-udgifter Årlige udgifter SO2 NOx NMVOC NH3-N MDKK MDKK/år 1000 DKK/ton 1. Autolakerere: vandbaseret maling Industri 123,5 78,5 104,7 2. Havvindmølleparker (erstattes af
kul-drevne kraftværker)
Energi 1599,0 96,0 189,0 420,0 13700,0 3. SCR (de-NOx)-anlæg på stort kraftværk Energi 350,0 62,7 9,7
4. Afsvovlingsanlæg på stort kraftværk Energi 60,0 9,2 4,0
5. Elektriske biler (70.000 i 2010) Husstand 3511,1 -266,3 -13300,0 -5200,0 -1300,0 6. EGR-filter installation (tunge køretøjer
< 10 år gaml