INFLUENCE OF MULTIMEDIA HINTS ON CONCEPTUAL PHYSICS PROBLEM SOLVING AND VISUAL ATTENTION
by
XIAN WU
B.S., Wuhan University, 2007 M.S., University of New Hampshire, 2012
AN ABSTRACT OF A DISSERTATION
submitted in partial fulfillment of the requirements for the degree
DOCTOR OF PHILOSOPHY
Department of Physics College of Arts and Sciences
KANSAS STATE UNIVERSITY Manhattan, Kansas
Abstract
Previous research has showed that visual cues can improve learners’ problem solving performance on conceptual physics tasks. In this study we investigated the influence of multimedia hints that included visual, textual, and audio modalities, and all possible combinations thereof, on students’ problem solving performance and visual attention. The participants (N = 162) were recruited from conceptual physics classes for this study. Each of them participated in an individual interview, which contained four task sets. Each set contained one initial task, six training tasks, one near transfer task and one far transfer task. We used a 2 (visual hint/no visual hint) × 2 (text hint/no text hint) × 2 (audio hint/no audio hint) between participant quasi-experimental design. Participants were randomly assigned into one of the eight conditions and were provided hints for training tasks, corresponding to the assigned condition. Our results showed that problem solving performance on the training tasks was affected by hint modality. Unlike what was predicted by Mayer’s modality principle, we found evidence of a reverse modality effect, in which text hints helped participants solve the physics tasks better than audio hints. Then we studied students’ visual attention as they solved these physics tasks. We found the participants preferentially attended to visual hints over text hints when they were presented simultaneously. This effect was unaffected by the inclusion of audio hints. Text hints also imposed less cognitive load than audio hints, as measured by fixation durations. And presenting visual hints caused more cognitive load while fixating expert-like interest areas than during the time intervals before and after hints. A theoretical model is proposed to explain both problem solving performance and visual attention. According to the model, because visual hints integrated the functions of selection, organization, and integration, this caused a relatively heavy cognitive load yet improved problem solving performance. Furthermore, text hints were a better
resource for complex linguistic information than transient audio hints. We also discuss limitations of the current study, which may have led to results contrary to Mayer’s modality principle in some respects, but consistent with it in others.
INFLUENCE OF MULTIMEDIA HINTS ON CONCEPTUAL PHYSICS PROBLEM SOLVING AND VISUAL ATTENTION
by
XIAN WU
B.S., Wuhan University, 2007 M.S., University of New Hampshire, 2012
A DISSERTATION
submitted in partial fulfillment of the requirements for the degree
DOCTOR OF PHILOSOPHY
Department of Physics College of Arts and Sciences
KANSAS STATE UNIVERSITY Manhattan, Kansas
2016
Approved by: Major Professor Brett DePaola
Copyright
XIAN WUAbstract
Previous research has showed that visual cues can improve learners’ problem solving performance on conceptual physics tasks. In this study we investigated the influence of multimedia hints that included visual, textual, and audio modalities, and all possible combinations thereof, on students’ problem solving performance and visual attention. The participants (N = 162) were recruited from conceptual physics classes for this study. Each of them participated in an individual interview, which contained four task sets. Each set contained one initial task, six training tasks, one near transfer task and one far transfer task. We used a 2 (visual hint/no visual hint) × 2 (text hint/no text hint) × 2 (audio hint/no audio hint) between participant quasi-experimental design. Participants were randomly assigned into one of the eight conditions and were provided hints for training tasks, corresponding to the assigned condition. Our results showed that problem solving performance on the training tasks was affected by hint modality. Unlike what was predicted by Mayer’s modality principle, we found evidence of a reverse modality effect, in which text hints helped participants solve the physics tasks better than audio hints. Then we studied students’ visual attention as they solved these physics tasks. We found the participants preferentially attended to visual hints over text hints when they were presented simultaneously. This effect was unaffected by the inclusion of audio hints. Text hints also imposed less cognitive load than audio hints, as measured by fixation durations. And presenting visual hints caused more cognitive load while fixating expert-like interest areas than during the time intervals before and after hints. A theoretical model is proposed to explain both problem solving performance and visual attention. According to the model, because visual hints integrated the functions of selection, organization, and integration, this caused a relatively heavy cognitive load yet improved problem solving performance. Furthermore, text hints were a better
resource for complex linguistic information than transient audio hints. We also discuss limitations of the current study, which may have led to results contrary to Mayer’s modality principle in some respects, but consistent with it in others.
viii
Table of Contents
List of Figures ... xi
List of Tables ... xiii
Acknowledgements ... xv
Dedication ... xvi
Chapter 1 - Introduction ... 1
Background and Motivation ... 2
Research Questions ... 5
Organization of Dissertation ... 6
Chapter 2 - Multimedia Hints Improve Problem Solving Performance ... 7
Introduction ... 7 Theoretical Background ... 9 Significance of Study ... 16 Method ... 17 Participants ... 17 Materials ... 17
Multimedia Hint Design ... 19
Testing Hypotheses ... 24
Experiment Procedure ... 28
Results and Analysis ... 29
Scoring Procedure ... 29
Initial and Transfer Task Performances ... 30
Training Task Performances ... 33
Pairwise Comparisons for Hypotheses ... 34
Discussion ... 38
Reverse Modality Effect ... 38
Questioning the Dual-Channel Assumption ... 40
Mayer’s CTML and Wickens’ MRT ... 41
Chapter 3 - The Effect of Multimedia Hints on Participants’ Eye Movements... 42
ix
Theoretical Background ... 43
Eye-tracking Studies on Multimedia Learning ... 43
Cognitive Load Theory and Measurement of Eye Movements ... 45
Multiple Resources Theory and Multitask Performance ... 50
Significance of Study ... 51
Method ... 52
The Eye-Tracking Technology ... 52
Testing Hypotheses ... 54
Hypotheses Regarding Domain Relative Ratios Comparisons between Conditions ... 54
Hypotheses Regarding Mean Fixation Duration Comparisons between Conditions ... 56
Results and Analysis ... 59
Evidence of Split Attention ... 59
Mean Fixation Duration ... 66
Discussion ... 70
Attention while Hints are Presented ... 70
Cognitive Load during Problem Solving ... 79
Chapter 4 - A Model of Physics Problem Solving with Multimedia Hints ... 85
Introduction ... 85
Theoretical Background ... 85
Theories of Problem Solving ... 85
Cognitive Theory of Multimedia Learning (CTML) ... 88
Multiple Resources Theory ... 89
The Effects of Hints ... 91
Model of Working Memory ... 94
Models of Student Thinking in PER ... 97
Significance of Study ... 100
The Model ... 100
Analysis and Discussion ... 104
A Summary of Results of Data Analysis ... 104
The Effect of Presenting A Single Hint on Problem Solving Performance ... 105
x
The Effect of Presenting Multimedia Hints on Eye Movements ... 114
Limitations of the Model ... 116
Chapter 5 - Conclusions ... 118
Overview of Research ... 118
Overview of Theory and Method ... 119
Addressing Research Questions ... 119
Research Question 1 ... 119
Research Question 2 ... 120
Research Question 3 ... 121
Limitations and Future Work ... 122
Anticipated Boarder Impacts ... 124
References ... 125
Appendix A - Problems Investigated ... 140
xi
List of Figures
Figure 2-1 An example of an initial, training, near transfer, and far transfer task (from the top to the bottom) from the Ball task set. ... 18 Figure 2-2 Examples of training tasks with visual hints and text hints superimposed from the
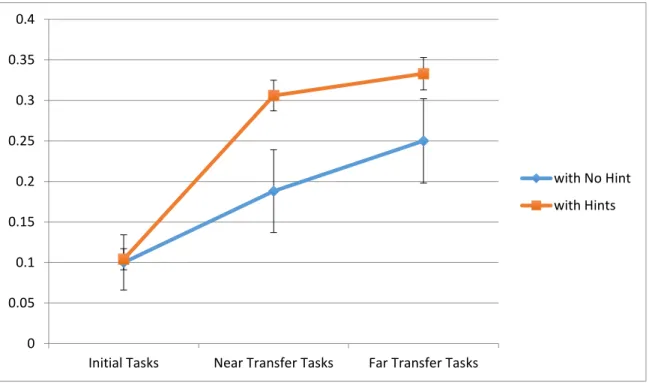
Skier (top), Roller Coaster, Graph, and Ball (bottom) task sets. All hints appeared on screen for a total of eight seconds at a time. ... 20 Figure 2-3 Initial task performance, near transfer task performance, and far transfer task
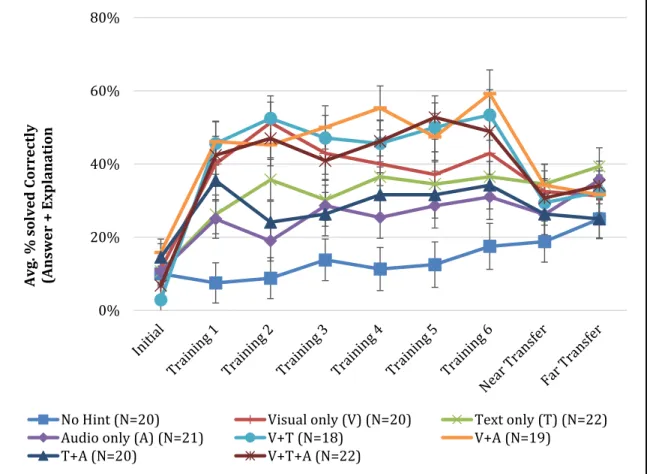
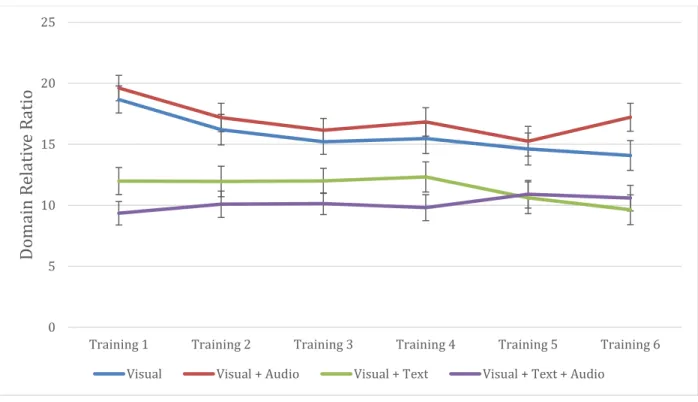
performances of no hint condition and hit conditions. Error bars represent ±1 std. error of the mean. ... 33 Figure 2-4 Average participant performance averaged across all task sets. Error bars represent ±1 std. error of the mean. ... 34 Figure 3-1 An example of drawing visual hint AOI and text hint AOI in a slide with hints. ... 54 Figure 3-2 The domain relative ratios on the visual hint AOI on the training tasks. Error bars
indicate ±1 standard error of the mean. ... 60 Figure 3-3 The training task solving performances of visual, visual + audio, visual + text, and
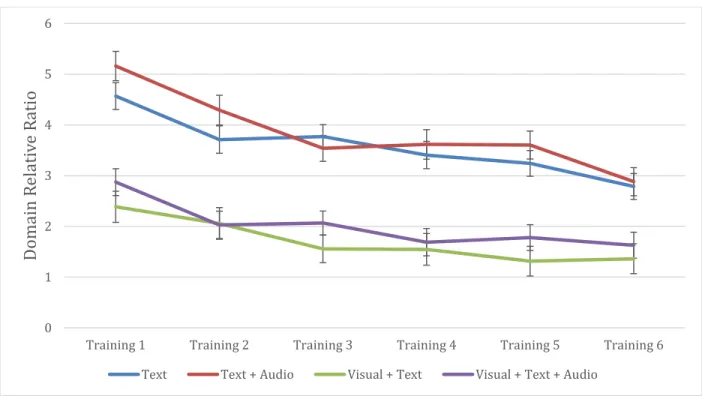
visual + text + audio conditions. Error bars indicate ±1 standard error of the mean. ... 60 Figure 3-4 The domain relative ratios on the text hint AOI on the training tasks. Error bars
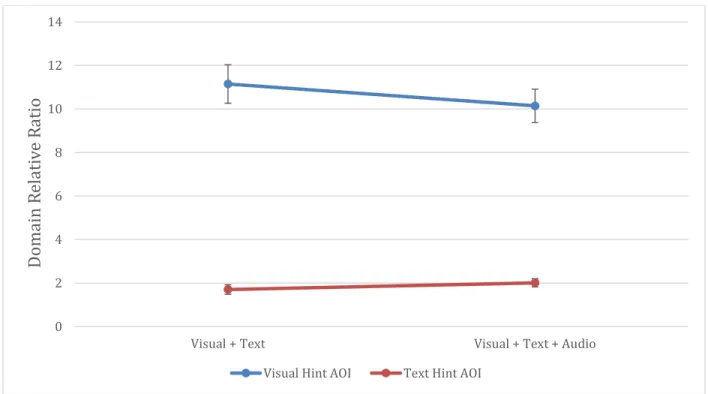
indicate ±1 standard error of the mean. ... 63 Figure 3-5 The training task solving performances of text, text + audio visual + text, and visual + text + audio conditions. Error bars indicate ±1 standard error of the mean. ... 63 Figure 3-6 The domain relative ratios on the text hint AOI and the visual hint AOI. Error bars
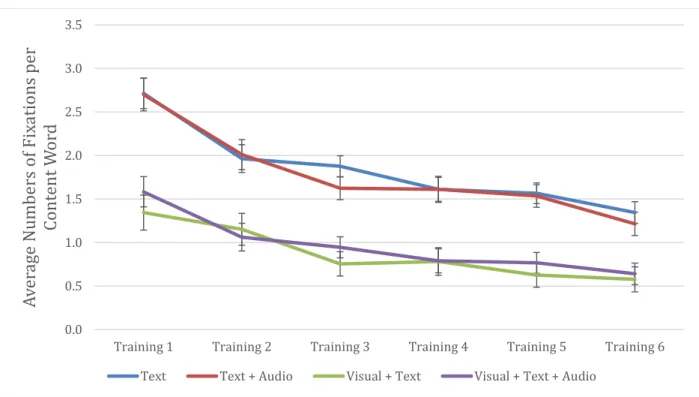
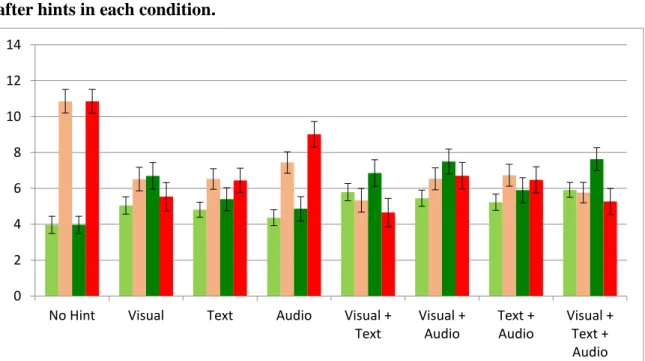
indicate ±1 standard error of the mean. ... 66 Figure 3-7 The numbers of fixations per text hints’ content word. Error bars indicate ±1 standard error of the mean. ... 71 Figure 3-8 The domain relative ratios on Expert AOI and Novice AOI before hints and after hints
in each condition. ... 76 Figure 3-9 An example of drawing expert AOI and novice AOI in a slide of a ball task. ... 77 Figure 3-10 The expert index in each condition. ... 78 Figure 3-11 The ratios of mean fixation durations on all seven conditions with hints. Error bars
xii
Figure 4-1 Cognitive theory of multimedia learning (Mayer, 2002) ... 88
Figure 4-2 Four-dimensional model of multiple resources. The fourth dimension (visual processing) is within the dimension of visual resources (Wickens, 2002). ... 90
Figure 4-3 The model of working memory (Baddeley, 2002) ... 97
Figure 4-4 A model of problem solving with the concepts from RCT (Ohlsson, 1992) and CTML (Mayer, 2002). ... 100
Figure 4-5 A model of problem solving with multimedia hints. ... 102
Figure 4-6 A model of problem solving with visual hints ... 106
Figure 4-7 A model of problem solving with text hints ... 107
Figure 4-8 A model of problem solving with audio hints ... 108
Figure 4-9 A model of problem solving with visual + text hints. ... 111
Figure 4-10 A model of problem solving with visual + audio hints. ... 112
Figure 4-11 A model of problem solving with text + audio hints ... 113
Figure 4-12 A model of problem solving with visual + text + audio hints. ... 114
Figure 5-1 The dwell time on the visual hint AOI on the training tasks. Error bars indicate ±1 standard error of the mean. ... 160
Figure 5-2 The dwell time on the text hint AOI on the training tasks. Error bars indicate ±1 standard error of the mean. ... 161
Figure 5-3 The dwell time on the text hint AOI and the visual hint AOI. Error bars indicate ±1 standard error of the mean. ... 162
xiii
List of Tables
Table 2-1 Research-based principles for multimedia instruction design by Mayer (2005) ... 11 Table 2-2 Nine pairs of comparison on testing Mayer’s CTML and Wickens’ model and the
predicted results ... 27 Table 2-3 Inter-rater Reliabilities for all task sets in all eight conditions ... 30 Table 2-4 Average correct solving percentages with std. error on initial tasks, near transfer tasks, and far transfer tasks over all four task-sets in all eight conditions ... 30 Table 2-5 Average correct solving percentages with std. error on each training tasks over all four task-sets in all eight conditions ... 31 Table 2-6 Nine hypotheses and corresponding pairwise comparisons with statistical results ... 37 Table 3-1 The F values and p values of comparing the domain relative ratio on the visual hint
AOI between visual condition, visual + text condition, visual + audio condition, and visual + text + audio condition for each training task. ... 61 Table 3-2 The p values from pairwise comparisons with Bonferroni correction on the domain
relative ratio on visual hint AOI between conditions for each training task... 61 Table 3-3 The p values from pairwise comparisons with Bonferroni correction on the domain
relative ratio on text hint AOI between conditions. ... 64 Table 3-4 The p values from pairwise comparisons with Bonferroni correction on the domain
relative ratio on text hint AOI between training tasks. ... 64 Table 3-5 The mean fixation duration before hints, during hints, and after hints (in milliseconds).
... 67 Table 3-6 The p values from pairwise comparisons on the mean fixation duration during hints
with Bonferroni correction. ... 68 Table 3-7 The p values from pairwise comparisons on the mean fixation duration after hints with Bonferroni correction. ... 68 Table 3-8 Four hypotheses of domain relative ratios and corresponding pairwise comparisons
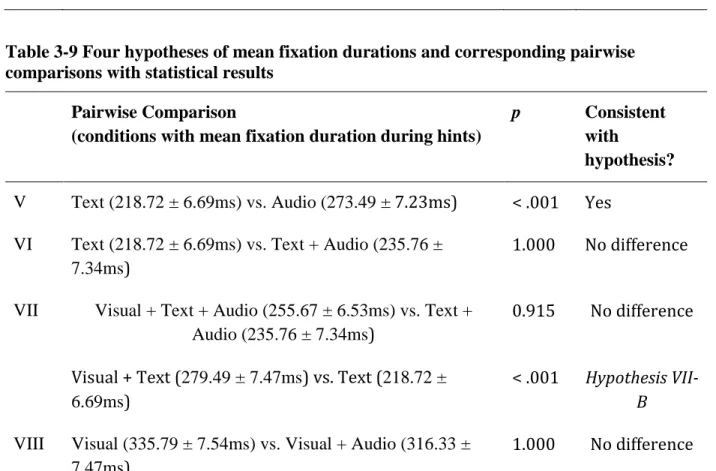
with statistical results ... 69 Table 3-9 Four hypotheses of mean fixation durations and corresponding pairwise comparisons
xiv
Table 3-10 The p values from pairwise comparisons with Bonferroni correction on the average
numbers of fixations per content word of text hints between conditions. ... 72
Table 3-11 The p values from pairwise comparisons with Bonferroni correction on the average numbers of fixations per content word of text hints between training tasks... 72
Table 3-12 The means and standard errors of expert index and the means and standard errors of percentage of correct rate in each condition. ... 77
Table 3-13 The p values from pairwise comparisons with Bonferroni correction on the Expert Index between conditions. ... 79
Table 3-14 The linguistic hints and numbers of relevant elements on each task set. ... 82
Table 5-1 The Skier task set... 140
Table 5-2 The Ball task set ... 144
Table 5-3 The Roller Coaster task set ... 149
Table 5-4 The Graph task set ... 153
Table 5-5 The F values and p values of comparing the dwell time on the visual hint AOI between visual condition, visual + text condition, visual + audio condition, and visual + text + audio condition for each training task. ... 160
Table 5-6 The p values from pairwise comparisons with Bonferroni correction on the dwell time on visual hint AOI between conditions for each training task. ... 160
Table 5-7 The F values and p values of comparing the dwell time on the text hint AOI between visual condition, visual + text condition, visual + audio condition, and visual + text + audio condition for each training task. ... 161
Table 5-8 The p values from pairwise comparisons with Bonferroni correction on the dwell time on text hint AOI between conditions for each training task. ... 162
xv
Acknowledgements
I would like to thank my advisor, Dr. N. Sanjay Rebello, for his guidance and support. He opened a door for me and took me as a graduate student when I needed it most. I am also grateful to Dr. Lester Loschky and Dr. Brett DePaola. Dr. Lester Loschky’s mentorship in the visual cognitive aspects of this project was essential, and Dr. Brett DePaola provided me much valuable advice, both in research and in general. I also want to thank the other members of my committee: Dr. Andrew Bennett, Dr. Jeremy Schmit, and Dr. Heather Bailey. Many thanks to John Hutson and Zac Throneburg who provided critical technical support for both experimental setup, data collection and data analysis. Thanks are also due to my fellow graduate students Tianlong Zu and Bahar Modir who helped me with data collection.
This study is supported in part by U.S. National Science Foundation grant 1348857. Opinions expressed are those of the authors and not necessarily those of the Foundation.
xvi
Dedication
To my parents.In memory of my grandparents:
Yishen Wu (August 25, 1919 – May 17, 2001) Yahui Zhang (August 30, 1921 – August 25, 2006) Youxin He (May 14, 1924 – March 12, 2013)
1
Chapter 1 - Introduction
Physics Education Research (PER) has a long tradition of research on understanding student thinking (McDermott, 2001; Redish, 2004; Docktor and Mestre, 2014). Since the beginning, PER as a research domain, has expanded and developed into several different
subfields. Among those subfields, physics problem solving is one of the most important subfields (Hsu, et. al., 2004; Adams and Wieman, 2015).
As a starting point, the definition of what we deem as a “problem” needs to be clarified. Several different problem types have been addressed in research: end-of-chapter problems (Chi and VanLehn, 1991), authentic problems (AAAS, 2011; Gormally et al., 2012), complex problems (Goldenfeld and Kadanoff, 1999), context rich problems (Heller and Hollabaugh, 1992) and many others. Three aspects of physics problem solving are analyzed most frequently: cognitive processes, content knowledge, and mathematics strategies. We are interested in the cognitive aspect; especially the difficulties students have with building and shifting their mental representation of the problem during problem solving. Therefore, in the study presented in this dissertation, we adopt Jonassen’s (2011) definition on problems: “question or issue that is uncertain and so must be examined and solved” (pp. 1). Due to the diversity of problem definitions, we use the term “problem” and “task” interchangeably in this dissertation.
A physics education researcher is not only a scientific researcher, but also a science educator. There are lots of efforts devoted in helping students solve physics problems. Both the content and the modality of the hint information provided to assist the learner in solving the problem could affect the effectiveness of the hint. In our everyday life, we use pictures, videos, text, and speech to communicate our ideas. How can we apply these modalities to help our students learn, and how can we assess the learning outcomes? Moreover, can we model the
2
interactions between learners and the information in different modalities? Also, how can we use these insights to facilitate problem solving? These are critical questions that do not yet have satisfactory answers.
Physics education researchers typically rely on observations, surveys, tests, and
interviews to measure student thinking and learning outcomes. It is difficult to gain insights into students’ perception and cognition using these tools. A student’s brain is typically a black box to physics education researchers, and its functioning can only be inferred by the input and output. Now, with the advent of technology it is possible to directly measure the gestures, facial expressions, eye movements, and brain activity of students. In this dissertation, we discuss a study on physics problem solving with multimedia hints using eye-tracking technology. The study utilizes eye movements as an important source of insight with regard to student thinking, and in conjunction with their performance on problem solving tasks. In this chapter, we begin with the motivation for this study. Then we will discuss the research questions, research approach, and the organization of the dissertation.
Background and Motivation
The studies presented in this dissertation were motivated by eye movement studies on problem solving (Knoblich, et al., 2001; Grant and Spivey, 2003; Thomas and Lleras, 2007). Knoblich et al. (2001) used the results of eye movement data analyses to support Ohlsson’s (1992) problem solving model: Representational Change Theory (RCT). The studies conducted by Grant and Spivey (2003) revealed the connection between eye movement and cognition during problem solving with pictorial information. Solvers’ eye movements indicated how solvers considered the problem. Further, Thomas and Lleras found (2007) guiding solvers’ eyes to attend the area of diagram where directly related to correct answer could improve
problem-3
solving performance. These studies opened a new window for researchers who are interested in problem solving, and they inspired our group’s eye movement studies on physics problem solving on many aspects. First, we adopted Ohlsson’s RCT as the theoretical framework of problem solving. Second, the eye-tracking technology was introduced to grant us insights concerning the process of solving physics problems. These two aspects will be elaborated on in the later sections of this dissertation. We designed a set of physics tasks with pictorial
information. There were two distinct areas on each picture. The first, was associated with a well-documented incorrect answer, and the second, was associated with the correct answer. We measured students’ problem solving performance and eye movements. In the previous study (Madsen, et. al., 2012; 2013), we found that student’s overt visual attention was correlated with student’s prior knowledge. In other words, the correct solvers attended to the correct answer areas more than the incorrect solvers did, and the incorrect solvers attended to the incorrect answer areas more than the correct solvers did. This raised the question as to whether or not guiding students to attend toward the correct answer areas would help them solve the problem correctly. The following study (Rouinfar, 2014) demonstrated that this was indeed the case. The students with both visual cues and feedback solve the training and transfer problems significantly better than all the other conditions. Next, a theoretical effort was devoted by Agra’s study
(2015). The measure of confidence and delayed transfer task solving performance have been adopted along with the eye movement data to explore the mechanism of mental representation change in physics problem solving.
All of the previous studies used visual cues to facilitate changes in student thinking while solving problems. However, visual cues are not the only type of help information. Compared to visual cues, linguistic hints are more explicit. Therefore, we would like to include the linguistic
4
hints in our study. We assess the effectiveness of all three modalities of hints: visual, audio, and text, and all possible combinations. Presenting hints via multiple modalities allows us to step into the world of multimedia. A rich body of research on multimedia instruction and multimedia learning has provided both experimental evidence and theoretical framework for understanding learning on multimedia instruction and guiding multimedia instruction design. Mayer’s
Cognitive Theory of Multimedia Learning (CTML, Mayer, 2002), is the theory that has been continuously tested in many different disciplinary domains and contexts, and has demonstrated positive results in most of the cases.
Mayer’s CTML has two major implications. First, it provides theoretical explanation in regard to the cognitive process of multimedia learning. Second, it generates a set of principles to guide multimedia instructional design. Both aspects shed light on the studies presented in this dissertation. The theory aspect of CTML provides us the theoretical foundation for
understanding perception of multimedia material. The design principles of CTML polish our multimedia material design (not sure what this sentence means). Some of these principles are used to help generate hypotheses toward studying the performance of problem solving. We investigate if (1) linguistic hints are a superior resource of help information than visual hints in physics problem solving, (2) linguistic hints could assist visual hints in being more effective at helping physics problem solving, (3) sending the identical linguistic information via different modalities would affect physics problem solving. This was the motivation for Research Question 1 of this study.
Further, we want to know how students attend to multi-modality hints. This is an
exploration of students’ eye movements. As reviewed in the previous paragraph, the connection between cognitive processes and visual attention is evident in studies of the eye movements
5
during problem solving. Our group’s previous studies also relied on the evidences from eye movement study to reveal part of the cognitive process of physics problem solving. Building upon these results, we hope to conduct a study to understand the connection between perceiving hints and visual attention. This motivates Research Question 2 of this study.
Research Question 1 focuses on “what” modalities of hints facilitate students to solve conceptual physics tasks with pictorial representation. Research Question 2 focuses on “why” certain types of hint modalities are more effective than others at facilitating problem solving. Finally, Research Question 3 addresses “how” different modalities of hints facilitate problem solving. With the results of two previous research questions, we model students’ cognitive processes of conceptual physics problem solving with multimedia hints. The model could be used to explain physics problem solving and guide the design of physics instructional materials. This motivates Research Question 3.
Research Questions
The overarching question of this study is to explore the effect of multimedia hints on physics problem solving. Specifically, we want to answer three research questions.
1. How does the combination of visual, text, and audio hints affect students’ performance on solving introductory conceptual physics tasks with graphic representation?
2. How does hint modality influence students’ visual attention?
(a) How does hint modality affect the cognitive load during problem solving? (b) How does simultaneously presenting multi-modality hints split students’ visual
6
3. What theoretical model can explain how multi-modality hints influence both students’ problem solving performance and their visual attention while solving conceptual physics tasks?
Organization of Dissertation
The major thrust of this dissertation, an eye-tracking study of physics problem solving with multimedia hints, contains two sub-studies. Chapter 2 discusses the effect of multimedia hints on problem solving performance. Participant problem solving performances on initial tasks, training tasks, and transfer tasks were analyzed. We found hint modality affected participant performance on solving training tasks. This finding motivated the second sub-study, which is described in Chapter 3. This sub-study focused on participant eye movement data. Two
categories of eye movement data were included: one is the domain relative ratio, and another is the mean fixation duration. The domain relative ratio is the measure of visual attention
distribution, and the mean fixation duration indicates the real-time mental effort. We found evidence from our eye movement study to support our finding from the study of participant performance. Chapter 4 assembles the experimental evidence from two sub-studies and the theoretical frameworks of multimedia learning, problem solving, and working memory together to construct a theoretical model of physics problem solving with multimedia hints. This model provides a coherent explanation of results of both the problem solving performance and eye movement data, and generates a set of hypotheses to guide future studies. Chapter 5 provides a summary of the results of the previous chapters. It shows how research questions have been addressed by these results and discusses the possible implications of the study, and offers suggestions for future work.
7
Chapter 2 - Multimedia Hints Improve Problem Solving
Performance
Introduction
Problem solving is regarded as one of the critical skills of learning physics and has been investigated by the PER community for decades (Hsu, et al., 2004; Adams and Wieman, 2015). There are several studies (Chi et al., 1981; de Jong and Ferguson-Hessler, 1986; Hardiman et al., 1989) showing that it is very difficult for novices to solve physics problems. Physics problems often have pictorial information. Therefore, it is important for us as physics educators and PER researchers to understand how to facilitate learners to solve physics problems that include pictorial representations.
Previously, we studied the effects of visual cueing and feedback on physics problem solving (Rouinfar, 2014). That study included 90 participants that were randomly assigned in a 2 (cue/no cue) × 2 (feedback/no feedback) design. Each participant was asked to solve tasks from four task sets, whose order was also randomized. Each task set has one initial task, six training tasks presented to participants in a random order, and one transfer task. The participants who were in a cued condition were provided a visual cue as they solved each training task. The cues were shapes or lines superimposed on the diagram that would direct the task solvers’ attention to relevant features in the task in a way that would facilitate them to solve tasks. Participants in the feedback condition were told whether their responses (answers and reasoning considered
together) were correct or incorrect after they responded to an interviewer. Results showed that the participants who received both visual hints and feedback (cue + feedback condition), had a significantly higher performance than the other conditions on the training tasks as well as the transfer tasks across all task sets.
8
Rouinfar’s study (2014) had two limitations, both pertaining to the ecological validity of the study. First, the feedback was provided by a human interviewer. This is inconsistent with hints administered in the context of computer-aided instruction, where hints would be provided automatically based on learners’ responses. Second, the study did not explore the use of other modalities, in addition to the visual modality, which would be relevant in multimedia-based computer aided instruction. While the first limitation is currently being investigated in a different study, the study described in this dissertation addresses the second limitation.
In this study, we focus on the effect of multimedia hints. Rather than purely visual cues used in the Rouinfar (2014) study, we tested the effect of hints provided using textual and auditory modalities. The existing theoretical guidelines for multimedia instruction design are adopted from Mayer’s (2002) CTML and Wickens’ (2002) Multiple Resources Theory (MRT). These two theories draw a map describing how learners perceive and understand external information that is presented in visual and auditory modalities. CTML proposes principles that could potentially guide the development of content for computer-aided instruction, especially with regard to the appropriate modalities and combinations thereof. MRT predicts task
performance in the dual-task scenario, i.e., the scenario that humans are engaging multiple tasks simultaneously. There have been numerous studies that have tested each of the principles of Mayer’s CTML and Wickens’ MRT. These two theories have also been used to guide the development of online learning environments to facilitate physics learning (Sadaghiani, 2011; Salim, et al., 2012) and the optimization of human-machine interaction (Stork, et al., 2008). But, to date, there are no published studies in which these theories have been tested in the context of physics problem solving. Therefore, our current research investigates the applicability of CTML and MRT for helping learners solve conceptual physics problems.
9
Theoretical Background
Generally speaking, the design of computer-assisted instruction reflects the designer’s understanding of the user’s learning process. The underlying hypothesis of studies around computer-assisted instruction design is that the content and representation of the instruction should fit the user’s learning mechanism (Leahy et al., 2003; Kirschner et al., 2006; Smith, 2006; Pashler et al., 2007). According to Mayer’s CTML (2002), there are three theoretical
assumptions that underpin human interaction with multimedia instruction. Below, we describe each assumption in detail.
The first assumption in CTML is the dual-channel assumption, which states that leaners have two separate systems to process pictorial and verbal information. In his theory, Mayer (2002) adopted the sensory-modalities approach to differentiate the visual and auditory channels. This approach categorized the human information processing system into two channels
according to the modality of sensory input, i.e., vision and hearing. The two channels, therefore, are the visual channel and the auditory channel. Material presented to learners’ eyes, such as pictures, animations, and on-screen text, are processed through the visual channel, and material presented to the learner’s ears, such as narration, music and other sounds, are processed through the auditory channel. The second assumption is the limited capacity assumption, which assumes that the capability of processing material for each channel is limited. If the amount of material presented to one channel exceeds this channel’s capability, the material could not be processed through this channel appropriately. This assumption is consistent with Sweller’s cognitive load theory (Sweller, 1988; Chandler and Sweller, 1991; Sweller, 1999). The third assumption is active-processing assumption. It is a fundamental assumption that emphasizes the necessity of cognitive processing in learning.
10
Wickens’ MRT (2002) provides another perspective of the interaction between learners and multimedia instruction. While CTML considers the modality (visual and audio) of the incoming information, MRT considers both how the information is coded (using spatial and verbal resources) as well as the modality (visual and audio) of presentation. Moreover, MRT also considers the stages (perception, cognition, and responding) of processing. While information received from the two modalities is separated in the perception stage, the distinctions between the two modalities do not exist in the cognition and responding stages of processing.
Wickens’ MRT proposes an explanation of how humans process information while simultaneously engaging with multiple tasks. The main idea of MRT is that performance on tasks is negatively impacted if the multiple tasks share the same codes or modalities. For
example, comparing talking on a hands-free phone while driving, versus texting, the latter would have a greater effect on driving ability, since texting and driving share the visual modality. Wickens’ model provides another point of view for Mayer’s dual-channel, and limited capacity assumptions.
These assumptions together serve as the foundation for generating twelve major principles in designing multimedia instruction (Mayer, 2005b). See Table 2-1, for a brief explanation of each principle. This study is focused on testing the Multimedia Principle, the Signaling Principle, the Redundancy Principle, and the Modality Principle in the context of physics problem solving. Most of the rest of the principles were used in the design of the multimedia hints that will be described in subsequent sections.
11
Table 2-1 Research-based principles for multimedia instruction design by Mayer (2005)
Principle Description: People learn …
Multimedia better when pictorial and linguistic information are presented together, rather than when linguistic information is presented alone.
Spatial Contiguity better when corresponding pictures and words are near each other than when they are far away.
Temporal Contiguity better when corresponding pictures and words are presented simultaneously than successively.
Coherence better when presented pictures and words are related with each other than when they are unrelated.
Segmenting better when instructional material is presented in segments that can be played by the user at their chosen rate.
Personalization better when familiar language rather than formal, unfamiliar language is used.
Voice better when the narration is in a familiar human voice, rather than in an unfamiliar machine voice
Image the same regardless of whether or not the image of the speaker appears in multimedia instruction
Pre-Training better when they have prior knowledge of the main concepts presented in instruction
Signaling better when visual cues are used to highlight the organization of the material
Redundancy better with animation and narration, rather than with animation and narration and text together.
Modality better with auditory information, than with on-screen texts .
The multimedia principle was based on a study that investigated what kinds of
illustrations can better improve learning from expository passages (Mayer and Gallini, 1990). Recently, the term multimedia has been used more broadly. It could include different
12
combinations of pictures and texts or pictures and auditory content. There are studies that showed presenting visual and linguistic information together could improve retention (Mayer, 2002), deepen understanding (Tabbers, et al., 2004; Cuevas et al., 2002) and aid in problem solving (Hoffler and Leutner, 2007). The benefit for retention can be explained by the dual-channel and limited capacity assumptions of CTML. Pictorial and linguistic information, are coded in parallel to benefit memorization of that information. This is also consistent with Wickens’ MRT. Pictorial information is processed using the spatial resource, and linguistic information is processed by the verbal resource, therefore they do not interfere with each other. Consequently, the combination of visual and audio information will facilitate learning better than the combination of visual and textual information, because visual processing might be
overloaded when pictorial and textual information are presented together, which can lead to competition for attention in the visual channel (Mayer, 2002). However, the reason why pictorial information also seems to help with deeper understanding and problem solving is still not clear (Butcher, 2014).
The signaling principle emphasizes the advantage of visual representation. Unlike the multimedia principle, which addressed the question of how to improve learning from text, the signaling principle focuses on how to improve learning from pictures. It is also known as the cueing principle. This principle is related to active-processing and limited capacity assumptions. According to the former, humans are active processors of information that always try to
understand incoming information that they receive through their senses. Providing signals or cues can help the human brain select and organize the incoming information to avoid possible processing channel overflow, since each channel only has limited processing capacity. Our group’s previous studies have addressed this principle in the physics problem-solving domain.
13
Madsen found that visual cues could draw participants’ visual attention to specific regions of diagrams and improve the problem solving performance (Madsen, et al., 2013). This finding was replicated in Rouinfar’s study with 2 (cue / no cue) × 2 (feedback / no feedback) design
(Rouinfar, 2014).
Before the development of Mayer’s CTML (Mayer, 2002), the redundancy principle for multimedia learning was used by Kalyuga et al. (1999). Simply put, the principle can be defined as: less is better. In Mayer’s theory, this means that in the presence of animation, learning from text and narration together is less effective than learning from narration alone. This principle is directly connected to the dual-channel and limited capacity assumptions. On-screen text and animation presented simultaneously may force the learner to split their attention. The split attention may result in insufficient capacity to process presented information. However, when there is no on-screen text, narration and animation can be processed by the learner through the visual and auditory channels separately. The capacity of each channel will be the sum of the two, and give the learner more opportunity to attend to the presented information. The redundancy principle can also be explained by Wickens’ MRT. Both text and narration need processing of verbal resources. Presenting information simultaneously via text and audio can cause
interference in processing of verbal information.
Several studies have tested the redundancy principle and the results of these studies are mixed. Craig et al. (2002) found that the redundancy principle cannot be washed out when the text is presented close to an animation, and with an on-screen agent. The principle has also been verified in computer science teaching (Rias and Zaman, 2010) and music theory teaching (Aldalalah and Fong, 2010). Mayer and Johnson’s study (2008) showed that learners might use brief on-screen text as guidance to enhance their learning. They suggested three theoretical
14
reasons for this result. First, short on-screen text presents a smaller cognitive load in the visual channel than longer on-screen text; second, presenting on-screen text close to the corresponding figure helps the learner attend to key information more effectively than on-screen text that is far from the corresponding figure; third, on-screen text is more effective with static figures than animation.
Some studies have demonstrated a reverse redundancy effect, namely that learning from text and narration together is more efficient than learning from narration alone. Toh et al. (2010) found the reverse redundancy effect in their study of English reading comprehension. In their study, the learners who received an instructional presentation with static pictures, narration, and synchronized on-screen text, outperformed the learners who received the instructional
presentation with static pictures and narration only. They suggested that their learner-paced presentation and synchronized on-screen text, which is proximal to the relevant picture, “cue the learner to the learning task” (pp. 995). Instead of hindering learning, on-screen text helped the learner select, organize the presented information, and integrate it with prior knowledge to achieve active learning (Mayer, 2002). In a recent study, Yue et al. (2013) focused on the relationship between the format of on-screen text and the effect of redundancy and reverse redundancy with the content of an astronomy instructional presentation. They found that the short on-screen text actually could help the learner better learn the presented content. However, if the difference between on-screen text and narration was increased, such as by using synonyms to replace narrated words or changing sentence structure, the short on-screen text would be as ineffective as the full text or narration.
The modality principle in CTML states that narration presented simultaneously with pictorial information is easier for the user to learn from and retain than on-screen text with
15
pictorial information (Mayer, 2002; Low and Sweller, 2005). This principle can also be
explained by dual-channel and limited capacity assumptions. Pictorial information is processed through the learner’s visual channel. If textual information is presented to the leaner’s visual sensory system simultaneously with pictorial information, it can cause huge cognitive load and may cause processing difficulties. However, if there were narrated information presented to a learner’s auditory sensory system, it can be processed via the learner’s auditory channel. So, narrated information is easier for a learner to attend to simultaneously with pictorial information. This is also consistent with Wickens’ MRT. The interference between on-screen text and
pictorial information is much larger than the interference between narration and pictorial information, since on-screen text and pictorial are all presented in the visual modality. This interference can hinder learning.
The results of studies around the modality principle are also mixed. Schmidt-Weigand and co-workers tested a modality effect with German university students (Schmidt-Weigand et al., 2010b). They showed that students who received spoken text tended to remember the content better than students who received on-screen written text. On the other hand, Harskamp et al. (2007) tested the modality principle in an authentic biology classroom with secondary school students. Their results showed that the modality effect was washed out if students were allowed to control the pace of instruction, and allowed to review the material later. Specifically, students who needed less learning time performed better with pictures and narration instruction while students who needed more learning time performed better with pictures and text
instruction. Harskamp et al. (2007) suggested that the modality effect might be valid only in a fast paced learning environment, but not necessarily in a self-paced learning environment. Stiller et al. (2009) probed the interaction between pacing effect and modality effect. They recruited
16
college students to watch instructional materials about the human eye and administered a pretest and posttest on the material. The experiment showed that the narration condition significantly outperformed the on-screen text condition for system-paced presentations, while the on-screen text condition significantly outperformed the narration condition for learner-paced presentations. There was no significant difference in posttest performance between the conditions in system-paced presentations. But, since the learners in the self-system-paced condition spent less time than the learners in the narration condition, the authors suggested that on-screen text with a learner-paced system might be the best for knowledge retention.
Significance of Study
In summary, the principles of Mayer’s CTML have been widely used as guidelines in the creation of multimedia learning materials. However, there appears to be no clear consensus in the literature with regard to evidence in support of the redundancy and modality principles.
Moreover, CTML principles have not been tested in the context of conceptual physics problem solving. With the increasing prevalence of computer tutors and multimedia learning systems in physics education, we believe that it is important for the field to examine the applicability of these principles in the design of the systems.
This study is a first small step toward a broader investigation of the applicability of the principles of multimedia learning to physics problem solving, especially the redundancy and modality principles. The scope of this study is confined to the use of multimedia hints in conceptual physics problems that have a diagram. The study builds on our previous work on visual cueing (Rouinfar, 2014) and incorporates other modalities of hints such as textual and audio hints used in conjunction with each other as well as with visual hints.
17
The overarching research question of this study is: How does the modality of multimedia hints provided on conceptual physics tasks affect students’ performance on these tasks and on subsequent transfer tasks on which no hints are provided?
Method
Participants
The participants (N = 162) in this study were recruited from conceptual physics courses at a mid-western university. Most of them are sophomores and juniors. Vast majorities (> 80%) of these students were future elementary teachers, and vast majorities (> 90%) of them were female. Very few of these students (< 10%) had any prior physics class in high school and none of the students had a prior college physics class. As incentive for participation in the study, most participants were given extra credit equivalent to 1% of the course grade for participating in the one-hour long interview. There were ten participants compensated with cash. The students were recruited via email and were provided a link that they could use to sign up for the interview at a convenient time.
Materials
Each participant solved four sets of conceptual tasks in the interview. Similar to the sets used in our previous work (Rouinfar, 2014), we name each of these after the main object in the task -- Ball, Graph, Skier and Roller Coaster. Each set had one initial task, six training tasks, one near transfer task and one far transfer task. Each of the training tasks differed from the initial task only in terms of surface features, and not in terms of deep structure, in that they had the same physics concept and the same representation, only a minor change in the details of the situation. The tasks were presented to participants with multimedia hints that will be discussed in detail in the following two sections. The near transfer task was designed based on the same
18
physics concept and representation but in a different context. The far transfer task was again based on the same physics concept and representation, but the context was substantially different from the context of the training and near transfer tasks. See Figure 2-1 for examples of the initial, training, near transfer and far transfer tasks. The topics relevant to the tasks were kinematics and energy conservation, which had been covered in lecture prior to the recruitment of students. All of the sets were used in previous studies and they showed that correct solvers and incorrect solvers look at training tasks and near transfer tasks significantly differently when only the visual hint was provided to participants (Rouinfar, 2014). In our current study, we added the far transfer task following the near transfer task in each set to test whether different hint modalities would affect learners’ performance on a far transfer task differently. As a part of our experimental design, we randomized conditions as explained in the following two sections. We also randomized the sequence of sets, and the sequence of training tasks within each set.
Figure 2-1 An example of an initial, training, near transfer, and far transfer task (from the top to the bottom) from the Ball task set.
Two balls roll along the paths shown. A snapshot of the position of the balls is taken every second. At what point in time does Ball B have the same speed as Ball A?
19
Two balls roll along the paths shown. A snapshot of the position of the balls is taken every second. At what point in time does Ball B have the same speed as Ball A?
Ball A begins riding downward in an elevator at the same time Ball B is dropped from the roof of an adjacent building. A snapshot of the balls is taken every second. At what point in time does Ball B have the same speed as Ball A?
A runner runs along a track. The following diagram, viewed from above, shows the position of the runner at each second. At which point in time is the runner moving the fastest?
Multimedia Hint Design
The goal of this study was to test the effect of different modalities of multimedia hints on students’ performance on conceptual physics tasks. Specifically, we wanted to test the effects and interactions between text hints, audio hints, and visual hints. We used a full factorial design:
20
2 (visual hint / No visual hint) × 2 (text hint / No text hint) × 2 (audio hint / No audio hint). Participants were randomly assigned to one of the eight conditions. Participants in each condition received hints with different modalities when they solved the training tasks, such as text only, audio only, visual only, visual + text, visual + audio, text + audio, and visual +text + audio, or no hints. Participants were not provided with any hints on the initial, near transfer, or far transfer tasks in any of the conditions.
We adopted visual hints from our previous study and the more detailed explanation of these hints can be found there (Rouinfar, 2014). In short, the visual hint for each training task is eight-seconds long in time, highlighting the area of the task diagram that is related to the correct answer. For example, the highlighting patterns of Figure 2-2 are an example of a visual hint.
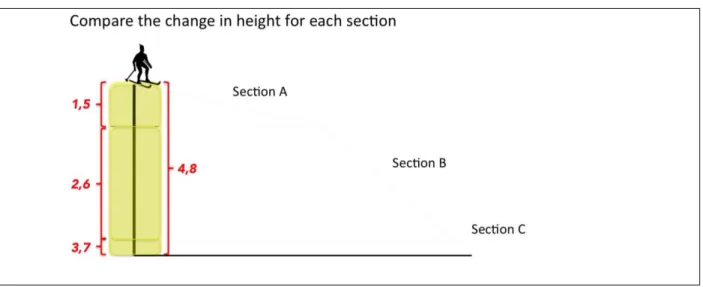
Figure 2-2 Examples of training tasks with visual hints and text hints superimposed from the Skier (top), Roller Coaster, Graph, and Ball (bottom) task sets. All hints appeared on screen for a total of eight seconds at a time.
21
In our current study, we made two modifications to the visual hints used in our previous work (Rouinfar, 2014). First, in the Graph task, we presented the one red tangent line for one second each followed by the next tangent line instead of showing all of the tangent lines at the same time for eight seconds. Second, in the Skier and Roller Coaster tasks, we highlighted each height section for one second at a time instead of highlighting the whole height from the start to
22
the end for eight seconds. The main reason for those changes is that we wanted to ensure that the visual hints for every training task across all of the task sets were similar in that each included animated cues which facilitated the learner to direct their attention from one area of the task diagram to the next in a sequence that would facilitate them to make the kinds of comparisons that would solve the task. For instance, in the Graph task students would need to focus on comparing the slopes of the two graphs at the same point in time, therefore the tangent lines on each graph appeared simultaneously at each point in time to facilitate such a comparison. Similarly, for the Skier tasks the learner had to compare height lost in various sections of the slope therefore the visual hint was an animated cue that sequentially highlighted the heights of each section of the slope. Essentially, all of our task sets were asking participants to make comparisons by using the information provided by statements of tasks and presented pictures. We want to convey the idea of “making a comparison” by using the manner of sequentially highlighting aspects of the picture that students had to compare, for all of our training tasks.
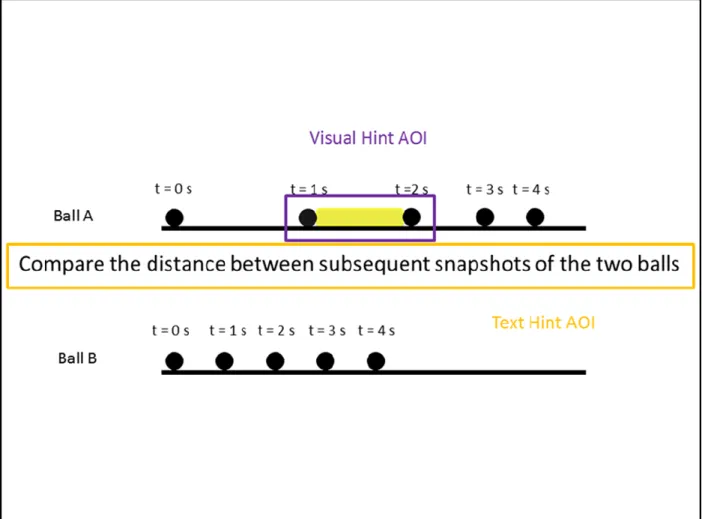
We used the same idea in the design of our text hints and audio hints, to ensure that the text hint conveyed the same meaning as the corresponding visual hint. For example, we highlighted the distance between two balls for every one-second as our visual hint for the ball tasks. The text hint we designed is “Compare the distance between subsequent snapshots of the two balls.” From our point of view, the word “compare” in the text hint is equivalent to the manner of sequentially highlighting elements in the diagram in the visual hint; the phrase “the distance between subsequence snapshots of the two balls” in the text hint is equivalent to the highlighted yellow area between two balls from the visual hint. An example of a text hint for the other task set could be seen in Figure 2-2. We invited the instructor (one of the co-authors) of the course that we recruited participants from to record audio hints since participants should be
23
familiar with his voice. The length of audio hints for all of the tasks was between seven to eight seconds long. This was the same duration as the visual hints and the text hint.
The multimedia hints were designed in accordance with most of Mayer’s Multimedia Learning Principles (Mayer, 2005b) as follows:
Spatial and Temporal Contiguity Principles: If more than one hint were being provided for one task, such as in the visual + text, visual + audio, text + audio, or visual + text + audio conditions, different hints were presented spatially close to each other and displayed
simultaneously. We put the text hint right above or below the place of the visual hint. Moreover, multiple hints were played at the same time.
Coherence Principle: All of the information presented in each of the conditions was relevant to the task. No extraneous text or information was provided to the students. When the multimedia hint was provided, the question text at the top of the slide was removed to avoid visual clutter.
Segmenting Principle: The hints were not presented in segments at a user-controlled pace. This was not deemed important in the context of our study because the length of each multimedia hint was only eight seconds and it could be viewed as many times as desired by the student.
Personalization Principle: The textual and audio hints used language and terminology that was familiar to the students and had been used in their class.
Voice Principle: The voice used in the audio version was the familiar voice of the instructor of the class.
Image Principle: No image of the speaker was used in the audio hints. Based on this principle, we decided that having the instructor’s image would not affect learning in any way.
24
Pre-Training Principle: All students had covered material in the class that was relevant to the conceptual task and thus had received pre-training.
In summary, we used Mayer’s multimedia design principles to design all of our hints. Further, we designed all of our hints to minimize the difference in information content, between the different conditions, such that the main difference between the conditions would be due to the different hint modalities.
Testing Hypotheses
As an experimental design with eight conditions, there could be as many as 28 pairwise comparisons. But not all of them are meaningful. Here we propose nine pairwise comparisons to test Mayer’s Multimedia Learning Principles (Mayer, 2005b) and Wickens’ MRT (2002) in our study.
There are two pairs of competing hypotheses we would like to test. Competing Hypotheses I
Hypothesis I-A: The visual + text condition will outperform the text condition. vs.
Hypothesis I-B: The visual + text condition will underperform the text condition. Hypothesis I-A is supported by the multimedia principle of Mayer’s CTML. It states, “Learners learn better when pictorial and linguistic information are presented together, rather than when linguistic information is presented alone” (Mayer, 2005b) According to this statement, adding visual hints to text hints would improve learning.
Hypothesis I-B is supported by Wickens’ MRT. Presenting visual hints and text together is, according to Wickens (2002), “intra-modal time-sharing” (pp. 164). This type of time-sharing
25
would hinder participants’ information processing. So, the text condition is predicted to have better performance than visual + text condition.
Competing Hypotheses II
Hypothesis II-A: The visual + text + audio condition will outperform the text + audio condition.
vs.
Hypothesis II-B: The visual + text + audio condition will underperform the text + audio condition.
Hypothesis II-A is supported by the multimedia principle because visual hints added to text and audio provide pictorial information along with linguistic information, while audio and text hints are linguistic information alone. Therefore, adding visual hints would improve participants’ problem solving performance.
Hypothesis II-B, on the other hand is supported by Wickens’ MRT. Adding visual cues interferes with other information presented in the visual modality, such as the picture and question of the problem, as well as the text cue. Therefore, the visual + text + audio condition will perform worse than the text + audio condition.
In addition to these two pairs of competing hypotheses, other hypotheses generated according to the principles of CTML and MRT are described below.
Hypothesis III: The visual condition will outperform the no hint condition.
Based on the signaling principle, cues that highlight the organization of the material improve learning. So participants who receive visual hints will outperform those that receive no hints.
26
This hypothesis is based on Mayer’s modality principle and Wickens’ MRT. Due to the dual-channel and limited capacity assumptions from CTML, and the fact that text and visual cues share the same modality in MRT, whereas visual and audio cues do not, narration facilitates learning better than on-screen text. Therefore, participants who receive audio hints will
outperform those that receive text hints.
Hypothesis V: The visual + audio condition will outperform either the visual or the audio condition.
Both Mayer’s CTML and Wickens’ MRT model are in favor of this hypothesis. These two theories all prefer sending information via multiple channels rather than just one channel. The condition with visual + audio hints presents information by using both the visual channel and the auditory channel. So the participants from this condition would be expected to have better performance than either the visual or audio conditions.
Hypothesis VI: Either the text or the audio conditions will outperform the text + audio condition.
This hypothesis is generated by Wickens’ MRT. Both text hints and audio hints use linguistic resources, so they will cause mutual interference when processed simultaneously. Therefore, the text + audio condition will underperform either text hints or audio hints.
Hypothesis VII: The visual condition will outperform the visual + text condition. Wickens’ MRT supports this hypothesis. Visual hints and text hints are both presented via the visual modality. Processing these two pieces of information may cause a heavy workload so that neither of them could be processed properly. Therefore, the visual + text condition would performance worse than the visual condition.
27
According to Wickens’ MRT, visual hints and audio hints use different modalities while visual hints and text hints use the same visual modality. Therefore, participants would benefit more learning from multiple modalities than from single modality.
Hypothesis IX: The visual + text OR audio conditions will outperform the visual + text + audio condition.
These comparisons test Mayer’s redundancy principle. The core idea of the redundancy principle is “less is better than more”. According to the redundancy principle, we hypothesize that the visual + text hint and visual + audio hint outperform the visual + test + audio hint, because they do not present redundant information to the learner.
A summary of the tested principles and hypothesized results is shown in Table 2-2.
Table 2-2 Nine pairs of comparison on testing Mayer’s CTML and Wickens’ model and the predicted results
Pairwise Comparison Theoretical Basis Hypothesized Result
I Visual + Text vs. Text Multimedia Principle (CTML)
Visual + Text > Text
Interference due to overloading of visual modality (CTML, MRT)
Visual + Text < Text
II Visual + Text + Audio vs. Text + Audio
Multimedia Principle (CTML)
Visual + Text + Audio > Text + Audio
Interference due to overloading of visual modality (CTML, MRT)
Visual + Text + Audio < Text + Audio
III Visual vs. No hint Signaling Principle (CTML)
Visual > No hint
IV Text vs. Audio Modality Principle (CTML, MRT)
28
Pairwise Comparison Theoretical Basis Hypothesized Result
V Visual + Audio vs. Visual/Audio
Dual-channel assumption; no interference between visual and audio modality (CTML, MRT) Visual + Audio > Visual/Audio VI Text/Audio vs. Text + Audio Interference due to overloading of linguistic resources (MRT)
Text/Audio > Text + Audio
VII Visual vs. Visual + Text Interference due to overloading of visual modality (MRT)
Visual < Visual + Text
VIII Visual + Audio vs. Visual + Text
Interference due to overloading of visual modality (MRT)
Visual + Audio > Visual + Text
IX Visual + Text/Audio vs. Visual + Text + Audio
Redundancy Principle (CTML)
Visual + Text/Audio > Visual + Text + Audio
Experiment Procedure
Each participant in this study completed an individual session lasting about 45 minutes on average. A short oral explanation of the interview was given to each participant before the interview started. The explanation included the goal of this study, the procedure of the
interview, a request for informed consent, and information regarding extra credit the participant would receive for their participation in the study.
Participants were randomly assigned to one of eight conditions: no hint (N = 20), visual only (N = 20), text only (N = 22), audio only (N = 21), visual + text (N = 18), visual + audio (N = 19), text + audio (N = 20), and visual + text + audio (N = 22). All participants solved all four task sets. Each task was presented on a computer screen. Participants were instructed to read the task carefully, view the hint when it was available, and then verbally provide their answer and
29
their reasoning supporting the answer to the interviewer when they were ready. In all of the seven hint conditions, there was a 10-second waiting time between the moments when the task was presented, and when participants could view the hint. We set this waiting time to avoid the participant rushing through tasks and hints without carefully reading the task. Participants had also been instructed that they could view hints as many times as they wanted. After participants provided their answer and reasoning to the interviewer, in some cases the interviewer asked some follow-up questions to clarify participants’ answers or reasons. The interviewer took notes on participants’ answers and reasons during the whole procedure of the interview. The entire interview session was audio and video recorded.
Results and Analysis
Scoring Procedure
The correctness of participants’ responses was determined after all interviews were finished. Four raters completed the rating. Each of them was assigned to one task set to
maximize consistency. To be coded as correct, a participant’s response needed to have both the correct answer and correct reason. An incorrect answer or a correct answer with wrong reason would be graded as incorrect. Each grader graded 10 participants’ interview notes with the help of videotapes. Afterward they discussed their ratings with the first author to have an agreement on a grading rubric for each task set. Then they graded all participants’ responses for one task set separately. They marked the ambiguity responses. After they finished all grading
assignments, the first author re-watched the videotapes for the ones that had been marked as difficult to rate, and re-rated them if necessary. The inter-rate reliabilities for each task set are listed in Table 2-3.
30
Table 2-3 Inter-rater Reliabilities for all task sets in all eight conditions
Ball Graph Roller Coaster Skier
Inter-rater Reliability
95.3% 98.3% 95.4% 96.6%
Missing Data 2.6% 1.9% 2.3% 2.1%
On some occasions, participants who were assigned conditions with hints accidentally gave the answers and reasons before they were presented with the hints and the interviewer did not remind the participant to view or listen to the hints. All of these responses were excluded from our data analysis, resulting in a small amount of data missing for each task set (see Table 2-3).
Initial and Transfer Task Performances
Initially, the performances on the initial tasks of each condition were analyzed. A Chi-square test was chosen to test the existence of a relationship between initial task performance and conditions. Four initial tasks from four task sets in our study functioned as a pretest. We would like to see how participants in each condition solved the initial tasks. The results of the Chi-square test showed no relationship between initial task performance and conditions, (21) = 22.484, p = 0.372. This result verified that there was no statistically significant difference in performances on initial tasks between the conditions (see Table 2-4).
Table 2-4 Average correct solving percentages with std. error on initial tasks, near transfer tasks, and far transfer tasks over all four task-sets in all eight conditions
Condition Initial Near Far
No Hint 10.0% ± 3.6% 18.8% ± 5.6% 25.0% ± 5.2%
Visual Only 11.3% ± 3.6% 32.5% ± 5.6% 31.3% ± 5.2%
31
Condition Initial Near Far
Audio Only 10.7% ± 3.5% 26.2% ± 5.5% 35.7% ± 5.1%
Visual + Text 4.2% ± 3.8% 30.6% ± 5.9% 33.3% ± 5.5%
Visual + Audio 15.8% ± 3.7% 34.2% ± 5.8% 31.6% ± 5.3%
Text + Audio 13.8% ± 3.6% 27.5% ± 5.6% 26.3% ± 5.2%
Visual + Text + Audio 6.8% ± 3.4% 30.7% ± 5.3% 34.1% ± 5.0%
Table 2-5 Average correct solving percentages with std. error on each training tasks over all four task-sets in all eight conditions
Condition Training Problem Average
% Correct #1 #2 #3 #4 #5 #6 No Hint 6.7% ± 6.3% 8.3% ± 6.5% 11.7% ± 6.6% 8.3% ± 6.8% 13.3% ± 6.8% 15.0% ± 6.9% 12.8% ± 4.9% Visual Only 36.7% ± 6.3% 51.7% ± 6.5% 45.0% ± 6.6% 41.7% ± 6.8% 33.1% ± 6.8% 43.8% ± 6.9% 34.8% ± 4.9% Text Only 28.7% ± 5.5% 37.5% ± 5.6% 32.0% ± 5.7% 37.6% ± 5.9% 36.1% ± 5.9% 39.3% ± 6.0% 33.0% ± 4.2% Audio Only 23.6% ± 5.8% 19.4% ± 5.9% 27.8% ± 6.0% 23.1% ± 6.2% 27.0% ± 6.2% 30.9% ± 6.3% 24.9% ± 4.5% Visual + Text 46.9% ± 6.1% 57.4% ± 6.3% 49.6% ± 6.4% 47.2% ± 6.6% 53.5% ± 6.6% 58.6% ± 6.7% 43.0% ± 4.7% Visual + Audio 42.6% ± 6.0% 43.5% ± 6.1% 48.5% ± 6.2% 52.9% ± 6.4% 44.1% ± 6.4% 57.4% ± 6.5% 41.3% ± 4.6% Text + Audio 37.5% ± 6.1% 29.2% ± 6.3% 28.4% ± 6.4% 31.1% ± 6.6% 32.8% ± 6.6% 39.2% ± 6.7% 30.0% ± 4.7% Visual + Text + Audio 44.7% ± 5.5% 48.2% ± 5.6% 41.1% ± 5.7% 46.5% ± 5.9% 53.1% ± 5.9% 50.2% ± 6.0% 39.7% ± 4.2%